

Abstract
Etrolizumab is an IgG1‐humanized monoclonal anti‐β7 integrin antibody. Phase III trials with induction and/or maintenance phases were conducted in patients with moderately‐to‐severely active ulcerative colitis (UC) who were either previously treated with tumor necrosis factor (TNF) inhibitors (HICKORY) or were TNF inhibitor naïve (HIBISCUS I/II, LAUREL, and GARDENIA). A total of eight exposure‐response analyses were conducted for two clinical outcomes (remission and endoscopic improvement) at the end of induction for studies HIBISCUS I/II (combined) and HICKORY and at the end of maintenance for studies HICKORY and LAUREL. Trough concentration at week 4 (C trough,wk4) of induction was selected as the exposure metric. Exposure‐response (ER) modeling was conducted using logistic regression. A full covariate model was used to examine the impact of covariates on clinical outcomes. Linear models with a single intercept for placebo and active treatments adequately described the data for all eight analyses. The etrolizumab exposure‐response slope was significant (p < 0.05) for seven of the eight analyses. Baseline Mayo Clinic Score (MCS) was the only statistically significant covariate that impacted induction remission and endoscopic improvement. No statistically significant covariate was identified to impact maintenance outcomes except for baseline fecal calprotectin on endoscopic improvement for LAUREL study. A statistically significant positive ER relationship was identified for most of the clinical outcomes tested, reflecting a better treatment effect in patients with UC with higher etrolizumab C trough,wk4 of induction. Baseline MCS was the only other significant covariate impacting induction efficacy. Besides C trough,wk4 of induction, no consistent covariate was identified to impact maintenance efficacy.
Study Highlights.
WHAT IS THE CURRENT KNOWLEDGE ON THE TOPIC?
Etrolizumab is an IgG1‐humanized monoclonal antibody that specifically targets the β7 subunit of α4β7 and α4Eβ7 integrins, and it has been evaluated for the treatment of moderately‐to‐severely active ulcerative colitis (UC). Maintenance of clinical remission, mucosal healing as quantified by endoscopic improvement, and avoidance of surgery are some of the key therapeutic goals for UC.
WHAT QUESTION DID THIS STUDY ADDRESS?
The objective of this analysis was to characterize the exposure‐response (ER) relationships and assess confounding effects on ER in patients with UC during the induction and maintenance phases of treatment.
WHAT DOES THIS STUDY ADD TO OUR KNOWLEDGE?
Higher etrolizumab exposure and lower baseline mayo clinical score are associated with a greater probability of remission and endoscopic improvement in patients with UC.
HOW MIGHT THIS CHANGE DRUG DISCOVERY, DEVELOPMENT, AND/OR THERAPEUTICS?
Characterization of exposure–efficacy relationships may facilitate dose optimization in patients with UC receiving etrolizumab treatment.
INTRODUCTION
Inflammatory bowel disease is a chronic gastrointestinal condition that severely affects quality of life, and often requires invasive surgery. 1 , 2 , 3 It encompasses two distinct entities, ulcerative colitis (UC) and Crohn’s disease (CD), which have overlapping symptoms and are both triggered by specific or multiple genetic and environmental factors in susceptible individuals. 4 UC and CD are characterized by intestinal immune cell infiltration leading to pro‐inflammatory signaling and tissue destruction. Maintenance of clinical remission, mucosal healing as quantified by endoscopic improvement, and avoidance of surgery are some of the key therapeutic goals for UC.
Traditional therapies for UC include corticosteroids, 5‐aminosalicyclic acid, and thiopurines. However, these conventional therapies are not well‐tolerated by many patients and long‐term use often leads to other complications. Tumor necrosis factor alpha (TNF‐α) inhibitors (infliximab, adalimumab, and golimumab) have been used with success due to an established correlation between increased production of TNF‐α and UC. 5 Although TNF‐α inhibitors have improved the treatment options for UC, around 10–30% of the patients do not respond to the initial treatment and 23–46% lose response over time. 6 Additionally, the risk of serious infections due to the immunosuppressive nature of the TNF inhibitors further underscores the need for alternative treatments.
Etrolizumab is a novel, humanized anti‐β7 integrin antibody that selectively inhibits both the α4β7:MAdCAM‐1‐mediated leukocyte trafficking to the gut mucosa as well as αEβ7:E‐cadherin‐mediated leukocyte retention in the intra‐epithelial space, reducing the inflammatory effects on the gut lining. 7 , 8 , 9 Seven trials (1 phase I [ABS4246g], 1 phase II [EUCALYPTUS], and 5 phase III [HIBISCUS I, HIBISCUS II, HICKORY, LAUREL, and GARDENIA]) using etrolizumab have been completed in patients with UC. 10 , 11 , 12 , 13 , 14 , 15 The dosing regimen of 105 mg every 4 weeks (Q4W) subcutaneously (s.c.) investigated in phase III studies was selected based on the totality of safety and efficacy data from both phase I and phase II studies.
Etrolizumab met the primary end points in HIBISCUS I and HICKORY (induction) and did not meet the primary end points in HIBISCUS II, LAUREL, HICKORY (maintenance), and GARDENIA. 10 , 11 , 12 , 14 However, etrolizumab consistently trended toward increased efficacy in all end points compared with placebo. One of the questions raised from the mixed results from etrolizumab UC phase III trials is whether better efficacy could be achieved in patients with higher drug exposure. To address this, analyses were performed using data from phase III trials to characterize the exposure‐response (ER) relationships and assess confounding effects on ER in patients with UC during the induction and maintenance phases of treatment. We report here the exposure‐efficacy relationships for etrolizumab induction and maintenance therapies, including the potential effects of baseline covariates, in patients with moderately‐to‐severely active UC.
METHODS
Study ethics
All trials were approved by the institutional review board or independent ethics committee. All patients provided written informed consent. All authors had access to the study data and reviewed and approved the final manuscript.
Study design and clinical outcomes
ER analyses were conducted on data obtained from four phase III trials (HIBISCUS I/II, HICKORY, and LAUREL). The phase III clinical trials for etrolizumab were composed of either induction phase only or induction and maintenance phases. For the studies with induction and maintenance phases, only patients who achieved a clinical response at the end of the induction phase were re‐randomized into the maintenance phase to receive placebo or active treatment. The duration of the induction phase depends on the TNF status and was 10 weeks for HIBISCUSI/II (TNF‐naïve population) and 14 weeks for HICKORY (TNF‐experienced population). The duration of the maintenance phase was 52 weeks for LAUREL (TNF‐naïve population) and HICKORY (TNF‐experienced population). Clinical outcomes for efficacy were assessed at the end of induction for HIBISCUS I/II and HICKORY trials and at the end of maintenance for HICKORY and LAUREL trials. The clinical outcomes included in the ER analyses were: (i) remission defined as Mayo Clinic Score (MCS) less than or equal to 2, with individual subscores of less than or equal to 1 and a rectal bleeding subscore of 0, and (ii) endoscopic improvement defined as endoscopic subscore less than or equal to 1.
HIBISCUS I/HIBISCUS II (NCT02163759/NCT02171429) were two replicate phase III, double‐blind, placebo and active‐comparator controlled, multicenter studies. Patients were randomized in 2:2:1 ratio to one of three treatments: etrolizumab 105 mg s.c. Q4W, adalimumab 160/80/40 mg s.c. at weeks 0/2/4, 6, and 8, respectively, or placebo. The efficacy end points used in this ER analysis were induction of remission and endoscopic improvement at week 10.
HICKORY (NCT02100696) was a phase III, double‐blind, placebo‐controlled, multicenter study. The study started with the 14‐week induction phase (cohort 1: open label etrolizumab 105 mg s.c. Q4W; and cohort 2: randomized [4:1] to etrolizumab 105 mg s.c. Q4W or placebo). Thereafter, patients in the etrolizumab arms who achieved a clinical response at week 14 (MCS with ≥3‐point decrease and ≥30% reduction from baseline as well as ≥1‐point decrease in rectal bleeding subscore or an absolute rectal bleeding score of 0 or 1) from both cohorts 1 and 2 were randomized (1:1 etrolizumab or placebo) to the 52‐week double‐blind maintenance phase, whereas responding placebo patients continued blinded treatment with placebo. The efficacy end points used in the ER analysis were induction of remission and endoscopic improvement at week 14; and maintenance of remission and endoscopic improvement at week 66. ER analysis for induction only included patients from cohort 2. The ER analysis for maintenance included patients from cohorts 1 and 2 but excluded patients in the placebo arm who achieved a clinical response at week 14 and continuing in maintenance because these patients were not re‐randomized and stayed on blinded placebo during the maintenance phase.
LAUREL (NCT02165215) was a phase III, randomized, double‐blind, parallel‐grouped, placebo‐controlled, multicenter study. The study started with the 10 weeks open‐label induction phase (etrolizumab 105 mg s.c. Q4W). Thereafter, patients who achieved clinical response at week 10 were randomized by week 12 (1:1 etrolizumab or placebo) to a 52‐week double‐blind maintenance phase. The efficacy end points used in the ER analysis were maintenance of remission and endoscopic improvement at week 62.
Eligible patients for all the trials were adults aged 18–80 years with moderately‐to‐severely active UC, defined as a MCS of 6–12 with centrally read endoscopic subscore of greater than or equal to 2, rectal bleeding subscore of greater than or equal to 1, and stool frequency subscore of greater than or equal to 1. All patients had an established diagnosis of UC for greater than or equal to 3 months, corroborated by both clinical and endoscopic evidence, and evidence of disease extending greater than or equal to 20 cm from the anal verge. Included patients must have had treatment with one or two induction regimens that contained TNF inhibitors within the past 5 years for HICKORY and be TNF‐naïve for HIBISCUS I/II and LAUREL trials.
Data sets and exposure‐response analysis
The analysis data set included the patient clinical outcomes and the predicted exposures based on individual pharmacokinetic (PK) data using a separately developed population PK model. 16 The ER analyses during induction included 429 and 476 patients from the HIBISCUS I/II and HICKORY trials, respectively. The ER analyses during maintenance included 226 and 210 patients from the HICKORY and LAUREL trials, respectively.
The selection of exposure metric for the ER analyses was mainly based on PK characteristics of etrolizumab as found during the population PK analysis, notably a clearance decreasing with time according to an exponential function, stepping down after each subsequent dose. 16 Because of this PK behavior, an increased exposure at a later stage may be due to disease modification during induction and cannot be assumed to be an independent metric. Therefore, the predicted concentration at the first trough (week 4, C trough,wk4) was used in ER models for induction. For maintenance, the Ctrough,wk4 of induction and the first trough at week 4 of maintenance were compared. The first trough during maintenance was only preferred if (i) the correlation with C trough of induction was not high (ρ < 0.6) and/or (ii) it appeared to better predict maintenance outcome. Aforementioned independence, related to the time‐varying clearance, was also taken into account for this evaluation. The correlation with other exposure parameters was evaluated.
In order to inform the ER model development, the individual outcomes and percentage of patients with positive outcome were graphically explored. Eight phases/trials/outcomes are reported in this paper. These include evaluation of ER for remission and endoscopic improvement in TNF‐naïve patients (induction – HIBISCUS I/II; maintenance – LAUREL) and TNF‐experienced patients (induction and maintenance – HICKORY) using both the starting ER model and covariate models described below.
The ER modeling was conducted using logistic regression in R. Model fitting was performed by first fitting a univariate base model with etrolizumab exposure as the only covariate in order to describe the major trends dependent on drug exposure. Next, the impact of prespecified prognostic (MCS; smoking status) and potentially confounding (fecal calprotectin [FeCal]; C‐reactive protein [CRP]; and albumin) covariates on clinical end points was examined in a full covariate model. The potentially confounding covariates are those expected to correlate with both etrolizumab exposure as well as with clinical end points. TNF‐α antagonist was not tested as a covariate because the efficacy was evaluated separately in TNF‐naïve and TNF‐experienced patients. The covariate model (final model) is presented in Equation 1.
| (1) |
Covariate relationships were included on the logit scale. Continuous covariate relationships were implemented as linear models and categorical covariate relationships were implemented as a difference between the covariate and a normalized reference covariate, which in most cases was the median or mode.
RESULTS
Study population
Patient demographics and baseline characteristics for the HIBISCUS I/II, HICKORY, and LAUREL studies have been published earlier. 11 , 12 , 14 Characteristics relevant to the ER analyses are presented in Tables [Link], [Link].
Exposure metric selection
For ER analysis at the end of the induction phase, the predicted C trough,wk4 of induction was used. For ER analysis at the end of maintenance phase, C trough,wk4 of induction was also used given it was highly correlated with C trough,wk4 of maintenance (r 2 > 0.93). C trough,wk4 of induction, average concentration at steady‐state, and C trough at steady‐state were also highly correlated (r 2 > 0.94). Furthermore, in patients who received etrolizumab during induction and placebo during maintenance, no confounding effect was seen between C trough,wk4 of induction and the clinical outcomes during maintenance. These results support the selection of a single exposure metric, C trough,wk4 of induction, for all ER analyses.
ER graphical exploration
Etrolizumab C trough,wk4 of induction were grouped by tertiles based on all studies (first tertile: ≥0.550 to <3.00 μg/ml, second tertile: ≥3.00 to <4.56 μg/ml, and third tertile ≥4.56 to <14.0 μg/ml) and clinical outcome rates calculated for each tertile. Adalimumab PK was not measured, and it was presented as a treatment group. The graphical analysis showed a clear positive relationship between C trough,wk4 of induction and both remission and endoscopic improvement at the end of induction and maintenance (Figure 1). The proportions of patients in the third or highest exposure tertile achieving induction and maintenance remission and endoscopic improvement were higher than those in the first or lowest exposure tertile, and in the placebo group. The positive ER trend for LAUREL at the end of the maintenance was less apparent. Conversely, subjects achieving the positive outcome (i.e., remission and endoscopic improvement) had higher exposures in both induction and maintenance phases (Figure S1). Clinical responders during induction that were thus included in the maintenance phase had somewhat higher exposures too.
FIGURE 1.
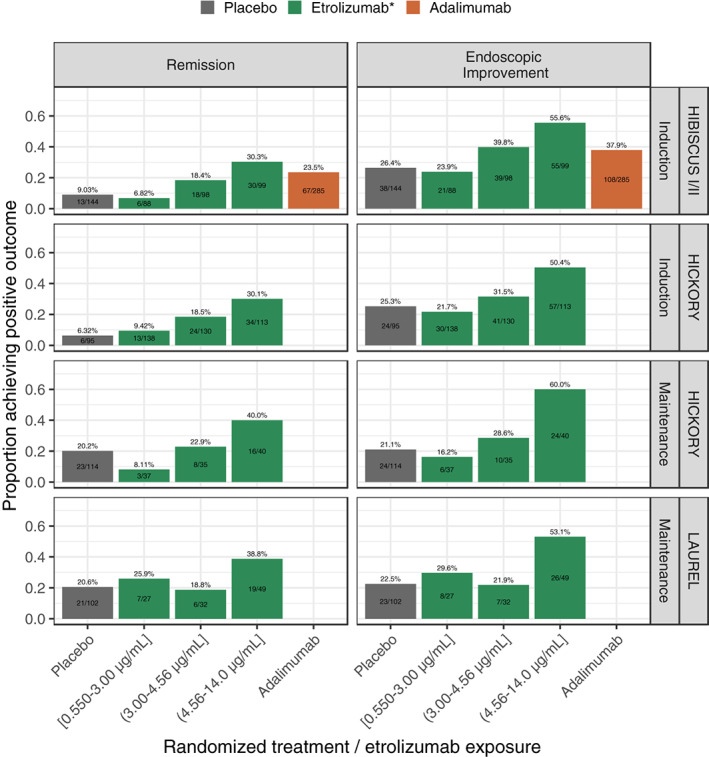
Proportion of patients achieving remission and endoscopic improvement per treatment group and etrolizumab exposure tertiles based on C trough at week 4 of induction, stratified by study and phase. Percentage numbers and bars represent the percentage achieving the clinical outcome with bars colored by the treatment arm. The text displayed inside the bars represent the number of patients with the positive outcome over the total number of patients. C trough, trough concentration; Q4W, every 4 weeks; s.c., subcutaneous.
ER relationships at the end of induction
The ER for remission and endoscopic improvement at the end of induction was evaluated in TNF‐naïve (HIBISCUS I/II) and in TNF‐experienced (HICKORY) patients. Increasing Ctrough,wk4 during induction was associated with a statistically significant greater probability of achieving remission and endoscopic improvement at the end of induction in TNF‐naïve and TNF‐experienced patients (Table 1). This relationship suggested a mean increase of ~12.4% and 16.0% of the rate of remission and endoscopic improvement, respectively, in TNF‐naïve patients for an increase of C trough,wk4 from 2.18 μg/ml (low exposure: median exposure for the lowest exposure tertile across all patients on active treatment during induction) to 5.54 μg/ml (high exposure: median exposure for the highest exposure tertile across all patients on active treatment during induction; Figure 2). For TNF‐experienced patients, this relationship suggested a mean increase of ~9.34% and 12.5% of the rate of remission and endoscopic improvement, respectively, for an increase of C trough,wk4 from 2.18 to 5.54 μg/ml (Figure 2). Baseline MCS was identified as a key baseline factor contributing to the variability in individual response to etrolizumab (Tables S5 and S6), with the probability of achieving remission and endoscopic improvement decreased with higher baseline MCS (Figure 3). Baseline FeCal, CRP, albumin, and smoking status did not have a statistically significant impact on any of the clinical end points at the end of induction (Figures S2 and S2; Tables S5 and S6).
TABLE 1.
Logistic RSE for remission and endoscopic improvement in the final models
| Data/outcome | Patient population | Etrolizumab slope | RSE (%) | p value |
|---|---|---|---|---|
| HIBISCUS I/II, induction | TNF‐naïve | |||
| Remission | 0.32 | 18.5 | 1.16E‐07 | |
| Endoscopic improvement | 0.19 | 23.0 | 1.69E‐05 | |
| HICKORY, induction | TNF‐experienced | |||
| Remission | 0.24 | 25.4 | 9.55E‐05 | |
| Endoscopic improvement | 0.16 | 30.0 | 0.00092 | |
| HICKORY, maintenance | TNF‐experienced | |||
| Remission | 0.14 | 45.3 | 0.028 | |
| Endoscopic improvement | 0.23 | 28.0 | 0.00044 | |
| LAUREL, maintenance | TNF‐naïve | |||
| Remission | 0.11 | 54.6 | 0.069 | |
| Endoscopic improvement | 0.19 | 31.8 | 0.0019 |
Abbreviations: RSE, relative standard error; TNF, Tumor necrosis factor.
FIGURE 2.
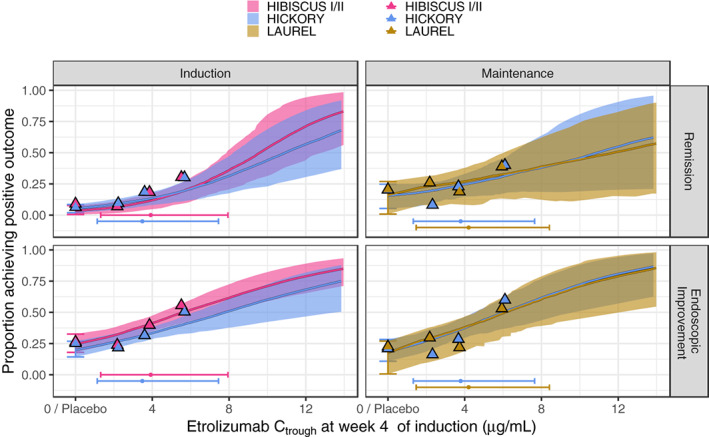
Simulated proportion of patients achieving remission (upper panel) and endoscopic improvement (lower panel) versus etrolizumab C trough at week 4 of induction based on 200‐sample bootstraps performed for the final models. The thick colored lines and shaded areas depict the median and 90% confidence interval, respectively. The vertical error bar shows the 90% confidence interval for placebo. Colored triangles indicate the observed remission (upper panel) and endoscopic improvement (lower panel) rates for placebo and for the exposure tertiles with the x‐value at the associated median exposure. The horizontal error bars represent the 5th to 95th percentile of the observed C troughs within the studies and the superimposed dot depicts the median. C trough, trough concentration.
FIGURE 3.
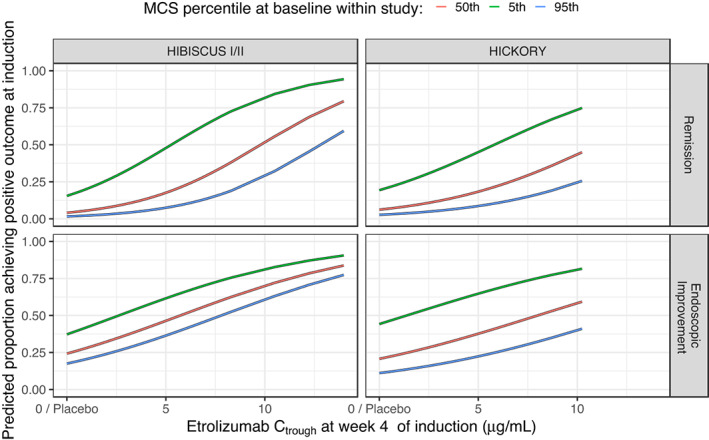
Predicted proportion of patients achieving remission (upper panel) and endoscopic improvement (lower panel) at the end of induction versus Mayo Clinic Score (MCS) at baseline based on the final models. Baseline MCS for both studies were 6, 9, and 11 for the 5th, 50th, and 95th percentiles, respectively. C trough, trough concentration.
ER relationships at the end of maintenance
The ER for remission and endoscopic improvement at the end of maintenance was evaluated in TNF‐naïve (LAUREL) and in TNF‐experienced (HICKORY) patients. Increasing C trough,wk4 during induction was associated with a statistically significant greater probability of achieving remission and endoscopic improvement at the end of maintenance in TNF‐experienced patients, and in achieving endoscopic improvement but not remission in TNF‐naïve patients (Table 1). This relationship suggested a mean increase of ~7.83% and 15.6% of the rate of remission and endoscopic improvement, respectively, in TNF‐naïve patients for an increase of C trough,wk4 from 2.18 to 5.54 μg/ml (Figure 2). For TNF‐experienced patients, this relationship suggested a mean increase of ~9.34% and 17.9% of the rate of remission and endoscopic improvement, respectively, for an increase of C trough,wk4 from 2.18 to 5.54 μg/ml (Figure 2). No covariates were found to impact remission and endoscopic improvement during maintenance except the impact of FeCal on the endoscopic improvement in TNF‐naïve patients. Higher baseline levels of FeCal are expected to result in a lower probability of achieving endoscopic improvement in TNF‐naïve patients but not in TNF‐experienced patients (Figure 4, Tables S7 and S8). Baseline MCS, CRP, albumin, and smoking status did not have a statistically significant impact on any of the clinical end points at the end of maintenance (Figures S2 and S2; Tables S7 and S8).
FIGURE 4.
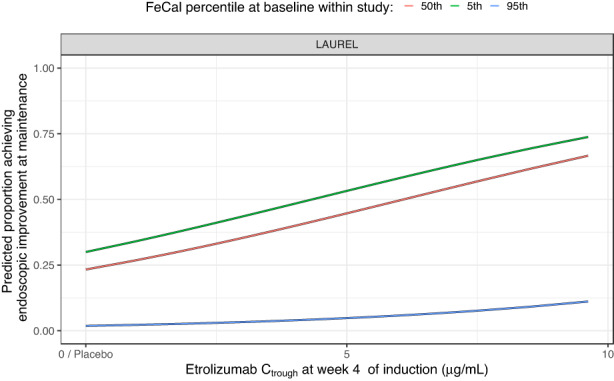
Predicted proportion of patients achieving endoscopic improvement at end of maintenance versus fecal calprotectin at baseline based on the final endoscopic improvement model in TNF‐naïve patients. Baseline fecal calprotectin levels for the LAUREL study were 110.9, 990.5, and 8096.8 μg/g for the 5th, 50th, and 95th percentiles, respectively. C trough, trough concentration.
DISCUSSION
The ER analyses are an integral part of clinical drug development and regulatory decision making. In this study, we report the ER analysis from four phase III trials with induction and/or maintenance phases in patients with moderately‐to‐severely active UC treated with a flat dose (105 mg Q4W) of etrolizumab (HIBISCUS I, HIBISCUS II, HICKORY, and LAUREL). Given the key purpose of the ER analysis was to evaluate the flat dosing, the landmark ER modeling served the purpose and longitudinal modeling approach was not considered. The GARDENIA study was not included as part of the ER analysis because of its different study design and clinical end points. Results of the ER analysis for the primary end point (remission) and key secondary end point (endoscopic improvement) are reported. The results from our analyses support the selection of a single exposure metric, C trough,wk4 of induction, and demonstrate positive ER relationships between etrolizumab C trough,wk4 of induction and remission and endoscopic improvement at the end of induction and maintenance. Based on the population PK analysis, etrolizumab showed time‐dependent PKs. Clearance decreased over time with a half‐life of 4.81 weeks after a 4‐week lag time. The median decrease in clearance was 26.3%. The time‐dependent clearance decline could be attributed to disease improvement including mucosa healing and less inflammation burden. Patients with a low clearance reduction (mean = 22.6%) had outcomes equal to or worse than placebo, whereas those with the highest clearance reduction (mean = 33.1%) had approximately twofold improved outcomes over the placebo. Thus, the selection of early exposure metric, C trough,wk4 of induction, could avoid the potential confounding issue. 16
From the regression analysis, etrolizumab concentration (C trough,wk4 of induction) was the strongest factor in predicting remission and endoscopic improvement during induction and maintenance. Published studies on vedolizumab revealed that higher serum concentrations at week 6 were associated with higher induction remission rates in patients with moderately‐to‐severely active UC. 17 In the ER analyses of golimumab in patients with moderately‐to‐severely active UC, higher golimumab serum concentrations at week 6 and at steady‐state were statistically significant predictors of remission during induction and maintenance, respectively. 18
In the ER analyses, the impact of prespecified prognostic (MCS and smoking status) and potentially confounding (FeCal; C‐RP; and albumin) covariates on clinical end points were examined in a full covariate model. The selection of these predefined covariates is based on the previous understanding of PK variability and prognostic risk factors for clinical outcomes. Among the covariates, baseline MCS, an indicator of disease severity, was identified as a key baseline factor associated with efficacy of induction. Both TNF‐naïve and TNF‐experienced patients with UC with lower baseline MCS showed higher probability of achieving remission and endoscopic improvement at the end of induction. A similar finding was reported by Adedokun et al., 18 in which lower baseline MCS scores were statistically significant predictors of remission during induction of golimumab treatment. Lower baseline levels of fecal calprotectin are expected to result in a higher probability of achieving endoscopic improvement at the end of maintenance in TNF‐naïve patients but not in TNF‐experienced patients. FeCal calprotectin at baseline was previously reported to impact the probability of the end of induction remission with vedolizumab treatment. 17 No covariates were identified for the ER analyses for remission at the end of maintenance for etrolizumab. Similarly, the ER analyses of remission at the end of maintenance for golimumab did not identify any significant covariates. 18 It should be noted that these prognostic factors are relevant for patients treated with placebo. Published studies 17 on vedolizumab revealed that TNF‐naïve patients had a higher probability of a remission at the end of induction. In the etrolizumab studies, because the efficacy was evaluated separately in TNF‐naïve and TNF‐experienced patients, TNF‐α antagonist was not tested as a covariate. However, the estimated ER slopes in TNF‐naïve and TNF‐experienced patients were comparable, indicating similar ER relationships in both populations. Other predictors, such as female gender and higher baseline albumin concentration, were statistically significant predictors of remission during induction for golimumab 18 and vedolizumab 17 treatments, respectively, but were not identified in the etrolizumab ER analyses.
In this study, precautions were taken to minimize the probability for confounding. First, covariates that were expected to correlate with both etrolizumab exposure as well as with outcome were identified (MCS, FeCal, CRP, and albumin) based on the previous understanding of PK variability and prognostic risk factors for clinical outcomes and adjusted for in the prespecified covariate ER models. Second, an exposure metric was selected for the ER analysis, which was expected to be independent of the clinical end points. 16 Generally, with less inflammation, albumin levels increase, and the change in albumin levels therefore serve as a marker of disease status. As such, an exposure metric representing the exposure over the full trial period would be affected by this decrease and could be a biomarker for outcome without being the cause itself or at least introduce a bias for the estimated treatment effect (i.e., the ER slope would be overestimated). As a conservative measure, the Ctrough,wk4 at induction was selected as the exposure metric because the effect on clearance had not yet taken place. In addition, this highlights the importance of a sufficient induction dose at the beginning of the treatment as it predicts the maintenance outcome.
It appeared that the ER relationship identified using phase III clinical data was different from the one using the phase II EUCALYPTUS study clinical data, where no apparent ER relationship was identified with wider exposure range compared to phase III clinical trials. 19 The plausible reasons could include the small sample size (only 81 etrolizumab‐treated patients), different populations (all comers including both TNF‐naïve and TNF‐experienced population) from phase II studies. In addition, there were some limitations of ER analyses using phase III clinical trials, such as the use of a single dose for both induction and maintenance. Furthermore, the potential unbalanced distribution of prognostic factors across different exposure groups from a single dose level clinical trial could result in a bias of the evaluation of the ER relationship. Additionally, this type of ER analysis has its own limitations because the evaluation of ER is at a specific timepoint rather than evaluating the entire time‐course.
CONCLUSIONS
Although the primary end points from the pivotal studies within the phase III UC program were not all met, higher exposure was consistently associated with statistically significant improvements in both remission and endoscopic improvement. Whereas the exposure tertile analyses suggest that higher exposure during induction was associated with greater remission and endoscopic improvement during both induction and maintenance, it cannot be ruled out that the single dose level evaluated in these phase III studies might have caused an upward bias due to confounding factors in the estimation of ER, despite the efforts to adjust for this.
AUTHOR CONTRIBUTIONS
All authors wrote the manuscript. N.K., Rui Z., A.M., Rong Z., W.Z., M.T.T., and Y.S.O. designed and performed the research. J.R. and J.L. analyzed the data.
FUNDING INFORMATION
This paper was supported by F. Hoffmann‐La Roche Ltd. and Genentech, Inc. The study was sponsored by Genentech.
CONFLICT OF INTEREST
N.K., Rui Z., A.M., Rong Z., and W.Z. are employees of Genentech and own Roche stocks. M.T.T. and Y.S.O. were employees of Genentech at the time of the study completion and own Roche stock. J.R. and J.L. are employees of Pharmetheus and are paid consultants for Genentech, Inc. J.R. owns stocks in Pharmetheus.
Supporting information
Figure S1
Figure S2
Table S1
Table S2
Table S3
Table S4
Table S5
Table S6
Table S7
Table S8
ACKNOWLEDGEMENTS
The authors thank the patients and their families who participated in these studies, and the physicians and staff who conducted and/or managed these studies. Support for third‐party writing assistance was provided by Anshin Biosolutions Inc.
Kassir N, Zhu R, Moein A, et al. Exposure‐response relationships of etrolizumab in patients with moderately‐to‐severely active ulcerative colitis. CPT Pharmacometrics Syst Pharmacol. 2022;11:1234‐1243. doi: 10.1002/psp4.12840
Nastya Kassir and Rui Zhu contributed equally to this paper.
REFERENCES
- 1. Borren NZ, van der Woude CJ, Ananthakrishnan AN. Fatigue in IBD: epidemiology, pathophysiology and management. Nat Rev Gastroenterol Hepatol. 2019;16:247‐259. [DOI] [PubMed] [Google Scholar]
- 2. Carter MJ, Lobo AJ, Travis SP, IBD Section, British Society of Gastroenterology . Guidelines for the management of inflammatory bowel disease in adults. Gut. 2004;53(Suppl 5):V1‐V16. [DOI] [PMC free article] [PubMed] [Google Scholar]
- 3. Casellas F, Lopez‐Vivancos J, Vergara M, Malagelada J. Impact of inflammatory bowel disease on health‐related quality of life. Dig Dis. 1999;17:208‐218. [DOI] [PubMed] [Google Scholar]
- 4. Zhang YZ, Li YY. Inflammatory bowel disease: pathogenesis. World J Gastroenterol. 2014;20:91‐99. [DOI] [PMC free article] [PubMed] [Google Scholar]
- 5. Braegger CP, Nicholls S, Murch SH, Stephens S, MacDonald TT. Tumour necrosis factor alpha in stool as a marker of intestinal inflammation. Lancet. 1992;339:89‐91. [DOI] [PubMed] [Google Scholar]
- 6. Roda G, Jharap B, Neeraj N, Colombel JF. Loss of response to anti‐TNFs: definition, epidemiology, and management. Clin Transl Gastroenterol. 2016;7:e135. [DOI] [PMC free article] [PubMed] [Google Scholar]
- 7. Andrew DP, Berlin C, Honda S, et al. Distinct but overlapping epitopes are involved in alpha 4 beta 7‐mediated adhesion to vascular cell adhesion molecule‐1, mucosal addressin‐1, fibronectin, and lymphocyte aggregation. J Immunol. 1994;153:3847‐3861. [PubMed] [Google Scholar]
- 8. Cepek KL, Parker CM, Madara JL, Brenner MB. Integrin alpha E beta 7 mediates adhesion of T lymphocytes to epithelial cells. J Immunol. 1993;150:3459‐3470. [PubMed] [Google Scholar]
- 9. Zundler S, Becker E, Schulze LL, Neurath MF. Immune cell trafficking and retention in inflammatory bowel disease: mechanistic insights and therapeutic advances. Gut. 2019;68:1688‐1700. [DOI] [PubMed] [Google Scholar]
- 10. Danese S, Colombel JF, Lukas M, et al. Etrolizumab versus infliximab for the treatment of moderately to severely active ulcerative colitis (GARDENIA): a randomised, double‐blind, double‐dummy, phase 3 study. Lancet Gastroenterol Hepatol. 2022;7:118‐127. [DOI] [PubMed] [Google Scholar]
- 11. Peyrin‐Biroulet L, Hart A, Bossuyt P, et al. Etrolizumab as induction and maintenance therapy for ulcerative colitis in patients previously treated with tumour necrosis factor inhibitors (HICKORY): a phase 3, randomised, controlled trial. Lancet Gastroenterol Hepatol. 2022;7:128‐140. [DOI] [PubMed] [Google Scholar]
- 12. Rubin DT, Dotan I, DuVall A, et al. Etrolizumab versus adalimumab or placebo as induction therapy for moderately to severely active ulcerative colitis (HIBISCUS): two phase 3 randomised, controlled trials. Lancet Gastroenterol Hepatol. 2022;7:17‐27. [DOI] [PubMed] [Google Scholar]
- 13. Rutgeerts PJ, Fedorak RN, Hommes DW, et al. A randomised phase I study of etrolizumab (rhuMAb beta7) in moderate to severe ulcerative colitis. Gut. 2013;62:1122‐1130. [DOI] [PMC free article] [PubMed] [Google Scholar]
- 14. Vermeire S, Lakatos PL, Ritter T, et al. Etrolizumab for maintenance therapy in patients with moderately to severely active ulcerative colitis (LAUREL): a randomised, placebo‐controlled, double‐blind, phase 3 study. Lancet Gastroenterol Hepatol. 2022;7:28‐37. [DOI] [PubMed] [Google Scholar]
- 15. Vermeire S, O'Byrne S, Keir M, et al. Etrolizumab as induction therapy for ulcerative colitis: a randomised, controlled, phase 2 trial. Lancet. 2014;384:309‐318. [DOI] [PubMed] [Google Scholar]
- 16. Moein A, Lu T, Jönsson S. Population pharmacokinetic analysis of etrolizumab in patients with moderately‐to‐severely active ulcerative colitis. Twelfth American Conference on Pharmacometrics (ACoP12) Virtual; 2021. [DOI] [PMC free article] [PubMed]
- 17. Rosario M, French JL, Dirks NL, et al. Exposure‐efficacy relationships for vedolizumab induction therapy in patients with ulcerative colitis or Crohn's disease. J Crohns Colitis. 2017;11:921‐929. [DOI] [PubMed] [Google Scholar]
- 18. Adedokun OJ, Xu Z, Marano CW, et al. Pharmacokinetics and exposure‐response relationship of golimumab in patients with moderately‐to‐severely active ulcerative colitis: results from phase 2/3 PURSUIT induction and maintenance studies. J Crohns Colitis. 2017;11:35‐46. [DOI] [PMC free article] [PubMed] [Google Scholar]
- 19. Sandborn WJ, Schreiber S, Tang MT, Tatro AR, Oh YS, Maciuca R. P395 Etrolizumab demonstrated no difference among doses in symptomatic and endoscopic‐based evaluation of remission in anti‐TNF‐α‐naïve patients in a post‐hoc analysis of the phase 2 ulcerative colitis trial (EUCALYPTUS). J Crohn's Colitis. 2017;11:S278‐S279. [Google Scholar]
Associated Data
This section collects any data citations, data availability statements, or supplementary materials included in this article.
Supplementary Materials
Figure S1
Figure S2
Table S1
Table S2
Table S3
Table S4
Table S5
Table S6
Table S7
Table S8