ABSTRACT
The gut microbiota of sika deer has been widely investigated, but the spatial distribution of symbiotic microbes among physical niches in the gastrointestinal tract remains to be established. While feces are the most commonly used biological samples in these studies, the accuracy of fecal matter as a proxy of the microbiome at other gastrointestinal sites is as yet unknown. In the present study, luminal contents obtained along the longitudinal axis of deer gastrointestinal tract (rumen, reticulum, omasum, abomasum, small intestine, cecum, colon, and rectum) were subjected to 16S rRNA gene sequencing for profiling of the microbial composition, and samples from the rumen, small intestine, and cecum were subjected to metabolomic analysis to evaluate short-chain fatty acid (SCFA) profiles. Prevotella bacteria were the dominant gastric core microbes, while Christensenellaceae_R-7_group was predominantly observed in the intestine. While the eight gastrointestinal sites displayed variations in microbial diversity, abundance, and function, they could be clustered into stomach, small intestine, and large intestine segments, and the results further highlighted a specific microbial niche of the small intestine. SCFA levels in the rumen, small intestine, and cecum were significantly different, with Bacteroidetes and Spirochaetes were shown to play a critical role in SCFA production. Finally, the rectal microbial composition was significantly correlated with colonic and cecum communities but not those of the small intestine and four gastric sites. Quantification of the compositions and biogeographic relationships between gut microbes and SCFAs in sika deer should provide valuable insights into the interactions contributing to microbial functions and metabolites.
IMPORTANCE Feces or specific segments of the gastrointestinal tract (in particular, the rumen) were sampled to explore the gut microbiome. The gastrointestinal biogeography of the luminal microbiota in ruminants, which is critical to guide accurate sampling for different purposes, is poorly understood at present. The microbial community of the rectal sample (as a proxy of fecal sample) showed higher correlation with those of other large intestinal sites relative to the small intestine or stomach, suggesting that the microbial composition is specifically shaped by the unique physiological characteristics of different gastrointestinal niches. In addition, significant differences in microbiomes and SCFAs were observed among the different gastrointestinal sites.
KEYWORDS: gut microbiome, short-chain fatty acids, gastrointestinal tract, biogeography, deer, ruminants
INTRODUCTION
The gastrointestinal tract (GIT) is the main region of food digestion and nutrient absorption, although its components are distinct among ruminants, monogastric animals, and birds. Notably, different regions of the GIT serve as diverse niches with distinct physicochemical conditions as a result of their immediate surrounding environment and specific function (1, 2). The GIT microbiota constitutes a complex ecosystem that plays a critical role in maintaining host physiological homeostasis (3, 4), and the microbial communities within different GIT segments should be regarded as distinct microecosystems (5, 6). Therefore, clarification of the biogeography of GIT microbial communities in animals is of significant research interest. Fecal samples are the major animal biomaterial employed for studies on gut microbiota (7). However, the extent to which stool reflects the microbial composition at GIT is poorly understood, and the suitability of feces as a proxy for GIT segments remains questionable.
Several studies have reported site-specific variations in the GIT microbiomes of coyote (8), duck (9), donkey (10), rhesus macaque (11), rat (12, 13), pig (14), and red panda (15). However, the poultry and monogastric species examined to date have distinct GIT structures and functions from ruminants. The GIT microbiome of ruminants is more complex than that of other animals owing to its irreplaceable role in digestion and metabolism of microbial communities in the forestomach (rumen, reticulum, and omasum), in particular, fermentation of dietary matter by rumen microbes (16, 17). Previous investigations on ruminant GIT microbial biogeography have specifically focused on preweaned lambs and bovine calves or samples collected from limited GIT sites (18–22). A high proportion of fiber in forage diets is fermented and degraded in the rumen, while the other dietary nutrients are mainly digested and absorbed at the other GIT sites. Cellulolytic and amylolytic microbes play a critical role in degrading these dietary compounds to produce short-chain fatty acids (SCFAs), which are an indispensable energy source for ruminants (23, 24). Along with GIT microbial biogeography, the SCFA levels at different sites of ruminant GIT reflecting microbial function require further clarification. So far, only two studies on elk (25) and yak (22) have compared the microbial compositions among different GIT segments, whereas neither study addressed microbial metabolites.
The sika deer (Cervus nippon) is a medium-sized ruminant and the wild population has been classified as first-grade state-protected animals in China. Currently, four subspecies of sika deer remain in China (Cervus nippon hortulorum, Cervus nippon taiouanus, Cervus nippon sichuanicus, and Cervus nippon kopschi) (26). Among these, only C. nippon hortulorum is subject to farmed breeding on a large scale, and the population of breeding sika deer now numbers more than 550,000 (27). In the “National Breed List of Livestock and Poultry Genetic Resources” (http://www.moa.gov.cn/govpublic/nybzzj1/202005/t20200529_6345518.htm) announced by the Chinese government in 2020, sika deer were listed as the predominant special economic livestock. The list was updated in 2021 to publicize the important breeds of livestock and poultry, which included a total of one indigenous and seven cultivated breeds of sika deer (http://www.moa.gov.cn/govpublic/nybzzj1/202101/t20210114_6359937.htm). Meanwhile, the management authority for breeding sika deer was transferred from the forestry to agricultural department. The favorable policies and thriving market have led to promotion of the sika deer breeding industry in China to a large-scale intensive farming system. Evaluation of baseline gut microbiota data is necessary to facilitate understanding of the GIT physiology of sika deer with the purpose of optimizing their maintenance and breeding.
Previous microbial studies on sika deer have explored the relationships between gut microbiota and nutrition (28–30), environment (27), colonization (31, 32), and antibiotics (33). While different GIT sites (feces, hindgut, small intestine, and rumen) have been utilized for sampling, no reports in the literature have profiled the microbial biogeography to date. To address this gap in knowledge, we focused on the biogeography of the gut microbiome and SCFA levels in sika deer in the current study.
RESULTS
Comparison of microbiomes in rumen, reticulum, omasum, abomasum, small intestine, cecum, colon, and rectum of sika deer.
(i) Overview of microbial data. A total of 3,941,583 clean reads (ranging from 82,559 to 112,355; mean value = 98,540) were obtained from 40 samples, with a mean read length of 414 bp. The clean reads were clustered into a total of 5,606 operational taxonomic units (OTUs; ranging from 681 to 1,661) at 97% similarity (see Table S1 in the supplemental material). The values of Goods_coverage were all >99% (Table S1), along with the plateaued rarefaction curves of OTU number (Fig. S1), indicative of adequate sequencing depth.
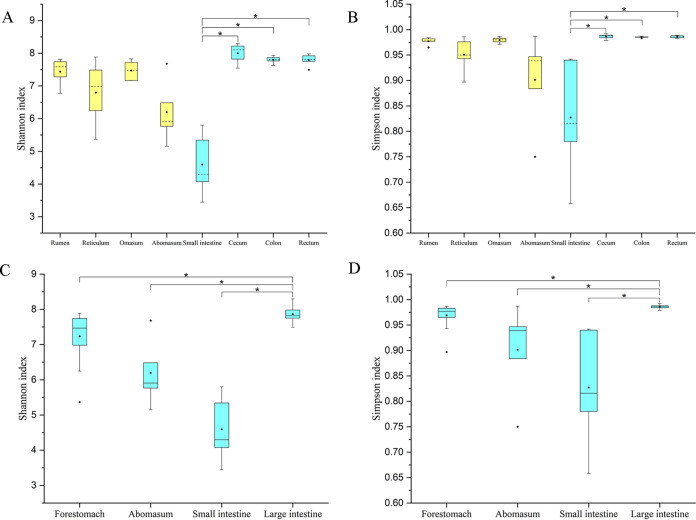
(ii) Comparison of α-diversities. The Shannon and Simpson indices of the microbial community in the small intestine were significantly lower than those in cecum (Shannon, H = 26.14 and P < 0.01; Simpson, H = 24.47 and P < 0.01), colon (Shannon, P = 0.02; Simpson, P = 0.03) and rectum (Shannon, P = 0.02; Simpson, P = 0.01) (Fig. 1A and B). Data from the rumen, reticulum, and omasum were pooled as the forestomach group and those from cecum, colon, and rectum as the large intestine group. The Shannon and Simpson indices in the large intestine were significantly higher than those in the small intestine (Shannon, H = 25.20 and P < 0.01; Simpson, H = 23.53 and P < 0.01), forestomach (Shannon, P = 0.04; Simpson, P = 0.02), and abomasum (Shannon, P < 0.01 [Fig. 1C]; Simpson, P = 0.01 [Fig. 1D]).
FIG 1.
Comparison of Shannon indices (A and C) and Simpson indices (B and D) among the gastrointestinal tract sites in sika deer. Panels A and B exhibit the differences in Shannon and Simpson index among the rumen, reticulum, omasum, abomasum, small intestine, cecum, colon, and rectum. After the data from rumen, reticulum, and omasum were pooled into forestomach and data from the cecum, colon, and rectum were pooled into large intestine, the comparison was performed again; results are shown in panels C and D. *, significant difference.
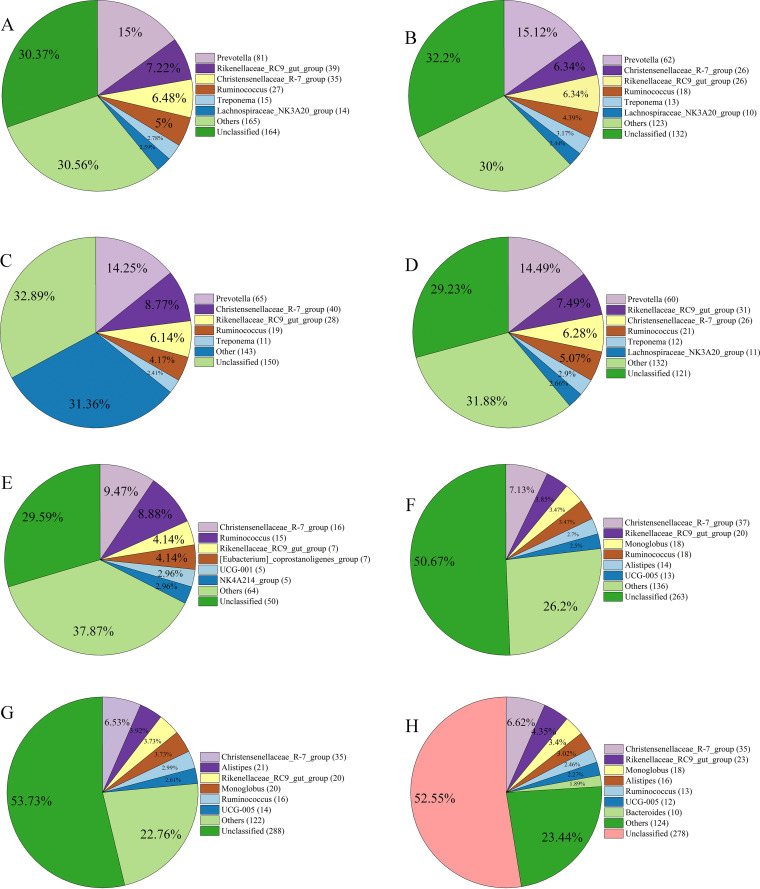
(iii) Core microbes in the eight GIT sites. The shared OTUs among all samples within each group were filtered and annotated to obtain core microbial taxa. The numbers of OTUs shared by all samples from rumen, reticulum, omasum, abomasum, small intestine, cecum, colon, and rectum were 540, 410, 456, 414, 169, 519, 536, and 529, respectively (Fig. S2). The predominant core genus was Prevotella in rumen, reticulum, omasum, and abomasum (Fig. 2A to D), whereas the genus Christensenellaceae_R-7_group dominated the core microbial community in the small intestine, cecum, colon, and rectum (Fig. 2E to H). The other main core genera included Rikenellaceae_RC9_gut_group and Ruminococcus in all eight GIT sites, Treponema in the rumen, reticulum, omasum, and abomasum, Lachnospiraceae_NK3A20_group in the rumen, reticulum, and abomasum, Monoglobus, Alistipes, and UCG-005 in the cecum, colon, and rectum, [Eubacterium]_coprostanoligenes_group, UCG-001, and NK4A214_group in the small intestine, and Bacteroides in the rectum (Fig. 2). At the phylum level, Firmicutes and Bacteroidetes were the most prevalent core microbes in all eight GIT sites. The proportion of Firmicutes in the core microbial community of the four stomach sites ranged from 45.65% to 54.61%, whereas that in the four intestinal sites ranged from 72.02% to 81.07%. Conversely, the proportion of Bacteroidetes in the core microbial community in the four stomach sites ranged from 34.21% to 41.06%, which was markedly higher than that (8.28% to 20.04%) in the four intestine sites (Fig. S3).
FIG 2.
Core microbes at the genus level in the microbial communities of the rumen (A), reticulum (B), omasum (C), abomasum (D), small intestine (E), cecum (F), colon (G), and rectum (H) in sika deer. Numbers following the genus name are the shared OTU numbers, and numbers in the pie charts are the proportion of each genus in total shared OTUs. The genera that occurred at low relative abundance are included in “Others.”
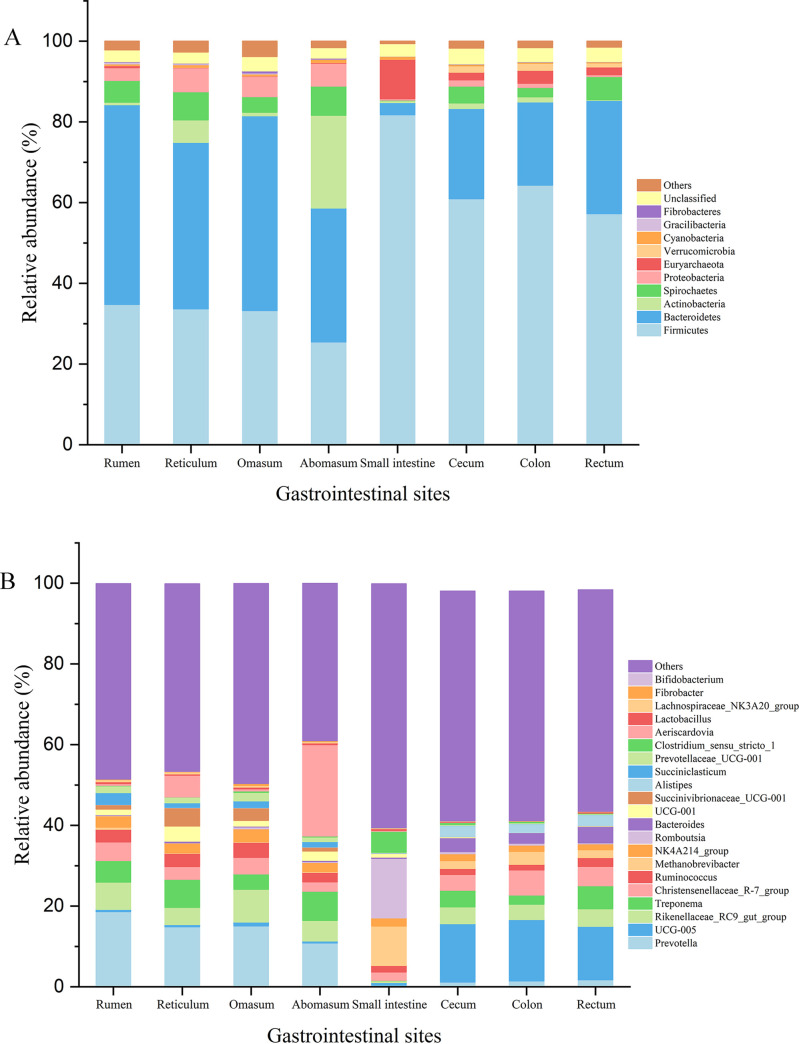
(iv) Comparison of taxonomic compositions at the phylum level. The relative abundance of phyla for each sample is depicted in Fig. S4A. The microbial community was dominated by Firmicutes, Bacteroidetes, and several other phyla (the top 10 phyla are presented in Fig. 3A). Among the top 10 phyla, Firmicutes (F = 22.19 and P < 0.01), Bacteroidetes (F = 38.40 and P < 0.01), Spirochaetes (H = 17.01 and P = 0.02), Proteobacteria (H = 15.27 and P = 0.03), Euryarchaeota (H = 16.89 and P = 0.02), Verrucomicrobia (H = 28.28 and P < 0.01), and Fibrobacteres (H = 15.68 and P = 0.03) displayed progressively significant differences among the eight GIT sites (Table 1), whereas only Firmicutes, Bacteroidetes, Spirochaetes, and Verrucomicrobia were significantly different based on post hoc multiple comparisons after Bonferroni correction. Briefly, the relative abundance of Firmicutes in the four intestinal sites was significantly higher than that in four stomach sites (P < 0.05), that of Bacteroidetes in stomach sites was higher than in intestinal sites (P < 0.05), that of Spirochaetes in the small intestine was lower than that in the rectum (P < 0.01), and that of Verrucomicrobia in the small intestine was lower than that in the cecum (P = 0.04) and colon (P = 0.05).
FIG 3.
Relative abundances of dominant phyla (A) and genera (B) in the microbial communities of the rumen, reticulum, omasum, abomasum, small intestine, cecum, colon, and rectum in sika deer. The taxa that occurred at low relative abundance are included in “Others.”
TABLE 1.
Statistical test of relative abundances of the top 10 phyla in microbial communities among eight gastrointestinal tract sites of sika deer and overall significances of tests
| Phylum | Abundance (mean ± SD) in: percentages |
Significances | |||||||
|---|---|---|---|---|---|---|---|---|---|
| Rumen | Reticulum | Omasum | Abomasum | Small intestine | Cecum | Colon | Rectum | ||
| Firmicutes | 34.78 ± 8.49 | 33.69 ± 16.37 | 33.25 ± 2.83 | 25.47 ± 12.74 | 81.78 ± 8.22 | 60.99 ± 3.74 | 64.34 ± 10.20 | 57.28 ± 3.83 | F = 22.19, P < 0.01a |
| Bacteroidetes | 49.49 ± 6.16 | 41.24 ± 9.29 | 48.29 ± 4.61 | 33.19 ± 5.55 | 3.03 ± 2.74 | 22.36 ± 4.44 | 20.60 ± 6.38 | 28.09 ± 3.51 | F = 38.40, P < 0.01a |
| Actinobacteria | 0.62 ± 0.51 | 5.57 ± 12.00 | 0.87 ± 0.51 | 22.98 ± 20.57 | 0.47 ± 0.23 | 1.35 ± 1.27 | 1.29 ± 1.29 | 0.15 ± 0.21 | H = 11.66, P = 0.11b |
| Spirochaetes | 5.39 ± 8.86 | 6.97 ± 12.43 | 3.85 ± 6.29 | 7.24 ± 10.07 | 0.10 ± 0.15 | 4.18 ± 3.46 | 2.30 ± 2.40 | 5.73 ± 3.58 | H = 17.01, P = 0.02b |
| Proteobacteria | 3.18 ± 3.39 | 5.95 ± 9.99 | 5.01 ± 6.45 | 5.62 ± 6.00 | 0.38 ± 0.43 | 1.54 ± 1.74 | 1.07 ± 0.99 | 0.47 ± 0.21 | H = 15.27, P = 0.03b |
| Euryarchaeota | 0.53 ± 0.71 | 0.10 ± 0.15 | 0.15 ± 0.16 | 0.18 ± 0.18 | 9.77 ± 9.25 | 1.91 ± 2.41 | 3.21 ± 3.58 | 1.93 ± 1.55 | H = 16.89, P = 0.02b |
| Verrucomicrobia | 0.06 ± 0.04 | 0.05 ± 0.04 | 0.07 ± 0.03 | 0.07 ± 0.06 | 0.04 ± 0.02 | 1.58 ± 1.87 | 1.74 ± 1.70 | 0.97 ± 0.74 | H = 28.28, P < 0.01b |
| Cyanobacteria | 0.34 ± 0.25 | 0.61 ± 0.91 | 0.42 ± 0.27 | 0.77 ± 0.79 | 0.69 ± 1.13 | 0.35 ± 0.45 | 0.27 ± 0.19 | 0.26 ± 0.14 | H = 1.72, P = 0.97b |
| Gracilibacteria | 0.41 ± 0.87 | 0.24 ± 0.49 | 0.25 ± 0.52 | 0.07 ± 0.12 | 0.004 ± 0.009 | 0.007 ± 0.010 | 0 | 0.001 ± 0.002 | H = 13.77, P = 0.06b |
| Fibrobacteres | 0.16 ± 0.06 | 0.13 ± 0.14 | 0.51 ± 0.61 | 0.22 ± 0.13 | 0.03 ± 0.03 | 0.07 ± 0.07 | 0.09 ± 0.10 | 0.06 ± 0.08 | H = 15.68, P = 0.03b |
Significance was determined by parametric one-way ANOVA.
Significance was determined by nonparametric Kruskal-Wallis test.
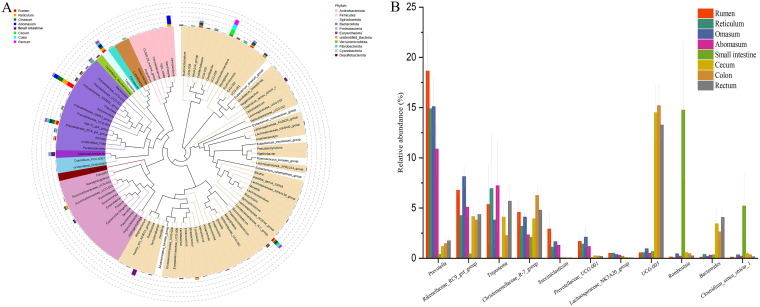
(v) Comparison of taxonomic compositions at the genus level. The relative abundance of genera for each sample is depicted in Fig. S4B. Eleven of the main genera (Fig. 3B and Fig. 4A), including Prevotella (H = 31.35 and P < 0.01), UCG-005 (H = 28.89 and P < 0.01), Rikenellaceae_RC9_gut_group (F = 7.81 and P < 0.01), Treponema (H = 16.22 and P = 0.02), Christensenellaceae_R-7_group (F = 2.56 and P = 0.03), Romboutsia (H = 23.83 and P < 0.01), Bacteroides (H = 28.75 and P < 0.01), Succiniclasticum (H = 32.32 and P < 0.01), Prevotellaceae_UCG-001 (H = 29.11 and P < 0.01), Clostridium_sensu_stricto_1 (H = 17.87 and P = 0.01), and Lachnospiraceae_NK3A20_group (H = 30.63 and P < 0.01), showed significant differences among the eight GIT sites. Briefly, the relative abundance of Prevotella, Rikenellaceae_RC9_gut_group, Treponema, Christensenellaceae_R-7_group, Succiniclasticum, Prevotellaceae_UCG-001, and Lachnospiraceae_NK3A20_group in stomach sites was higher than in intestinal sites (P < 0.05 [Fig. 4B]). Conversely, the relative abundance of UCG-005, Romboutsia, Bacteroides, and Clostridium_sensu_stricto_1 in stomach sites was lower than that in intestinal sites (P < 0.05 [Fig. 4B]). In particular, Prevotella, Rikenellaceae_RC9_gut_group, Treponema, Christensenellaceae_R-7_group, Romboutsia, Prevotellaceae_UCG-001, and Clostridium_sensu_stricto_1 in the small intestine showed remarkably higher or lower abundance than in other seven sites (Fig. 4B).
FIG 4.
Comparison of dominant genera among the rumen, reticulum, omasum, abomasum, small intestine, cecum, colon, and rectum in sika deer. (A) Phylogenetic tree of the top 100 genera and comparison of the relative abundances of these genera. The colors of the genera indicate the phyla to which they belong. (B) Histogram of the main genera which showed significant differences among eight gastrointestinal sites.
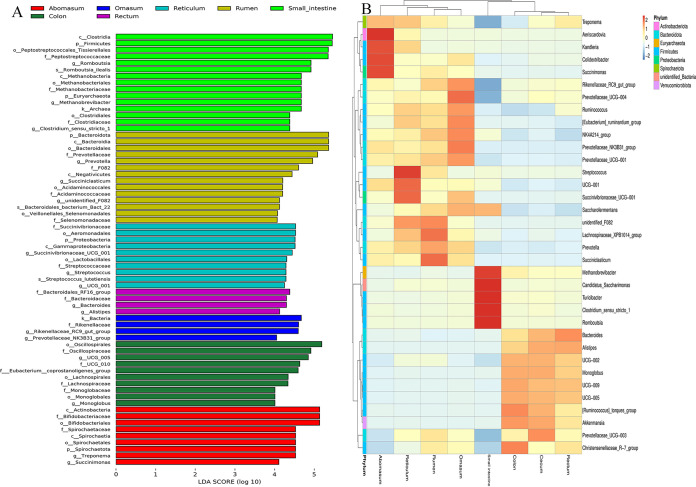
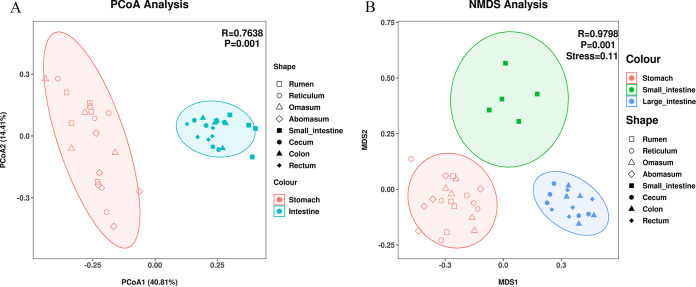
(vi) Comparison of β-diversities. The within-group Bray-Curtis similarity of the microbial community ranged from 0.59 ± 0.07 to 0.76 ± 0.04, which was significantly higher (H = 87.99 and P < 0.01) than intergroup similarity (0.53 ± 0.12 [Fig. S5]). Based on the linear discriminant analysis (LDA) effect size (LEfSe) analysis, a total of 66 microbial taxa (including 2 kingdoms, 5 phyla, 7 classes, 13 orders, 19 families, 17 genera, and 3 species) displayed significant differences among the eight GIT sites, which encompassed the majority of discrepant phyla and genera identified with analysis of variance (ANOVA) and the Kruskal-Wallis test (Fig. 5A). Clear differences in taxonomic distribution among the eight GIT sites were observed according to the heat map based on abundance of dominant genera (Fig. 5B). Additionally, heat map clustering revealed that the eight sampling groups could be categorized into two clusters, in line with the four stomach and four intestinal sites (Fig. 5B). Principal-coordinate analysis (PCoA) based on weighted UniFrac distance showed distinct distribution patterns between the four stomach and four intestine sites (Nonparametric multivariate analysis of variance, ADONIS, R = 0.76 and P < 0.01 [Fig. 6A]). Nonmetric multidimensional scaling (NMDS) based on Bray-Curtis similarities revealed that the four stomach sites could be grouped into one cluster, whereas the small intestine showed significantly different distribution patterns from the other three intestinal sites (analysis of similarity [ANOSIM], R = 0.98 and P < 0.01 [Fig. 6B]).
FIG 5.
(A) Linear discriminant analysis (LDA) effect size (LEfSe) analysis at the LDA threshold of 4, indicating the differently abundant taxa among the rumen, reticulum, omasum, abomasum, small intestine, cecum, colon, and rectum of sika deer. (B) Heat map analysis based on the relative abundance of genera. Different colors in the heat map represent different relative abundances; the color trend to red means higher abundance.
FIG 6.
Principal-coordinate analysis (PCoA) based on the weighted UniFrac distance (A) and the nonmetric multidimensional scaling (NMDS) based on the Bray-Curtis similarities (B). The rumen, reticulum, omasum, abomasum, small intestine, cecum, colon, and rectum of sika deer are indicated by different shapes, and different colors are used to distinguish the merged data.
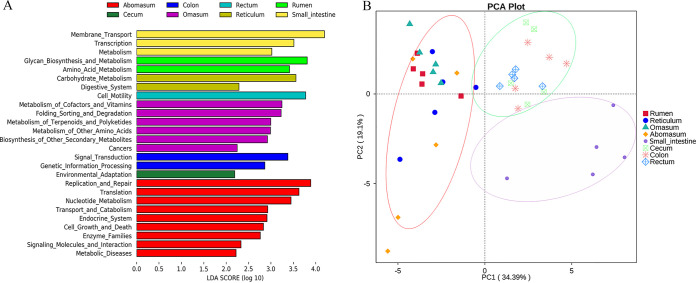
(vii) Comparison of predicted functions. The main Kyoto Encyclopedia of Genes and Genomes (KEGG) level 1 functions were metabolism, genetic information processing, and environmental information processing (Fig. S6). Membrane transport, carbohydrate metabolism, amino acid metabolism, and replication and repair were the predominant level 2 functions (Fig. S6). In principal-component analysis (PCA) based on the abundance of level 2 functions, samples could be clustered into three groups according to GIT position (stomach, small intestine, and large intestine) (Fig. 7B). LDA at a threshold of 2 detected 26 level 2 functions showing significant differences among the eight GIT sites (Fig. 7A).
FIG 7.
(A) LEfSe analysis at the LDA threshold of 2, which indicating the different abundances of level 2 KEGG functions among the rumen, reticulum, omasum, abomasum, small intestine, cecum, colon, and rectum of sika deer. (B) PCA based on the weighted UniFrac distance of KEGG functions. The rumen, reticulum, omasum, abomasum, small intestine, cecum, colon, and rectum are indicated by different shapes, and cycles with different colors are used to distinguish the merged data.
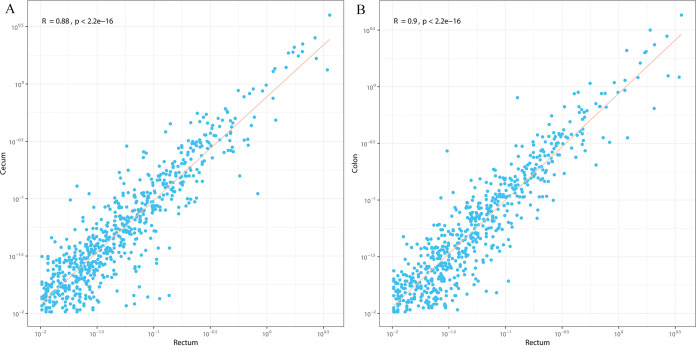
(viii) Reflection of other GIT sites by rectal microbiota. Rectal samples were used as the proxy for fecal microbiota. Spearman correlation analysis of the microbial composition of rectum compared to the other seven GIT sites was performed based on the relative abundance of OTUs and the extent of similarity of the microbial community from each site with that of the rectum evaluated. Among the four intestinal sites, the microbial composition of the rectum was significantly correlated with those of the cecum (R = 0.88 and P < 0.01 [Fig. 8A]) and colon (R = 0.88 and P < 0.01 [Fig. 8B]) but not that of the small intestine (R = −0.01 and P = 0.90 [Fig. S7E]). The bacterial compositions of all four stomach sites showed highly negative correlations with rectal microbiota (R = −0.21 to 0.32 and P < 0.01 [Fig. S7A to D]).
FIG 8.
Correlation analysis of microbial community between the rectum and cecum (A) and colon (B) based on the relative abundance of OTUs in sika deer. Each point in the plots represents one OTU, and numbers on the x axis and y axis indicate the relative abundance of OTUs (percent).
Comparison of SCFAs in the rumen, small intestine, and cecum of sika deer.
(i) Quantitative analysis of SCFAs. The rumen, small intestine, and cecum were selected as representative GIT sites for determination of SCFA concentrations. The concentrations of acetic, propionic, isobutyric, butyric, and valeric acids in the small intestine were significantly lower than those in rumen and cecum (P < 0.05 [Table 2]). Moreover, the isovaleric and caproic acid levels in small intestine were markedly lower than those in cecum (P = 0.02) and rumen (P < 0.01), whereas no significant differences were observed for all seven types of SCFAs between rumen and cecum (P > 0.05 [Table 2]).
TABLE 2.
Statistical test of concentrations of seven types of SCFAs among the rumen, small intestine, and cecum of sika deer
| SCFA | Concn, μg/g (mean ± SD) |
Significancesa | ||
|---|---|---|---|---|
| Rumen | Small intestine | Cecum | ||
| Acetic acid | 1253.33 ± 230.57 | 193.71 ± 213.40 | 1463.70 ± 183.07 | H = 10.50, PR-IT = 0.03, PR-C = 0.29, PIT-C < 0.01b |
| Propionic acid | 672.33 ± 332.86 | 11.33 ± 14.85 | 503.86 ± 79.63 | F = 15.08, PR-IT < 0.01, PR-C = 0.20, PIT-C < 0.01c |
| Isobutyric acid | 29.11 ± 12.52 | 5.10 ± 10.98 | 42.58 ± 14.76 | F = 10.92, PR-IT = 0.01, PR-C = 0.12, PIT-C < 0.01c |
| Butyric acid | 288.65 ± 149.31 | 8.57 ± 15.91 | 203.99 ± 46.95 | F = 12.50, PR-IT < 0.01, PR-C = 0.17, PIT-C < 0.01c |
| Isovaleric acid | 23.09 ± 14.21 | 6.01 ± 13.15 | 31.41 ± 16.25 | F = 3.93, PR-IT = 0.09, PR-C = 0.34, PIT-C = 0.02c |
| Valeric acid | 59.98 ± 25.44 | 0.21 ± 0.06 | 81.55 ± 25.90 | F = 20.21, PR-IT < 0.01, PR-C = 0.13, PIT-C < 0.01c |
| Caproic acid | 13.81 ± 10.20 | 0.34 ± 0.08 | 3.10 ± 4.01 | H = 11.58, PR-IT < 0.01, PR-C = 0.14, PIT-C = 0.06b |
R, rumen; IT, small intestine; C, cecum.
Significance was determined by nonparametric Kruskal-Wallis test.
Significance was determined by parametric one-way ANOVA.
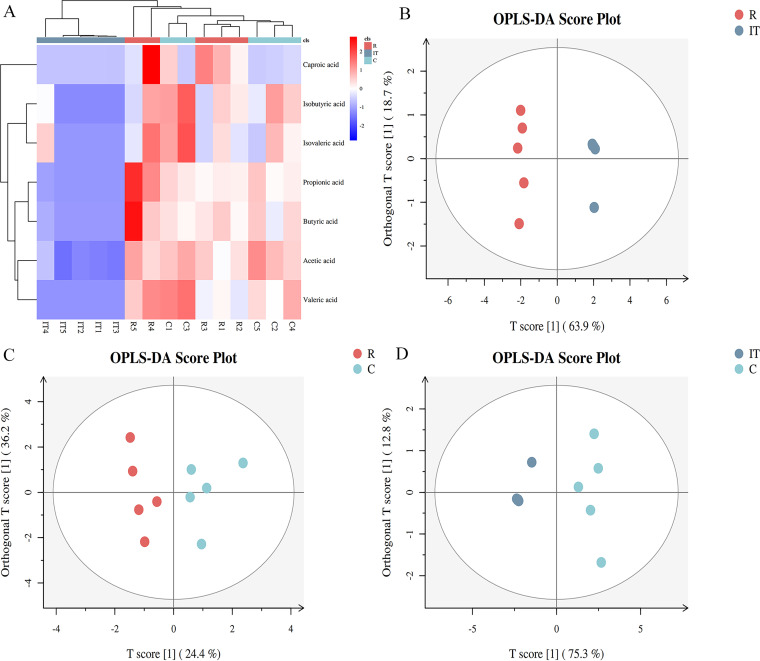
(ii) Aggregate comparison of SCFAs. Heat map clustering based on the concentrations of SCFAs showed that the five samples from the small intestine could be clustered into one group, whereas ruminal and cecal samples could not be clearly clustered (Fig. 9A). Consistently, orthogonal projections to latent structures discriminant analysis (OPLS-DA) revealed that the differences between the small intestine and rumen (T score = 63.90% [Fig. 9B]) and small intestine and cecum (T score = 75.30% [Fig. 9D]) were markedly higher than those between the rumen and cecum (T score = 24.40% [Fig. 9C]).
FIG 9.
Heat map analysis (A) and orthogonal projections to latent structures discriminant analysis (OPLS-DA) (B to D) based on the concentrations of seven types of SCFAs in the rumen, small intestine, and cecum of sika deer. Each point in the OPLS-DA plots represents one sample. “R” refers to the samples from the rumen, “C” refers to the samples from the cecum, and “IT” refers to the samples from the small intestine. T scores on the x axis are for the dissimilarity between two groups, and T scores on the y axis are for the dissimilarity within each group.
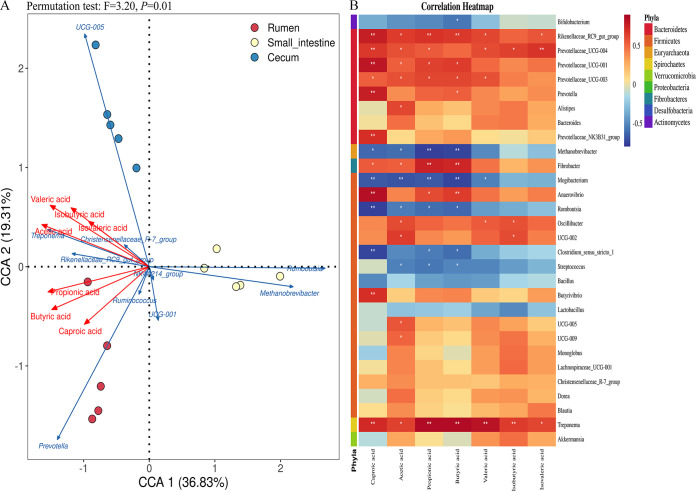
Correlations between SCFAs and microbial genera. In the permutation test, a canonical correlation analysis (CCA) plot was generated based on correlations of dominant genera, samples, and SCFA concentrations with statistical significance (F = 3.20 and P = 0.01 [Fig. 10A]). The CCA plot showed that valeric, acetic, isobutyric, and isovaleric acids were strongly associated with the dominant genera UCG-005, Treponema, and Rikenellaceae_RC9_gut_group in cecal samples and propionic, butyric, and caproic acids with Prevotella in ruminal samples (Fig. 10A). The correlation heat map plot verified the results of CCA. Overall, 16 among the top 30 genera displayed significant positive correlations with SCFAs (Fig. 10B). All the genera belonging to Bacteroidetes showed positive correlations with SCFAs, and the genus Treponema, belonging to Spirochaetes, showed a strong positive correlation with all seven SCFA types (Fig. 10).
FIG 10.
(A) Canonical correlation analysis (CCA) of relationships between seven types of SCFAs and dominant genera in sika deer. Points with three different colors represents samples from the rumen, small intestine and cecum. Blue lines represent genera, and red lines represent SCFAs. The smaller the angle between lines, or the longer the lines toward the points, the stronger the positive correlation. (B) Correlation heat map analysis of relationships between seven types of SCFAs and the top 30 genera in sika deer. Trending red color means a positive correlation, and trending blue color means a negative correlation. *; significant correlation; **, extremely significant correlation.
DISCUSSION
In this study, we comprehensively investigated the microbial communities of eight different GIT biogeographic sites (rumen, reticulum, omasum, abomasum, small intestine, cecum, colon, and rectum) and the main microbial metabolites (SCFAs) at three representative GIT sites (rumen, small intestine, and cecum) in sika deer. Our results demonstrated the following. (i) Despite remarkable differences in α- and β-diversity, core microbes, taxonomic composition, and functional predictions of microbiomes among the eight GIT locations, the sites could be clustered into stomach, small intestine, and large intestine segments. (ii) The rectal microbiome was accurately reflected by the microbial compositions of the cecum and colon but obviously differed from those of the small intestine and four stomach sites, indicating that results obtained using feces as the sample source do not necessarily represent the overall GIT microbiota. (iii) The SCFA levels in the rumen, small intestine and cecum were significantly different, with Bacteroidetes and Spirochaetes playing a critical role in SCFA production.
Specific microbial niche of the small intestine. Comparison of Shannon and Simpson indices revealed that small intestine was colonized by the least diverse microbiota, while the microbial community in the large intestine (pooled from the cecum, colon and rectum) showed the highest diversity (Fig. 1). Our results were similar to previous findings for preweaned lambs, goats, and bovine species (18–21) but distinct from results obtained with monogastric animals (8, 10, 12, 14, 15) and poultry (9, 34). Furthermore, heat map clustering (Fig. 5B), NMDS analysis of microbial composition (Fig. 6B), PCA of predicted function (Fig. 7B), and compositional analysis (Table 1) revealed obvious differences between small intestine and large intestinal and stomach sites. The unique microbial community in the small intestine could be explained by its specific physiology and function (35, 36). The observed difference between small intestine and four stomach sites is comprehensible, since the main function of stomach is decomposition of diet rather than absorption of nutrients (37). The small intestine is the core region of absorption of the majority of dietary nutrients (starches, monosaccharides, proteins, and lipids), and its physiology is specifically adapted to serve this function, including lower pH, shorter transit time, higher cell turnover rate, and a more aerobic environment, which may be harsh conditions for microbial survival, thus limiting the diversity and abundance of the bacterial community (5, 13, 38, 39). Within the less harsh conditions of the large intestine, the host primarily absorbs water, vitamins, and electrolytes (35) whereby the microbiota break down the diverse suite of undigested starch, unabsorbed sugars, and polysaccharides passed from the small intestine (40).
Prevotella organisms dominate the gastric core microbiota, and Christensenellaceae_R-7_group is prevalent in the intestine. According to core microbe analysis, the four stomach sites shared similar core microbes, predominantly Prevotella, whereas Christensenellaceae_R-7_group was the most abundant core microbe in the four intestine sites (Fig. 2). The genus Prevotella is positively associated with a high-fiber diet (41, 42) and plays key roles in fermenting complex polysaccharides (43), improving glucose metabolism (43), and promoting fat accumulation (44). In ruminants such as sika deer, a high-fiber diet is essential to maintain rumen fermentation and the other three stomach sites are the locations of degradation of dietary simple carbohydrates, protein, and fat. We additionally observed a higher abundance of Prevotella within rumen core microbes (Fig. 2A to D) and stomach sites (Fig. 4). Christensenellaceae_R-7_group is a common genus of the Christensenellaceae family prevalent in the GITs of animals (15, 22, 45) and humans (46, 47). The family Christensenellaceae has been consistently shown to be negatively related to fat accumulation and weight gain (48, 49) and ferments nutrients to produce α-arabinosidase, β-galactosidase, and β-glucosidase (50). The main function of the intestine is to absorb nutrients, and its microbiota are essential to degrade small-molecule nutrients transported from the stomach. Consistently, a higher abundance of Christensenellaceae_R-7_group was observed in intestinal sites (Fig. 4). Furthermore, the absence of certain dominant genera in the core microbial community (Fig. 2) was consistent with the low relative abundance of the same genera (Fig. 3B), indicating that core microbe analysis presents a usefully complementary method for comparing the relative abundance of genera.
Differences in abundance of Firmicutes and Bacteroidetes between stomach and intestine sites according to microbial function. In line with data from other ruminants, Firmicutes and Bacteroidetes are overwhelmingly prevalent in the GIT of sika deer (51, 52). In the present study, the abundance of Firmicutes in intestinal sites was significantly higher than that in gastric sites, whereas the levels of Bacteroidetes were diametrically opposite to those of Firmicutes (Fig. 4A and Table 1). Previous studies on sika deer have revealed Firmicutes and Bacteroidetes as the principal microbiota in the cecum and colon (32), small intestine (31), rumen (30), and feces (27, 33). However, the abundance of Firmicutes and Bacteroidetes alters dynamically with the environment, diet, antibiotic treatment, and growth period, and the Firmicutes/Bacteroidetes ratio (F/B ratio) is an important index reflecting microbial function (53, 54). Similar results have been obtained from several other studies on ruminants (10, 21, 22), indicating that the stomach and intestinal segments are colonized by totally different microbes in sika deer owing to adaptation to distinct functions (digestion of food or absorption of nutrients by the host) and the predicted microbial function in stomach is mainly higher metabolism (Fig. 7A). Furthermore, high quantities of Proteobacteria and Fibrobacteres were observed in the stomach, and the intestine was primarily colonized by Euryarchaeota and Verrucomicrobia (Table 1), indicating specific functional trends of members of these phyla in digestion of food or absorption of nutrients. Actinobacteria were significantly more abundant in the abomasum (Table 1), and the higher microbial functions mainly involved cellular processes, genetic information processing, metabolism, and organismal systems (Fig. 7A). Like the only stomach in nonruminants, the abomasum in ruminants plays multiple roles in host physiological processes (55).
The rectal microbial community accurately reflects the large intestine but not small intestine and stomach. The feces of sika deer are granular, identical to the rectal contents, which were utilized to reflect fecal microbiota. Quantification of the degree to which rectal samples reflect luminal microbiota revealed that the rectal microbiome is highly correlated with those of cecum and colon, whereas the four stomach and small intestine sites were colonized by remarkably different microbiomes (Fig. 8). A previous study on rhesus macaques also reported significant association between fecal and colonic microbiota, supporting the utility of feces as a sampling source in human clinical studies (11). The variations between rectum and stomach are clearly understood in view of their radically distinct morphology, physiology, and ecology, and the differences between small and large bowel could be potentially explained by differential pH, bile acid, nutrition substrate, and/or oxygen contents (56, 57). While fecal sampling has unparalleled convenience and availability, accumulating data have highlighted the importance of longitudinal profiling of the GIT microbiome, as certain diseases or physiologies may be restricted to specific GIT locations (58, 59). In ruminants, rumen samples are always employed to investigate microbial fermentation of dietary fiber in the stomach (60), which is partly supported by our results. However, our present findings do not support the utility of feces as a representative of the whole intestinal microbiota, suggesting that sampling sites should be selected carefully according to the specific target.
Different SCFA types are produced in distinct GIT sites by specific microbes. The most important SCFAs in ruminants are acetic, propionic, and butyric acids (61), which follow separate metabolic pathways (Fig. S8). Our results disclosed significant levels of these three acids (Table 2). Among rumen, small intestine, and cecum sites, SCFAs were mainly produced in rumen and cecum (Table 2 and Fig. 9 and 10A), which could be attributable to the different microbial compositions (Fig. 10). Generally, SCFAs mainly exist in the forestomach of ruminants as microbial end products (62, 63), and high levels are found in the large intestine of monogastric herbivores (64). In our study, the small intestine harbored the lowest diversity of microbiota. Thus, the lack of SCFA-producing microbes, such as UCG-005, Treponema, Rikenellaceae_RC9_gut_group, and Prevotella, could be the reason underlying lower SCFA levels. The families Lachnospiraceae (Butyrivibrio and Dorea) and Ruminococcaceae (UCG-002, UCG-005, and UCG-009) of phylum Firmicutes, which are abundant in the large intestine, include major butyrate-producing bacteria or species that convert lactate to caproic acid or propionate (65). Anaerovibrio is typical lipid decomposer producing propionic and succinic acids (66), and members of the genus Fibrobacter can generate acetic and succinic acids via fermentation of fiber and cellobiose in the rumen (67). Oscillibacter is a genus colonized in the GIT of herbivores reported to produce valeric acid (68). The families Rikenellaceae (such as Alistipes and Rikenellaceae_RC9_gut_group) and Prevotellaceae (such as Prevotella, Prevotellaceae_001, Prevotellaceae_003, Prevotellaceae_004, and Prevotellaceae_NK3B31_group), both belonging to Bacteroidetes phylum, are reported to serve as lipid and glucose modulators through production of SCFAs (43, 47). The genus Treponema (including many pathogenic species) is significantly related to all seven SCFAs. Notably, a previous study reported a significant association of Treponema with leanness in pigs (44).
In conclusion, different GIT sections are colonized by distinct microbial communities that perform various functions in nutrition and immunity of sika deer, as validated by shifts in the associated main microbial metabolites (SCFAs). Importantly, the fecal microbiota community served as a good proxy for the large intestinal microbiome, which was vital for sampling. Sika deer breeding is a fast-developing livestock industry in China, and comprehensive analysis of the GIT microbiome should therefore provide valuable information for clarifying the nutritional and digestive physiology of this species.
MATERIALS AND METHODS
Ethics statement.
The experimental protocol was reviewed and approved by our Institutional Ethics Committee (Institutional Animal Care and Use Committee of Jiangxi Agricultural University), and the protocol was registered under the number JXAULL-2020031.
Animals and sample collection.
Selected sika deer were part of a breeding program in a farm located in Ji’an city, Xiajiang county, Jiangxi province, China (27°29′N, 115°4′E), containing around 400 individuals. The farm has a captive dry lot and free-range enclosure on a small hill with an area of about 1 km2. Five selected sika deer were farmed in the captive dry lot area. The deer were fed leaves, grass, and supplementary concentrated feeds. Sampled animals were healthy (details provided in Table S2). The selected animals were fasted for 12 h before sampling.
After deer were euthanized, the GIT was immediately removed from the body. The luminal contents of the rumen, reticulum, omasum, and abomasum were collected using sterile forceps, and intestinal samples were obtained by extruding the contents into the sterile tube. Due to fasting prior to euthanasia, the luminal contents of the small intestine (including the duodenum, jejunum, and ileum) were fluid, with very small quantities, which made content sampling difficult. The luminal contents of the three small intestine segments were ultimately pooled. Sample identifiers (IDs) are presented in Table S2.
DNA isolation, PCR, and sequencing.
The QIAamp fast DNA stool minikit (Qiagen, Hilden, Germany) was used to extract environmental DNA (eDNA) from crushed GIT contents in liquid nitrogen according to official protocols. After examination of purity and concentration, DNA was diluted to 1 ng/μL, which was used as the template for PCR with primers 515F and 806R encompassing the 16S V4 region. High-throughput sequencing was performed in a NovaSeq 6000 platform.
Targeted metabolome determination of SCFAs.
The luminal contents (100 mg) of the rumen, small intestine, and cecum were transferred into 1.5-mL centrifuge tubes, followed by the addition of 50 μL of phosphoric acid (15%), 100 mg of glass microbeads, 100 μL of isocaproic acid at a concentration of 125 μg/mL (internal standard), and 400 μL of diethyl ether. After the mixtures were ground twice and centrifuged at 12,000 × g for 10 min, 0.5-mL supernatant samples were used to measure concentrations of the seven SCFAs via gas chromatography-mass spectrometry (GC-MS; Thermo, Waltham, MA).
Bioinformatic and statistical analyses.
QIIME V1.9.1 software (69) was applied for analysis of 16S rRNA gene sequencing data. After the low-quality reads were filtered and the chimeras removed, clean data were obtained. Next, sequences were classified into the same operational taxonomic units (OTUs) at a threshold of 97% identity using Uparse v7.0.1001 (70). OTUs were subsequently annotated into microbial taxa using the Mothur method corresponding to the SILVA 138 database (71). The α-diversity indices were calculated using QIIME. Venn plots were generated to evaluate shared OTUs using R v2.15.3. PCoA coupled with ADONIS and NMDS coupled with ANOSIM were performed and displayed via R to determine differences in microbiota among distinct GIT sites. Venn plots were used to calculate shared OTUs using R. LEfSe analysis was performed using the online program (72). The similarities between rectal and the other seven GIT sites were examined using R. Based on the concentrations of seven SCFAs, heat map and OPLS-DA score plots were obtained with R. The correlations between SCFAs and dominant microbial genera and among SCFAs, dominant genera, and sampling sites were displayed in R.
The normality of Shannon and Simpson indices, relative abundance of dominant phyla and genera, and SCFA concentrations were tested using the Kolmogorov-Smirnov test. Subsequently, one-way ANOVA (normalized data) or Kruskal-Wallis test (discrete data) was utilized to compare the differences among GIT sites. Statistical analysis was performed using SPSS 23 (IBM, Chicago, IL).
Data availability.
These 16S rRNA nucleotide sequencing data have been submitted to the SRA databases in GenBank with accession number PRJNA732137.
ACKNOWLEDGMENTS
X.H., Y.W., and Y.Z. designed the study. X.H., Y.W., X.W., and Y.X. performed the experiments. X.H., T.Z., and W.Z. analyzed the data. X.H. wrote the final manuscript.
This study was supported by the National Natural Science Foundation (32160257) and Natural Science Foundation of Jiangxi Province (20202BABL213048). The funders had no role in study design, data collection and interpretation, or the decision to submit the work for publication.
Footnotes
Supplemental material is available online only.
Contributor Information
Xiaolong Hu, Email: huxiaolong@jxau.edu.cn.
Yunlin Zheng, Email: zhengyl8011@163.com.
Martha Vives, Unversidad de los Andes.
REFERENCES
- 1.Ermund A, Schütte A, Johansson MEV, Gustafsson JK, Hansson GC. 2013. Studies of mucus in mouse stomach, small intestine, and colon. I. Gastrointestinal mucus layers have different properties depending on location as well as over the Peyer’s patches. Am J Physiol Gastrointest Liver Physiol 305:G341–G347. 10.1152/ajpgi.00046.2013. [DOI] [PMC free article] [PubMed] [Google Scholar]
- 2.Wheeler WE, Noller CH. 1977. Gastrointestinal tract pH and starch in feces of ruminants. J Anim Sci 44:131–135. 10.2527/jas1977.441131x. [DOI] [PubMed] [Google Scholar]
- 3.Levin D, Raab N, Pinto Y, Rothschild D, Zanir G, Godneva A, Mellul N, Futorian D, Gal D, Leviatan S, Zeevi D, Bachelet I, Segal E. 2021. Diversity and functional landscapes in the microbiota of animals in the wild. Science 372:b5352. 10.1126/science.abb5352. [DOI] [PubMed] [Google Scholar]
- 4.Sandberg R, Neilson JR, Sarma A, Sharp PA, Burge CB. 2008. Proliferating cells express mRNAs with shortened 3′ untranslated regions and fewer microRNA target sites. Science 320:1643–1647. 10.1126/science.1155390. [DOI] [PMC free article] [PubMed] [Google Scholar]
- 5.Donaldson GP, Lee SM, Mazmanian SK. 2016. Gut biogeography of the bacterial microbiota. Nat Rev Microbiol 14:20–32. 10.1038/nrmicro3552. [DOI] [PMC free article] [PubMed] [Google Scholar]
- 6.Koropatkin NM, Cameron EA, Martens EC. 2012. How glycan metabolism shapes the human gut microbiota. Nat Rev Microbiol 10:323–335. 10.1038/nrmicro2746. [DOI] [PMC free article] [PubMed] [Google Scholar]
- 7.Barelli C, Albanese D, Stumpf RM, Asangba A, Donati C, Rovero F, Hauffe HC, Sharpton TJ. 2020. The gut microbiota communities of wild arboreal and ground-feeding tropical primates are affected differently by habitat disturbance. mSystems 5:e00061-20. 10.1128/mSystems.00061-20. [DOI] [PMC free article] [PubMed] [Google Scholar]
- 8.Sugden S, St Clair CC, Stein LY. 2021. Individual and site-specific variation in a biogeographical profile of the coyote gastrointestinal microbiota. Microb Ecol 81:240–252. 10.1007/s00248-020-01547-0. [DOI] [PubMed] [Google Scholar]
- 9.Yang H, Lyu W, Lu L, Shi X, Li N, Wang W, Xiao Y. 2020. Biogeography of microbiome and short-chain fatty acids in the gastrointestinal tract of duck. Poult Sci 99:4016–4027. 10.1016/j.psj.2020.03.040. [DOI] [PMC free article] [PubMed] [Google Scholar]
- 10.Zhang R, Zhang J, Dang W, Irwin DM, Wang Z, Zhang S. 2020. Unveiling the biogeography and potential functions of the intestinal digesta- and mucosa-associated microbiome of donkeys. Front Microbiol 11:596882. 10.3389/fmicb.2020.596882. [DOI] [PMC free article] [PubMed] [Google Scholar]
- 11.Yasuda K, Oh K, Ren B, Tickle TL, Franzosa EA, Wachtman LM, Miller AD, Westmoreland SV, Mansfield KG, Vallender EJ, Miller GM, Rowlett JK, Gevers D, Huttenhower C, Morgan XC. 2015. Biogeography of the intestinal mucosal and lumenal microbiome in the rhesus macaque. Cell Host Microbe 17:385–391. 10.1016/j.chom.2015.01.015. [DOI] [PMC free article] [PubMed] [Google Scholar]
- 12.Li D, Chen H, Mao B, Yang Q, Zhao J, Gu Z, Zhang H, Chen YQ, Chen W. 2017. Microbial biogeography and core microbiota of the rat digestive tract. Sci Rep 8:45840. 10.1038/srep45840. [DOI] [PMC free article] [PubMed] [Google Scholar]
- 13.Sheth RU, Li M, Jiang W, Sims PA, Leong KW, Wang HH. 2019. Spatial metagenomic characterization of microbial biogeography in the gut. Nat Biotechnol 37:877–883. 10.1038/s41587-019-0183-2. [DOI] [PMC free article] [PubMed] [Google Scholar]
- 14.Xiao Y, Kong F, Xiang Y, Zhou W, Wang J, Yang H, Zhang G, Zhao J. 2018. Comparative biogeography of the gut microbiome between Jinhua and Landrace pigs. Sci Rep 8:5985. 10.1038/s41598-018-24289-z. [DOI] [PMC free article] [PubMed] [Google Scholar]
- 15.Zeng Y, Zeng D, Zhou Y, Niu L, Deng J, Li Y, Pu Y, Lin Y, Xu S, Liu Q, Xiong L, Zhou M, Pan K, Jing B, Ni X. 2018. Microbial biogeography along the gastrointestinal tract of a red panda. Front Microbiol 9:1411. 10.3389/fmicb.2018.01411. [DOI] [PMC free article] [PubMed] [Google Scholar]
- 16.O’ Donnell MM, Harris HMB, Ross RP, O’Toole PW. 2017. Core fecal microbiota of domesticated herbivorous ruminant, hindgut fermenters, and monogastric animals. Microbiologyopen 6:e509. 10.1002/mbo3.509. [DOI] [PMC free article] [PubMed] [Google Scholar]
- 17.Liu K, Zhang Y, Yu Z, Xu Q, Zheng N, Zhao S, Huang G, Wang J. 2021. Ruminal microbiota-host interaction and its effect on nutrient metabolism. Anim Nutr 7:49–55. 10.1016/j.aninu.2020.12.001. [DOI] [PMC free article] [PubMed] [Google Scholar]
- 18.Palomba A, Tanca A, Fraumene C, Abbondio M, Fancello F, Atzori A, Uzzau S. 2017. Multi-omic biogeography of the gastrointestinal microbiota of a pre-weaned lamb. Proteomes 5:36. 10.3390/proteomes5040036. [DOI] [PMC free article] [PubMed] [Google Scholar]
- 19.Yeoman CJ, Ishaq SL, Bichi E, Olivo SK, Lowe J, Aldridge BM. 2018. Biogeographical differences in the influence of maternal microbial sources on the early successional development of the bovine neonatal gastrointestinal tract. Sci Rep 8:3197. 10.1038/s41598-018-21440-8. [DOI] [PMC free article] [PubMed] [Google Scholar]
- 20.Zhuang Y, Chai J, Cui K, Bi Y, Diao Q, Huang W, Usdrowski H, Zhang N. 2020. Longitudinal investigation of the gut microbiota in goat kids from birth to postweaning. Microorganisms 8:1111. 10.3390/microorganisms8081111. [DOI] [PMC free article] [PubMed] [Google Scholar]
- 21.Chong CYL, Vatanen T, Oliver M, Bloomfield FH, O’Sullivan JM. 2020. The microbial biogeography of the gastrointestinal tract of preterm and term lambs. Sci Rep 10:9113. 10.1038/s41598-020-66056-z. [DOI] [PMC free article] [PubMed] [Google Scholar]
- 22.Ma J, Zhu Y, Wang Z, Yu X, Hu R, Wang X, Cao G, Zou H, Shah AM, Peng Q, Xue B, Wang L, Zhao S, Kong X. 2020. Comparing the bacterial community in the gastrointestinal tracts between growth-retarded and normal yaks on the Qinghai–Tibetan plateau. Front Microbiol 11:600516. 10.3389/fmicb.2020.600516. [DOI] [PMC free article] [PubMed] [Google Scholar]
- 23.Shen H, Lu Z, Xu Z, Chen Z, Shen Z. 2017. Associations among dietary non-fiber carbohydrate, ruminal microbiota and epithelium G-protein-coupled receptor, and histone deacetylase regulations in goats. Microbiome 5:123. 10.1186/s40168-017-0341-z. [DOI] [PMC free article] [PubMed] [Google Scholar]
- 24.Shabat SK, Sasson G, Doron-Faigenboim A, Durman T, Yaacoby S, Berg MM, White BA, Shterzer N, Mizrahi I. 2016. Specific microbiome-dependent mechanisms underlie the energy harvest efficiency of ruminants. ISME J 10:2958–2972. 10.1038/ismej.2016.62. [DOI] [PMC free article] [PubMed] [Google Scholar]
- 25.Kim J, Hong SW, Park B, Yoo JG, Oh M. 2019. Characterisation of the bacterial community in the gastrointestinal tracts of elk (Cervus canadensis). Antonie Van Leeuwenhoek 112:225–235. 10.1007/s10482-018-1150-5. [DOI] [PubMed] [Google Scholar]
- 26.Mccullough DR, Jiang Z, Li C. 2009. Sika deer in mainland China, p 521–539. In Mccullough DR, Takatsuki S, Kaji K (ed), Sika deer: biology and management of native and introduced populations. Springer Japan, Tokyo, Japan. [Google Scholar]
- 27.Guan Y, Yang H, Han S, Feng L, Wang T, Ge J. 2017. Comparison of the gut microbiota composition between wild and captive sika deer (Cervus nippon hortulorum) from feces by high-throughput sequencing. AMB Express 7:212. 10.1186/s13568-017-0517-8. [DOI] [PMC free article] [PubMed] [Google Scholar]
- 28.Li ZP, Liu HL, Li GY, Bao K, Wang KY, Xu C, Yang YF, Yang FH, Wright AD. 2013. Molecular diversity of rumen bacterial communities from tannin-rich and fiber-rich forage fed domestic sika deer (Cervus nippon) in China. BMC Microbiol 13:151. 10.1186/1471-2180-13-151. [DOI] [PMC free article] [PubMed] [Google Scholar]
- 29.Li Z, Wright AG, Liu H, Fan Z, Yang F, Zhang Z, Li G. 2015. Response of the rumen microbiota of sika deer (Cervus nippon) fed different concentrations of tannin rich plants. PLoS One 10:e123481. 10.1371/journal.pone.0123481. [DOI] [PMC free article] [PubMed] [Google Scholar]
- 30.Li Z, Wright AG, Liu H, Bao K, Zhang T, Wang K, Cui X, Yang F, Zhang Z, Li G. 2015. Bacterial community composition and fermentation patterns in the rumen of sika deer (Cervus nippon) fed three different diets. Microb Ecol 69:307–318. 10.1007/s00248-014-0497-z. [DOI] [PubMed] [Google Scholar]
- 31.Li Z, Wang X, Zhang T, Si H, Nan W, Xu C, Guan L, Wright AG, Li G. 2018. The development of microbiota and metabolome in small intestine of sika deer (Cervus nippon) from birth to weaning. Front Microbiol 9:4. 10.3389/fmicb.2018.00004. [DOI] [PMC free article] [PubMed] [Google Scholar]
- 32.Li Z, Si H, Nan W, Wang X, Zhang T, Li G. 2019. Bacterial community and metabolome shifts in the cecum and colon of captive sika deer (Cervus nippon) from birth to post weaning. FEMS Microbiol Lett 366:fnz010. 10.1093/femsle/fnz010. [DOI] [PubMed] [Google Scholar]
- 33.Hu X, Xu Y, Liu G, Hu D, Wang Y, Zhang W, Zheng Y. 2020. The impact of anthelmintic treatment on gut bacterial and fungal communities in diagnosed parasite-free sika deer Cervus nippon. Appl Microbiol Biotechnol 104:9239–9250. 10.1007/s00253-020-10838-y. [DOI] [PubMed] [Google Scholar]
- 34.Yan W, Sun C, Zheng J, Wen C, Ji C, Zhang D, Chen Y, Hou Z, Yang N. 2019. Efficacy of fecal sampling as a gut proxy in the study of chicken gut microbiota. Front Microbiol 10:2126. 10.3389/fmicb.2019.02126. [DOI] [PMC free article] [PubMed] [Google Scholar]
- 35.Karasov WH, Douglas AE. 2013. Comparative digestive physiology. Compr Physiol 3:741–783. 10.1002/cphy.c110054. [DOI] [PMC free article] [PubMed] [Google Scholar]
- 36.Krehbiel CR. 2014. Applied nutrition of ruminants: fermentation and digestive physiology. Prof Anim Sci 30:129–139. 10.15232/S1080-7446(15)30100-5. [DOI] [Google Scholar]
- 37.Cholewińska P, Górniak W, Wojnarowski K. 2021. Impact of selected environmental factors on microbiome of the digestive tract of ruminants. BMC Vet Res 17:25. 10.1186/s12917-021-02742-y. [DOI] [PMC free article] [PubMed] [Google Scholar]
- 38.Dehority BA. 2002. Gastrointestinal tracts of herbivores, particularly the ruminant: anatomy, physiology and microbial digestion of plants. J Appl Anim Res 21:145–160. 10.1080/09712119.2002.9706367. [DOI] [Google Scholar]
- 39.Duncan SH, Louis P, Thomson JM, Flint HJ. 2009. The role of pH in determining the species composition of the human colonic microbiota. Environ Microbiol 11:2112–2122. 10.1111/j.1462-2920.2009.01931.x. [DOI] [PubMed] [Google Scholar]
- 40.Hillman ET, Lu H, Yao T, Nakatsu CH. 2017. Microbial ecology along the gastrointestinal tract. Microbes Environ 32:300–313. 10.1264/jsme2.ME17017. [DOI] [PMC free article] [PubMed] [Google Scholar]
- 41.Wu GD, Chen J, Hoffmann C, Bittinger K, Chen YY, Keilbaugh SA, Bewtra M, Knights D, Walters WA, Knight R, Sinha R, Gilroy E, Gupta K, Baldassano R, Nessel L, Li H, Bushman FD, Lewis JD. 2011. Linking long-term dietary patterns with gut microbial enterotypes. Science 334:105–108. 10.1126/science.1208344. [DOI] [PMC free article] [PubMed] [Google Scholar]
- 42.David LA, Maurice CF, Carmody RN, Gootenberg DB, Button JE, Wolfe BE, Ling AV, Devlin AS, Varma Y, Fischbach MA, Biddinger SB, Dutton RJ, Turnbaugh PJ. 2014. Diet rapidly and reproducibly alters the human gut microbiome. Nature 505:559–563. 10.1038/nature12820. [DOI] [PMC free article] [PubMed] [Google Scholar]
- 43.Kovatcheva-Datchary P, Nilsson A, Akrami R, Lee YS, De Vadder F, Arora T, Hallen A, Martens E, Björck I, Bäckhed F. 2015. Dietary fiber-induced improvement in glucose metabolism is associated with increased abundance of Prevotella. Cell Metab 22:971–982. 10.1016/j.cmet.2015.10.001. [DOI] [PubMed] [Google Scholar]
- 44.Chen C, Fang S, Wei H, He M, Fu H, Xiong X, Zhou Y, Wu J, Gao J, Yang H, Huang L. 2021. Prevotella copri increases fat accumulation in pigs fed with formula diets. Microbiome 9:175. 10.1186/s40168-021-01110-0. [DOI] [PMC free article] [PubMed] [Google Scholar]
- 45.Pan X, Xue F, Nan X, Tang Z, Wang K, Beckers Y, Jiang L, Xiong B. 2017. Illumina sequencing approach to characterize thiamine metabolism related bacteria and the impacts of thiamine supplementation on ruminal microbiota in dairy cows fed high-grain diets. Front Microbiol 8:1818. 10.3389/fmicb.2017.01818. [DOI] [PMC free article] [PubMed] [Google Scholar]
- 46.Mancabelli L, Milani C, Lugli GA, Turroni F, Cocconi D, van Sinderen D, Ventura M. 2017. Identification of universal gut microbial biomarkers of common human intestinal diseases by meta-analysis. FEMS Microbiol Ecol 93:fix153. 10.1093/femsec/fix153. [DOI] [PubMed] [Google Scholar]
- 47.Tavella T, Rampelli S, Guidarelli G, Bazzocchi A, Gasperini C, Pujos-Guillot E, Comte B, Barone M, Biagi E, Candela M, Nicoletti C, Kadi F, Battista G, Salvioli S, O’Toole PW, Franceschi C, Brigidi P, Turroni S, Santoro A. 2021. Elevated gut microbiome abundance of Christensenellaceae, Porphyromonadaceae and Rikenellaceae is associated with reduced visceral adipose tissue and healthier metabolic profile in Italian elderly. Gut Microbes 13:1–19. 10.1080/19490976.2021.1880221. [DOI] [PMC free article] [PubMed] [Google Scholar]
- 48.Goodrich JK, Waters JL, Poole AC, Sutter JL, Koren O, Blekhman R, Beaumont M, Van Treuren W, Knight R, Bell JT, Spector TD, Clark AG, Ley RE. 2014. Human genetics shape the gut microbiome. Cell 159:789–799. 10.1016/j.cell.2014.09.053. [DOI] [PMC free article] [PubMed] [Google Scholar]
- 49.Beaumont M, Goodrich JK, Jackson MA, Yet I, Davenport ER, Vieira-Silva S, Debelius J, Pallister T, Mangino M, Raes J, Knight R, Clark AG, Ley RE, Spector TD, Bell JT. 2016. Heritable components of the human fecal microbiome are associated with visceral fat. Genome Biol 17:189. 10.1186/s13059-016-1052-7. [DOI] [PMC free article] [PubMed] [Google Scholar]
- 50.Perea K, Perz K, Olivo SK, Williams A, Lachman M, Ishaq SL, Thomson J, Yeoman CJ. 2017. Feed efficiency phenotypes in lambs involve changes in ruminal, colonic, and small-intestine-located microbiota. J Anim Sci 95:2585–2592. 10.2527/jas.2016.1222. [DOI] [PubMed] [Google Scholar]
- 51.Wu KQ, Xu YT, Zhang WW, Mao HR, Chen B, Zheng YL, Hu XL. 2021. Differences in fecal microbiome and antimicrobial resistance between captive and free-range sika deer under the same exposure of antibiotic anthelmintics. Microbiol Spectr 9:e1918-21. 10.1128/Spectrum.01918-21. [DOI] [PMC free article] [PubMed] [Google Scholar]
- 52.Bi Y, Cox MS, Zhang F, Suen G, Zhang N, Tu Y, Diao Q. 2019. Feeding modes shape the acquisition and structure of the initial gut microbiota in newborn lambs. Environ Microbiol 21:2333–2346. 10.1111/1462-2920.14614. [DOI] [PMC free article] [PubMed] [Google Scholar]
- 53.Hu XL, Liu G, Li YM, Wei YT, Lin SB, Liu SQ, Zheng YL, Hu DF. 2018. High-throughput analysis reveals seasonal variation of the gut microbiota composition within forest musk deer (Moschus berezovskii). Front Microbiol 9:1674. 10.3389/fmicb.2018.01674. [DOI] [PMC free article] [PubMed] [Google Scholar]
- 54.Ley RE, Turnbaugh PJ, Klein S, Gordon JI. 2006. Human gut microbes associated with obesity. Nature 444:1022–1023. 10.1038/4441022a. [DOI] [PubMed] [Google Scholar]
- 55.Xue D, Chen H, Luo X, Guan J, He Y, Zhao X. 2018. Microbial diversity in the rumen, reticulum, omasum, and abomasum of yak on a rapid fattening regime in an agro-pastoral transition zone. J Microbiol 56:734–743. 10.1007/s12275-018-8133-0. [DOI] [PubMed] [Google Scholar]
- 56.Croix JA, Carbonero F, Nava GM, Russell M, Greenberg E, Gaskins HR, Bereswill S. 2011. On the relationship between sialomucin and sulfomucin expression and hydrogenotrophic microbes in the human colonic mucosa. PLoS One 6:e24447. 10.1371/journal.pone.0024447. [DOI] [PMC free article] [PubMed] [Google Scholar]
- 57.Walter J, Ley R. 2011. The human gut microbiome: ecology and recent evolutionary changes. Annu Rev Microbiol 65:411–429. 10.1146/annurev-micro-090110-102830. [DOI] [PubMed] [Google Scholar]
- 58.Mi L, Yang B, Hu X, Luo Y, Liu J, Yu Z, Wang J. 2018. Comparative analysis of the microbiota between sheep rumen and rabbit cecum provides new insight into their differential methane production. Front Microbiol 9:575. 10.3389/fmicb.2018.00575. [DOI] [PMC free article] [PubMed] [Google Scholar]
- 59.Gevers D, Kugathasan S, Denson LA, Vázquez-Baeza Y, Van Treuren W, Ren B, Schwager E, Knights D, Song SJ, Yassour M, Morgan XC, Kostic AD, Luo C, González A, Mcdonald D, Haberman Y, Walters T, Baker S, Rosh J, Stephens M, Heyman M, Markowitz J, Baldassano R, Griffiths A, Sylvester F, Mack D, Kim S, Crandall W, Hyams J, Huttenhower C, Knight R, Xavier RJ. 2014. The treatment-naive microbiome in new-onset Crohn’s disease. Cell Host Microbe 15:382–392. 10.1016/j.chom.2014.02.005. [DOI] [PMC free article] [PubMed] [Google Scholar]
- 60.Vasta V, Daghio M, Cappucci A, Buccioni A, Serra A, Viti C, Mele M. 2019. Plant polyphenols and rumen microbiota responsible for fatty acid biohydrogenation, fiber digestion, and methane emission: experimental evidence and methodological approaches. J Dairy Sci 102:3781–3804. 10.3168/jds.2018-14985. [DOI] [PubMed] [Google Scholar]
- 61.Kristensen NB, Danfaer A, Agergaard N. 1998. Absorption and metabolism of short-chain fatty acids in ruminants. Arch Tierernahr 51:165–175. 10.1080/17450399809381916. [DOI] [PubMed] [Google Scholar]
- 62.Gabel G, Sehested J. 1997. SCFA transport in the forestomach of ruminants. Comp Biochem Physiol A Physiol 118:367–374. 10.1016/S0300-9629(96)00321-0. [DOI] [PubMed] [Google Scholar]
- 63.Castillo-Umaña M, Balocchi O, Pulido R, Sepúlveda-Varas P, Pacheco D, Muetzel S, Berthiaume R, Keim JP. 2020. Milk production responses and rumen fermentation of dairy cows supplemented with summer brassicas. Animal 14:1684–1692. 10.1017/S175173112000021X. [DOI] [PubMed] [Google Scholar]
- 64.Brøkner C, Austbø D, Næsset JA, Blache D, Bach Knudsen KE, Tauson AH. 2016. Metabolic response to dietary fibre composition in horses. Animal 10:1155–1163. 10.1017/S1751731115003006. [DOI] [PubMed] [Google Scholar]
- 65.Louis P, Young P, Holtrop G, Flint HJ. 2010. Diversity of human colonic butyrate-producing bacteria revealed by analysis of the butyryl-CoA:acetate CoA-transferase gene. Environ Microbiol 12:304–314. 10.1111/j.1462-2920.2009.02066.x. [DOI] [PubMed] [Google Scholar]
- 66.Wang S, Yao B, Gao H, Zang J, Tao S, Zhang S, Huang S, He B, Wang J. 2019. Combined supplementation of Lactobacillus fermentum and Pediococcus acidilactici promoted growth performance, alleviated inflammation, and modulated intestinal microbiota in weaned pigs. BMC Vet Res 15:239. 10.1186/s12917-019-1991-9. [DOI] [PMC free article] [PubMed] [Google Scholar]
- 67.Yeoman CJ, Fields CJ, Lepercq P, Ruiz P, Forano E, White BA, Mosoni P. 2021. In vivo competitions between Fibrobacter succinogenes, Ruminococcus flavefaciens, and Ruminoccus [sic] albus in a gnotobiotic sheep model revealed by multi-omic analyses. mBio 12:e03533-20. 10.1128/mBio.03533-20. [DOI] [PMC free article] [PubMed] [Google Scholar]
- 68.Lee G, Kumar S, Lee J, Chang D, Kim D, Choi S, Rhee M, Lee D, Yoon M, Kim B. 2012. Genome sequence of Oscillibacter ruminantium strain GH1, isolated from rumen of Korean native cattle. J Bacteriol 194:6362. 10.1128/JB.01677-12. [DOI] [PMC free article] [PubMed] [Google Scholar]
- 69.Caporaso JG, Kuczynski J, Stombaugh J, Bittinger K, Bushman FD, Costello EK, Fierer N, Peña AG, Goodrich JK, Gordon JI, Huttley GA, Kelley ST, Knights D, Koenig JE, Ley RE, Lozupone CA, Mcdonald D, Muegge BD, Pirrung M, Reeder J, Sevinsky JR, Turnbaugh PJ, Walters WA, Widmann J, Yatsunenko T, Zaneveld J, Knight R. 2010. QIIME allows analysis of high-throughput community sequencing data. Nat Methods 7:335–336. 10.1038/nmeth.f.303. [DOI] [PMC free article] [PubMed] [Google Scholar]
- 70.Haas BJ, Gevers D, Earl AM, Feldgarden M, Ward DV, Giannoukos G, Ciulla D, Tabbaa D, Highlander SK, Sodergren E, Methé B, Desantis TZ, Petrosino JF, Knight R, Birren BW, Human Microbiome Consortium. 2011. Chimeric 16S rRNA sequence formation and detection in Sanger and 454-pyrosequenced PCR amplicons. Genome Res 21:494–504. 10.1101/gr.112730.110. [DOI] [PMC free article] [PubMed] [Google Scholar]
- 71.Edgar RC. 2013. UPARSE: highly accurate OTU sequences from microbial amplicon reads. Nat Methods 10:996–998. 10.1038/nmeth.2604. [DOI] [PubMed] [Google Scholar]
- 72.Segata N, Izard J, Waldron L, Gevers D, Miropolsky L, Garrett WS, Huttenhower C. 2011. Metagenomic biomarker discovery and explanation. Genome Biol 12:R60. 10.1186/gb-2011-12-6-r60. [DOI] [PMC free article] [PubMed] [Google Scholar]
Associated Data
This section collects any data citations, data availability statements, or supplementary materials included in this article.
Supplementary Materials
Tables S1 and S2 and Fig. S1 to S8. Download aem.00499-22-s0001.pdf, PDF file, 2.7 MB (2.7MB, pdf)
Data Availability Statement
These 16S rRNA nucleotide sequencing data have been submitted to the SRA databases in GenBank with accession number PRJNA732137.


