

Abstract
Objective:
This study tested the efficacy of a lower-burden, simplified dietary self-monitoring approach compared with a standard calorie monitoring approach for self-monitoring adherence and weight loss in a mobile-delivered behavioral weight loss intervention.
Methods:
Participants (n = 72) with overweight or obesity who had children 2 to 12 years of age living in the home were randomly assigned to a group that used simplified dietary self-monitoring of high-calorie foods (Simplified) or a group that tracked calories (Standard). Both groups received a wireless scale, Fitbit trackers, and a 6-month intervention delivered via a smartphone application with lessons, text messages, and weekly personalized feedback messages.
Results:
Percentage weight loss at 6 months was 5.7% (95% CI: −8.3% to −3.2%) in the Standard group and 4.0% (95% CI: −5.7% to −2.3%) in the Simplified group, which was not significantly different. Similar proportions reached 5% weight loss at 6 months (43.2% in Standard and 42.9% in Simplified). There were no differences in number of dietary tracking days or change in average daily caloric intake between groups.
Conclusions:
Two mobile-delivered weight loss interventions produced clinically meaningful levels of weight loss at 6 months, with no differences in dietary tracking adherence or dietary intake. The results suggest that simplified monitoring of high-calorie foods could be a promising alternative to calorie monitoring.
INTRODUCTION
Obesity remains a critical public health concern: an estimated 42% of adults currently have obesity, and an additional 31% have overweight (1). In-person behavioral weight loss interventions are considered the “gold standard” for adult behavioral obesity treatment (2,3), but their population-wide impact on public health is constrained by the high cost of treatment delivery, limited reach, and high variability in outcomes, with up to 60% of participants not reaching clinically significant levels of weight loss (4-6). Web-based (7,8) and mobile-based (8-11) programs that include self-monitoring and tailored feedback on performance produce clinically relevant weight reductions while lowering costs and increasing reach, but asynchronous programs with little human support have not yet produced weight loss equivalent to in-person treatments (8-13).
Dietary self-monitoring is the cornerstone of behavioral weight loss (14-16), and greater adherence to detailed calorie tracking is a consistent predictor of greater weight loss (14,17-24). However, calorie monitoring declines over time among many participants, leading to lower weight loss and higher variability in treatment response (14,17,22,25). There is evidence that digital calorie monitoring can improve adherence rates compared with paper monitoring in high-intensity behavioral programs (17,20,25), and it has been associated with weight loss in web- and mobile-based programs (26-28). Nonetheless, adults have reported that digital calorie monitoring remains burdensome and time intensive (29). Calorie monitoring has been shown to have a high behavioral cost that may be initially supported by short-term weight loss and social reinforcement (30), but adherence may decline over time as the perceived cost of tracking outweighs its benefits (31). The use of photography has been explored as an alternative to calorie tracking, though it was shown to be less effective for weight loss (32). A correspondence-based study has shown that a paper-based self-monitoring method using checkboxes to approximate calorie and fat content produced higher self-monitoring rates but similar weight loss compared with paper-based tracking of calories and fat grams (33). Some digital partial dietary self-monitoring methods that require tracking some (but not all) foods were used in prior studies (31,34-37), but their efficacy has not been tested against calorie tracking. In particular, one approach involves tracking only high-calorie “red” foods based on the Traffic Light Diet that was originally developed for pediatric obesity studies (38), and it has been shown to be a feasible tracking approach that led to moderate weight loss among mothers with young children (35).
Parents of young children are a population at high risk of nonadherence in standard behavioral programs, with lower attendance at in-person meetings, lower increases in physical activity, and lower self-monitoring of diet and physical activity than adults without children (39,40). Thus, there is a need to create newer, sustainable methods of dietary self-monitoring that promote increased adherence and weight loss. Advances in technology and computer tailoring allow for simplified digital self-monitoring and highly personalized interventions that can reduce treatment burden among parents. The objective of the current study was to test the efficacy of two innovative 6-month smartphone-delivered behavioral interventions using either simplified monitoring of high-calorie red foods or standard calorie monitoring among parents with overweight or obesity who have children aged 2 to 12 in the home. The primary outcome was weight change (percentage weight loss [PWL] and weight change in kilograms) from baseline to 6 months. Secondary outcomes included dietary tracking adherence and change in parent dietary intake. It was hypothesized that participants in the Simplified group would have greater self-monitoring adherence at 6 months and, in turn, greater 6-month weight loss compared with the Standard group.
METHODS
Study design
The PATH (PArents Tracking for Health) study was a parallel-group randomized controlled trial conducted in the Raleigh-Durham area of North Carolina. The Institutional Review Board at the University of North Carolina at Chapel Hill approved the study.
Participants and recruitment
Participants were recruited from August 2019 through October 2019 using email lists and advertisements on Facebook and Instagram. Interested individuals completed an online screening survey, and eligible individuals were called by telephone to receive more information about the study. To be eligible, individuals had to be aged 21 to 55 years, have BMI of 25 to 50 kg/m2, have a child aged 2 to 12 years, speak and read English, and own an iPhone with an active data plan. Exclusion criteria were as follows: (1) current participation in another weight loss or nutrition program; (2) being pregnant, breastfeeding, or planning pregnancy in the next 6 months; (3) having lost more than 10 lb in the last 6 months; (4) 150 weekly minutes or more of moderate-to-vigorous physical activity; (5) planning to relocate or be out of town for 2 weeks or more in the next 8 months; (6) being unable to complete two study visits at the clinic; (7) having preexisting medical condition(s) that preclude adherence to an unsupervised exercise program; (8) undergoing treatment of diabetes with insulin or oral medications that may cause hypoglycemia; (9) having a history of a diagnosed eating disorder; (10) having a diagnosis of schizophrenia or bipolar disorder; (11) being hospitalized for a psychiatric diagnosis within the last year; or (12) reporting a past diagnosis or current symptoms of alcohol or substance dependence. Individuals provided online consent to enroll. Individuals who completed the baseline assessment were randomly assigned to the standard calorie monitoring group (Standard) or the simplified monitoring group (Simplified). Randomization was conducted using the REDCap randomization module with equal probability by a staff member not associated with the study.
Intervention overview
Elements common to both groups
All intervention participants received a digital, primarily automated behavioral weight loss intervention based on social cognitive theory (41) that included evidence-based behavior change strategies to promote self-monitoring and adherence to personalized goals for dietary intake, activity, and weighing. Participants first attended a 75-minute group kickoff session, separated by treatment group. During this session, they received their group assignment, activity tracker (Fitbit Inspire), and smart scale (Withings Body), and they downloaded the PATH study and Fitbit smartphone applications. Participants were recommended to self-weigh daily on their scale. Weights synced directly to study servers. Participants were encouraged to wear their activity tracker daily and they received an individualized daily goal based on their baseline levels of activity, at a minimum of 10 minutes per day. If participants’ weekly total activity minutes equaled at least five times their daily goal, the following week their daily goal was increased by 5 minutes, up to a maximum of 60 minutes. Otherwise, the daily goal remained the same the following week. Participants also received daily dietary goals and tracked their dietary intake although the method of dietary self-monitoring differed by group. Participants in both groups could view their daily self-monitoring data and historical progress toward their goals in the PATH app.
The app also included a “Lessons” page, where lessons were unlocked weekly in Months 1 to 3 and biweekly in Months 4 to 6. Lessons focused on behavioral strategies with specific instruction for cognitive and behavioral skills to help participants meet their dietary and activity goals (i.e., self-monitoring, problem solving, overcoming common barriers, enlisting social support, goal setting, cognitive restructuring). Lessons included topics such as setting limits, snacking, physical activity, sedentary behavior, problem solving, stress management, and relapse prevention.
To support their changes, participants received weekly automated feedback in the PATH app. Computer-tailored algorithms used data from dietary self-monitoring logs, data from the activity tracker, and weights from the smart scales in order to drive tailored, comprehensive feedback on weight change and progress toward behavioral goals (e.g., feedback on number of days that diet, activity, and weighing goals were met, overall weight change, weekly weight change; Table 1). Participants also received four to five text messages per week. These included three to four “in the moment” feedback messages using their self-monitoring data (e.g., “You logged a complete day of red food tracking in your PATH app and you stuck to your limit, great work!”), messages alerting them to new lessons and feedback available in their app, and one message that was either focused on parenting skills or general motivation for healthy behaviors.
TABLE 1.
Example feedback rules and messages for Week 1 of the program
| Decision rule | Message |
|---|---|
Tailoring variables:
|
Hi, [name], thanks for checking in today to review your feedback. Your start weight in the PATH system (based on the weight from your Withings scale at the beginning of the program) is [weight]. Great news—your most recent weight is below your starting weight, and you did a fantastic job tracking your red foods all 7 days. This week, set your sights on staying under your red food limit—it’s been chosen just for you to help you lose weight. The more days you stay under your limit, the more weight you will lose. Wearing a Fitbit can take some getting used to, but it can help you plan your activity and helps us give you better support. Start this week off on the right foot by putting on your Fitbit and trying a 10-minute walk today. Every bit will get you closer to meeting your goal. We see that you did a great job stepping on the scale this week. Make it a habit by weighing every day this week. Have a healthy, active week! |
Abbreviation: PATH, Parents Tracking for Health.
Standard group
Participants received a daily calorie goal based on their starting weight (<200 lb = 1,200 calories; 200-249 lb = 1,500 calories; and ≥250 lb = 1,800 calories). Participants tracked their daily caloric intake from foods and beverages in the Fitbit app. Using the Fitbit application programming interface, calorie data were synced to study servers in real time and were displayed to participants in the PATH app.
Simplified group
Participants used a simplified version of dietary self-monitoring based on the Traffic Light Diet, which categorizes foods as green, yellow, or red (high-calorie foods such as sweets, chips, fried foods, sweetened beverages, alcohol, etc.) (38). Participants were asked to track only red foods and were given a daily red food limit based on their starting weight (<200 lb = three red foods; 200-249 lb = four red foods; ≥250 lb = five red foods). The red food limits were created based on average calories in red foods (≥150 calories/serving), such that limiting consumption would produce a caloric deficit necessary for a weight loss of 1 to 2 lb per week. Participants tracked their foods in a food log that was built into the PATH app, which included four meals (breakfast, lunch, dinner, snack). The food log was available only to Simplified group participants. Participants were instructed to select the “No Red Food” button for any meal in which they consumed zero red foods.
Measures
Participants completed assessments of weight, height, and dietary intake at baseline and at 6 months and completed online survey measures at baseline, 3 months, and 6 months. Participants received $20 for completing the 3-month online-only assessment and $40 for completing the 6-month assessment.
Demographics
Standard demographic information was collected via the online survey, including age, race/ethnicity, occupation, education, income, marital status, and weight history.
Height and weight
Weight and height were objectively measured in the clinic by trained staff blinded to treatment assignment following a standardized protocol. Measurements were taken twice (three times when not within 0.1 kg and 0.1 cm for weight and height, respectively) and averaged. In addition, participants completed a standardized weighing protocol at home the morning after receiving their smart scales, which included weighing three consecutive times and confirming that their weights were transmitted to the PATH app. Weight was used to calculate the primary outcome of PWL at 6 months ([(Weight at 6 months – Baseline Weight)/Baseline Weight] × 100). Notably, because of the COVID-19 pandemic, only the first cohort (n = 13) completed the 6-month weight measurement in the clinic. The remaining participants received instructions to complete the at-home standardized weighing protocol for their 6-month assessment; these weights were paired with baseline at-home scale weights for analysis. The correlation between all baseline clinic and at-home scale weights was high (r = 0.95, p < 0.0001).
Dietary tracking adherence
Self-monitoring of dietary intake was calculated using data from Fitbit food logs for Standard group participants and from the PATH app food log for Simplified group participants. The secondary outcome of interest was number of dietary tracking days summed over the 6-month study period. Thresholds for dietary tracking adherence were defined based on the amount of information needed by the program to provide accurate feedback to participants. For the Standard group, adherence to tracking was defined as tracking ≥800 calories on a given day (42). For the Simplified group, adherence to tracking was defined as tracking both breakfast and dinner (i.e., paying attention to what they are eating for most of the day) or exceeding the daily red food limit. For descriptive purposes, the percentage of participants with at least one dietary tracking day in each month and the average percentage of dietary tracking days were calculated by treatment group and by program month.
Tracker wear and weighing adherence
For descriptive purposes, Fitbit data were used to calculate the percentage of participants with at least one tracker wear day per month and, among those participants, the average percentage of days of tracker wear during each month. A wear day was defined as having ≥100 steps, which was set low to ensure that participant text messages delivered earlier in the day contained accurate feedback. Smart scale data were used to calculate the percentage of participants with at least one weigh day each month and, among those participants, the percentage of days weighed each month.
Dietary intake
Participants completed two 24-hour dietary recalls with staff trained in dietary assessment via telephone, on one weekday and one weekend day, at baseline and at 6 months. Recalls were scheduled, rather than unannounced, to promote adherence to completed recalls among this population. Staff entered recall data into the Nutrition Data System for Research, which calculated average daily caloric intake in kilocalories per day.
Program acceptability and satisfaction
Participants completed a posttreatment program evaluation that included questions about program satisfaction and perceptions of self-monitoring.
Sample size
This was designed as a pilot study. A power analysis indicated that a total of 72 individuals, accounting for 10% attrition at 6 months, would provide 80% power to detect a between-group difference of 2% weight loss (SD = 2.8) using a two-tailed test with an α level of 0.05.
Statistical analyses
Analyses were conducted using SAS software version 9.4. Descriptive statistics were calculated for baseline demographic characteristics. According to the Consolidated Standards of Reporting Trials (CONSORT) guidelines (43), analyses examining differences between treatment groups at baseline were not conducted; these variables were evaluated as confounders, but none met criteria (being significantly associated with both treatment group and the outcome). Paired t tests were used to evaluate within-group change over time in weight (kilograms) and average daily caloric intake, and Pearson correlations were used to determine the correlation between dietary tracking days and PWL within each treatment group. Linear regression was used to evaluate the effect of treatment group on PWL, weight change (kilograms), and average daily caloric intake at 6 months. Models for weight change (kilograms) and average daily caloric intake included the 6-month value as the dependent variable, with a covariate for the baseline value. Given the non-normality of the dietary adherence data, the Mann-Whitney U test was used to examine differences in dietary tracking days between groups. In addition, χ2 tests evaluated differences between groups in the percentage of participants who lost 3% and 5% of their body weight.
RESULTS
Of the 72 enrolled and randomized participants, 37 were assigned to the Standard group and 35 to the Simplified group (Figure 1). Participants were, on average (mean [SD]), 40.0 (4.6) years old with BMI of 34.2 (6.4) kg/m2. Baseline demographics of the parents by treatment group are presented in Table 2. There were no significant differences between groups. Overall, retention on the primary outcome was 96% at 6 months. All participants who did not complete the 6-month weight measurement were in the Standard group (n = 3; p = 0.09 compared with n = 0 in Simplified). Baseline BMI did not differ between those who completed the final assessment and those who did not (34.0 [32.5] vs. 38.5 [13.8], p = 0.24).
FIGURE 1.
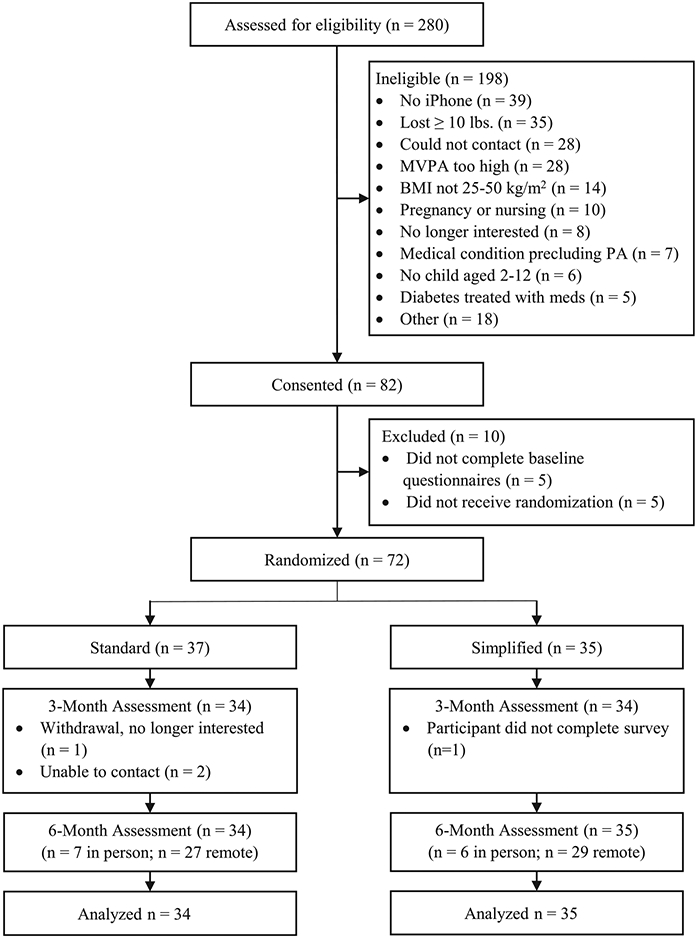
Study recruitment, enrollment, and retention (CONSORT). CONSORT, Consolidated Standards of Reporting Trials; MVPA, moderate-to-vigorous physical activity; PA, physical activity
TABLE 2.
Baseline characteristics by treatment group
| Standard (n = 37) | Simplified (n = 35) |
|
|---|---|---|
| Age (y), mean ± SD | 39.8 ± 4.7 | 40.2 ± 4.7 |
| Female | 35 (94.6) | 33 (94.3) |
| Ethnicity | ||
| Hispanic/Latino | 0 (0.0) | 2 (5.7) |
| Non-Hispanic/Latino | 37 (100.0) | 33 (94.3) |
| Race | ||
| Asian | 0 (0.0) | 1 (2.9) |
| Black or African American | 5 (13.5) | 4 (11.4) |
| Hispanic, Latino, or Cape Verdean | 3 (8.1) | 0 (0.0) |
| White | 29 (78.4) | 28 (80.0) |
| Othera | 0 (0.0) | 2 (5.7) |
| Education | ||
| High school, vocational training, or some college | 1 (2.7) | 4 (11.4) |
| Bachelor’s degree | 17 (46.0) | 10 (28.6) |
| Graduate or professional degree | 19 (51.4) | 21 (60.0) |
| Marital status | ||
| Married or living with partner | 35 (94.6) | 29 (82.9) |
| Not married or living with partner | 2 (5.4) | 6 (17.1) |
| Weight (kg), mean ± SD | 99.1 ± 21.6 | 91.0 ± 15.9 |
| BMI (kg/m2), mean ± SD | 35.3 ± 6.8 | 33.07 ± 5.7 |
| Number of children in home, mean ± SD | 1.9 ± 0.7 | 2.0 ± 0.9 |
Note: All data given as n (%) unless otherwise indicated.
Other = checked the response option “Other” and race is unknown.
Weight change
Results of primary and secondary outcome analyses are in Tables 3 and 4. PWL at 6 months was −5.7% (95% CI: −8.3% to −3.2%) in the Standard group and −4.0% (95% CI: −5.7% to −2.3%) in the Simplified group (p = 0.25). Standard group participants lost 5.9 kg at 6 months (SD = 8.3; 95% CI: −8.8 to −3.0), and Simplified group participants lost 3.5 kg (SD = 4.5; 95% CI: −5.1 to −2.0; between-group p = 0.24).
TABLE 3.
Weight change and change in daily caloric intake within and between groups
| Variable | Baseline Mean (95% CI) | Change from baseline to 6 months Mean (95% CI)a |
p valueb |
|---|---|---|---|
| Percent weight loss | |||
| Standard (n = 34) | – | −5.7 (−8.3 to −3.2) | 0.25 |
| Simplified (n = 35) | – | −4.0 (−5.7 to −2.3) | |
| Weight (kg) | |||
| Standard (n = 34) | 99.2 (91.5, 106.9) | −5.9 (−8.8 to −3.0)** | 0.24 |
| Simplified (n = 35) | 91.0 (85.6, 96.5) | −3.5 (−5.1 to −2.0)*** | |
| Average daily caloric intake (kcal/day) | |||
| Standard (n = 33) | 1728.1 (1530.6, 1925.8) | −247.3 (−500.1 to 5.5) | 0.87 |
| Simplified (n = 33) | 1758.3 (1532.3, 1984.3) | −295.9 (−581.3 to −10.6)* |
Models for weight (kg) and average daily caloric intake (kcal/day) adjusted for baseline value.
Linear regression with treatment as independent variable, models for weight (kg) and average daily caloric intake (kcal/day) include covariate for baseline levels.
Significant at p < .05 level for within-group change over time (paired t-test).
Significant at p < .001 level for within-group change over time (paired t-test).
Significant at p < .0001 level for within-group change over time (paired t-test).
TABLE 4.
Mean and median dietary tracking days between groups
| Mean (95% CI) | Median (IQR) |
p valuea | |
|---|---|---|---|
| Number of dietary tracking days | |||
| Standard (n = 34) | 89.2 (70.2, 108.3) | 97 (30-139) | 0.91 |
| Simplified (n = 35) | 86.2 (68.5, 103.9) | 89 (36-129) | |
Mann-Whitney U test for difference in dietary tracking days between treatment groups.
Self-monitoring engagement and dietary intake
There were no between-group differences in dietary tracking days over 6 months among participants who completed the 6-month assessment. Standard group participants had an average of 89.2 dietary tracking days (95% CI: 70.2-108.3; median = 97, interquartile range = 30-139) compared with 86.2 days (95% CI: 68.5-103.9; median = 89, interquartile range = 36-129) among Simplified group participants. Number of dietary tracking days was significantly correlated with PWL in the Standard group (r = −0.54, p < 0.001) but not in the Simplified group (r = −0.23, p = 0.18). Figure 2 displays the percentage of participants who were still using each form of self-monitoring (dietary tracking, activity tracker wear, and self-weighing) in each month of the study by treatment group, in addition to the average percentage of days tracked each month by treatment group.
FIGURE 2.
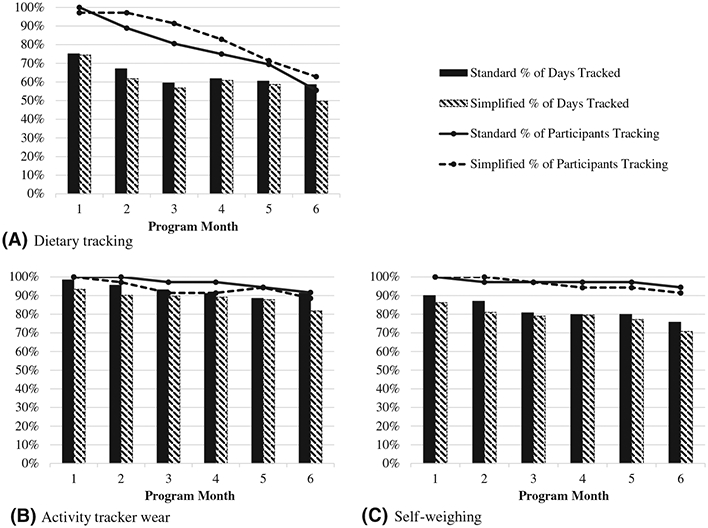
Adherence to self-monitoring by treatment group across each program month. (A) Bars represent percent of participants who tracked any dietary information at least one day that month and lines represent the average percent of days that dietary information was tracked among those participants that month. (B) Bars represent percent of participants who wore their activity tracker at least one day that month and lines represent the average percent of days that the activity tracker was worn among those participants that month. (C) Bars represent percent of participants who self-weighed at least one day that month and lines represent the average percent of days that those participants self-weighed that month
Participants in the Standard group reduced their average daily caloric intake by 247.3 kcal (95% CI: −500.1 to 5.5). Participants in the Simplified group reduced their average daily caloric intake by 295.9 kcal (95% CI: −581.3 to −10.6). There were no between-group differences in change over time (p = 0.87).
Five percent and ten percent weight loss
There were no between-group differences in the percentage of participants who reached 5% and 10% weight loss at 6 months. Among all randomized participants (with last available scale weight used for the three missing weight observations), 43.2% in Standard (n = 16) and 42.9% in Simplified (n = 15) lost 5% (χ2 = 0.12, p = 0.73), and 18.9% (n = 7) in Standard and 14.3% (n = 5) in Simplified lost 10% (χ2 = 0.48, p = 0.49). Among completers in Standard (n = 34), 47.1% lost 5%, and 20.6% lost 10%.
Program evaluation
Out of the 68 participants who completed the online questionnaires at 6 months, the percentage of participants who reported being “somewhat satisfied” or “very satisfied” with the overall program was similar between groups (82% in Standard and 81% in Simplified; Table 5). No participants in the Simplified group responded with “very dissatisfied” compared with 9% of participants in the Standard group. In addition, similar proportions of participants in both groups would “probably” or “definitely” recommend the program to others (84.9% in Standard and 87.6% in Simplified). Participants in the Standard group reported a higher likelihood of continuing to use the tracking approach used in the program in the future (5.7 [2.5] in Standard vs. 4.3 [2.3] in Simplified, B = 1.38, p = 0.025).
TABLE 5.
Program evaluation and perceptions of dietary self-monitoring by treatment group
| Variable | Responses | Standard (n = 35) %/ Mean (SD) |
Simplified (n = 33) %/ Mean (SD) |
|---|---|---|---|
| Satisfied with the overall program | Very dissatisfied | 8.6% | 0% |
| Somewhat dissatisfied | 8.6% | 21.2% | |
| Somewhat satisfied | 34.3% | 39.4% | |
| Very satisfied | 48.6% | 39.4% | |
| Recommend the program to others | Definitely not | 5.7% | 0% |
| Probably not | 8.6% | 12.1% | |
| Probably would | 37.1% | 45.5% | |
| Definitely would | 48.6% | 42.4% | |
| Difficulty tracking diet | Likert scale | 5.0 (2.7) | 4.9 (2.3) |
| 1 = Very easy to | |||
| 8 = Very difficult | |||
| Difficulty making prescribed changes in diet | Likert scale | 4.7 (2.2) | 4.8 (1.7) |
| 1 = Very easy to | |||
| 8 = Very difficult | |||
| Confidence in continuing to follow eating approach used in this program | Likert scale | 5.6 (2.6) | 5.2 (2.3) |
| 1 = Not confident to | |||
| 8 = Very confident | |||
| How likely to continue using food tracking approach used in this program | Likert scale | 5.7 (2.5) | 4.4 (2.3)* |
| 1 = Very unlikely to | |||
| 8 = Very likely | |||
| Satisfied with achievement in the program | Likert scale | 5.0 (2.7) | 4.5 (2.2) |
| 1 = Not satisfied to | |||
| 8 = Very satisfied |
Between-group difference significant at p value < 0.05.
DISCUSSION
Two primarily automated interventions produced 4% to 5.7% weight loss at 6 months, with similar levels of dietary self-monitoring, tracker wear, and self-weighing. Both the calorie monitoring and simplified monitoring groups lost clinically relevant levels of weight at 6 months and reduced average daily caloric intake from baseline to 6 months by 250 to 300 kcal/d, although the change over time was significant only for the Simplified group. The 5.7% weight loss in the Standard group was not different than the 4.0% weight loss in the Simplified group (Cohen’s d = 0.26). Moreover, the same percentage of participants achieved 5% weight loss in each group (43.2% in Standard and 42.9% in Simplified). Although these findings suggest that the detail and accuracy achieved via calorie monitoring may have a greater association with weight loss for those who are adherent, the results also suggest that complete calorie monitoring may not be essential for weight loss.
The finding that a partial dietary self-monitoring approach resulted in 4% weight loss over 6 months and that it was equally as successful at promoting 5% weight loss contributes to the literature on simplified alternatives to detailed calorie monitoring, which has been limited to this point. Even though the high variability in adherence to calorie monitoring significantly limits its potential as an effective tool for dietary change at a population-wide level, only one prior randomized controlled trial tested the efficacy of a lower-burden alternative to digital calorie monitoring, with results similar to the current study. In that pilot study, one group of participants used smartphone-based photography to submit pictures of what they consumed, and at 6 months, there were no differences in tracking days or weight loss for this group compared with the calorie monitoring group, although tracking adherence was associated with weight loss only in the calorie monitoring group (32). Partial dietary self-monitoring methods that require tracking only some foods have been used, but not tested, in prior studies (31,34-37). This was the first mobile study to directly compare a non-photography-based alternative to calorie monitoring. It was hypothesized that simplified monitoring would be easier, would take less time, and would result in greater adherence. Both groups had a similar number of dietary tracking days, and there were no differences in the perceived difficulty of each approach. Standard group participants also reported being more likely to continue using their self-monitoring approach after the program compared with Simplified group participants. It is not clear why this difference emerged, perhaps because it led to the greater weight loss, on average, with equivalent days of dietary tracking.
Overall, this study showed that clinically relevant weight losses were observed in two smartphone-delivered weight loss interventions. Other than an initial group meeting, which could be delivered in the future via remote sessions, the behavioral program was automated and did not include human contact. The program consisted of lessons in the app, text messages, and weekly feedback messages. Few 6-month trials have evaluated mobile-delivered interventions without human support via counseling sessions. However, the 3.5-kg and 5.9-kg weight losses observed in the Simplified and Standard groups are equal to or higher than the 3.5-kg loss in a recent trial (44) that tested a 6-month mobile-delivered intervention using one in-person session; a smartphone app; self-monitoring of “core foods,” water, and energy-dense foods in an external app; goal setting; personalized feedback on core foods; Fitbit trackers; and scales. This closely approximates the Simplified monitoring approach used in the current study, and weight losses were 3.5 kg at 6 months in both studies. This further supports the finding that a simplified dietary tracking approach, along with other remotely delivered core behavioral strategies, can lead to clinically meaningful weight loss. The weight losses from these mobile trials, plus a recent mobile-only program with self-monitoring of calories and personalized feedback that resulted in a 2.8-kg weight loss (45), are higher than those reported in a meta-analysis of mobile phone app interventions, which found weight changes of approximately 1.1 kg compared with control groups (9). Notably, the current study and the two trials discussed here included elements that are considered key ingredients for behavior change, including self-monitoring, goal setting, and personalized feedback (8), which supports the evidence that mobile programs can begin to approximate the weight losses observed in face-to-face programs if they include these key components.
In sum, this pilot trial provides preliminary evidence for a simplified monitoring strategy that includes tracking only high-calorie foods. There are several strengths of this study, including 96% retention, the use of behavioral data collected in real time, and the use of automated text messages and weekly feedback summaries that provided personalized messaging. In addition, because messages were written in advance and delivered automatically, they were standardized across participants and were delivered with high fidelity.
The primary limitation of this study is that it was a pilot study that was powered to detect a 2% weight loss difference between groups, although the observed difference of 1.7% is equal to an effect size of 0.26 and would be impactful at a wider population level. The sample was also primarily composed of highly educated, female, White participants and parents of young children, which limits generalizability to a broader population. Because the intervention was delivered remotely, there was little room for contamination; however, because calorie tracking apps are widely available, there is a possibility that participants in the Simplified group started using calorie tracking approaches during the intervention. Another limitation is the lack of follow-up measurements at 12 months, which limits the ability to understand whether the type of dietary self-monitoring influences long-term adherence and weight change.
With the knowledge that simplified self-monitoring can lead to clinically meaningful weight loss, and given the high heterogeneity in self-monitoring adherence and weight change, future research should test adaptive approaches that provide participants with the “right” approach to dietary self-monitoring, either by providing alternatives from the beginning or starting with standard calorie monitoring and providing simplified alternatives when needed. In addition, secondary analyses and adaptive randomized trials could examine which self-monitoring approach is best for whom, the optimal time in the intervention to evaluate early treatment response, and what types of support are needed to maximize adherence.
Study Importance.
What is already known?
Standard calorie monitoring is associated with weight loss; however, variability in adherence to calorie monitoring is high and declines over time.
Preliminary studies have shown that partial dietary self-monitoring approaches could be a lower-burden alternative, but few studies have tested alternatives in a randomized controlled trial.
What does this study add?
Weight loss and tracking adherence at 6 months were similar between the Standard group and the Simplified group.
Tracking adherence was associated with weight loss only in the Standard group, and participants in the Standard group reported a higher likelihood of continuing the tracking approach after the program.
How might these results change the direction of research or the focus of clinical practice?
This study demonstrates that mobile programs with self-monitoring and automated, personalized feedback can result in clinically meaningful weight loss, and they have the potential for higher reach than programs with synchronous sessions.
The results highlight the need to test adaptive treatment approaches to determine which self-monitoring approach is best for whom, the optimal time in the intervention to evaluate early response, and what types of support are needed to maximize adherence.
ACKNOWLEDGMENTS
The authors thank the study participants for their important contributions to this research and acknowledge the staff and students involved in this project, including Karen Hatley, Kristen Polzien, Molly Diamond, Erin Coffman, and Caitlin Martinez. The authors do not have permission to share raw study data owing to requirements to protect the privacy of participants, in accordance with participant informed consent (University of North Carolina at Chapel Hill Institutional Review Board Study #17-3027). However, deidentified data related to this analysis may be made available upon reasonable request within 5 years of this publication.
Funding information
This work was supported by funding from the Karen Miller-Kovach Research Grant, provided by WW and The Obesity Society. This work was supported in part by the University of North Carolina (UNC) Connected Health Applications & Interventions Core through a grant from the National Institute of Diabetes and Digestive and Kidney Diseases of the National Institutes of Health (NIH) (grant P30DK056350 to the UNC Nutrition Obesity Research Center) and/or from the National Cancer Institute of the NIH (grant P30CA016086 to the UNC Lineberger Comprehensive Cancer Center). The use of REDCap was supported by a grant from the Clinical and Translational Science Award program of the Division of Research Resources at the NIH (grant UL1TR002489)
Footnotes
CONFLICT OF INTEREST
DFT is a member of the Scientific Advisory Board for WW International and the Scientific Advisory Board for Wondr Health. The other authors declared no conflict of interest.
CLINICAL TRIAL REGISTRATION
ClinicalTrials.gov identifier NCT03973424.
REFERENCES
- 1.Fryar CD, Carroll MD & Afful J Prevalence of overweight, obesity, and severe obesity among adults aged 20 and over: United States, 1960–1962 through 2017–2018. National Center for Health Statistics Health E-Stats. Published December 2020. Revised January 29, 2021. Accessed May 15, 2021. https://www.cdc.gov/nchs/data/hestat/obesity-adult-17-18/overweight-obesity-adults-H.pdf. [Google Scholar]
- 2.Delahanty LM, Nathan DM. Implications of the diabetes prevention program and Look AHEAD clinical trials for lifestyle interventions. J Am Diet Assoc. 2008;108:S66–72. [DOI] [PMC free article] [PubMed] [Google Scholar]
- 3.Jensen MD, Ryan DH, Apovian CM, et al. 2013 AHA/ACC/TOS guideline for the management of overweight and obesity in adults: a report of the American College of Cardiology/American Heart Association Task Force on Practice Guidelines and The Obesity Society. J Am Coll Cardiol. 2014;63:2985–3023. [DOI] [PubMed] [Google Scholar]
- 4.Jakicic JM, Tate DF, Lang W, et al. Effect of a stepped-care intervention approach on weight loss in adults: a randomized clinical trial. JAMA. 2012;307:2617–2626. [DOI] [PMC free article] [PubMed] [Google Scholar]
- 5.Butryn ML, Webb V, Wadden TA. Behavioral treatment of obesity. Psychiatr Clin North Am. 2011;34(4):841–859. doi: 10.1016/j.psc.2011.08.006 [DOI] [PMC free article] [PubMed] [Google Scholar]
- 6.Wing RR, Hamman RF, Bray GA, et al. Achieving weight and activity goals among diabetes prevention program lifestyle participants. Obes Res. 2004;12:1426–1434. [DOI] [PMC free article] [PubMed] [Google Scholar]
- 7.Neve M, Morgan PJ, Jones PR, Collins CE. Effectiveness of web-based interventions in achieving weight loss and weight loss maintenance in overweight and obese adults: a systematic review with meta-analysis. Obes Rev. 2010;11:306–321. [DOI] [PubMed] [Google Scholar]
- 8.Hutchesson MJ, Rollo ME, Krukowski R, et al. eHealth interventions for the prevention and treatment of overweight and obesity in adults: a systematic review with meta-analysis. Obes Rev. 2015;16:376–392. [DOI] [PubMed] [Google Scholar]
- 9.Islam MM, Poly TN, Walther BA, Jack Li Y-C. Use of mobile phone app interventions to promote weight loss: meta-analysis. JMIR Mhealth Uhealth. 2020;8:e17039. doi: 10.2196/17039 [DOI] [PMC free article] [PubMed] [Google Scholar]
- 10.Schippers M, Adam PCG, Smolenski DJ, Wong HTH, de Wit JBF. A meta-analysis of overall effects of weight loss interventions delivered via mobile phones and effect size differences according to delivery mode, personal contact, and intervention intensity and duration. Obes Rev. 2017;18:450–459. [DOI] [PubMed] [Google Scholar]
- 11.Villinger K, Wahl DR, Boeing H, Schupp HT, Renner B. The effectiveness of app-based mobile interventions on nutrition behaviours and nutrition-related health outcomes: a systematic review and meta-analysis. Obes Rev. 2019;20:1465–1484. [DOI] [PMC free article] [PubMed] [Google Scholar]
- 12.Hurkmans E, Matthys C, Bogaerts A, Scheys L, Devloo K, Seghers J. Face-to-face versus mobile versus blended weight loss program: randomized clinical trial. JMIR Mhealth Uhealth. 2018;6:e14. doi: 10.2196/mhealth.7713 [DOI] [PMC free article] [PubMed] [Google Scholar]
- 13.Turner-McGrievy GM, Wilcox S, Boutté A, et al. The dietary intervention to enhance tracking with mobile devices (DIET Mobile) study: a 6-month randomized weight loss trial. Obesity (Silver Spring). 2017;25:1336–1342. [DOI] [PMC free article] [PubMed] [Google Scholar]
- 14.Tate DF, Wing RR, Winett RA. Using Internet technology to deliver a behavioral weight loss program. JAMA. 2001;285:1172–1177. [DOI] [PubMed] [Google Scholar]
- 15.Tate DF, Jackvony EH, Wing RR. Effects of Internet behavioral counseling on weight loss in adults at risk for type 2 diabetes: a randomized trial. JAMA. 2003;289:1833–1836. [DOI] [PubMed] [Google Scholar]
- 16.Wadden TA, Butryn ML, Byrne KJ. Efficacy of lifestyle modification for long-term weight control. Obes Res. 2004;12:151S–S162. [DOI] [PubMed] [Google Scholar]
- 17.Burke LE, Conroy MB, Sereika SM, et al. The effect of electronic self-monitoring on weight loss and dietary intake: a randomized behavioral weight loss trial. Obesity (Silver Spring). 2011;19:338–344. [DOI] [PMC free article] [PubMed] [Google Scholar]
- 18.Hartmann-Boyce J, Johns DJ, Jebb SA, Aveyard P. Behavioural Weight Management Review Group. Effect of behavioural techniques and delivery mode on effectiveness of weight management: systematic review, meta-analysis and meta-regression. Obes Rev. 2014;15:598–609. [DOI] [PMC free article] [PubMed] [Google Scholar]
- 19.Burke LE, Wang J, Sevick MA. Self-monitoring in weight loss: a systematic review of the literature. J Am Diet Assoc. 2011;111:92–102. [DOI] [PMC free article] [PubMed] [Google Scholar]
- 20.Wang J, Sereika SM, Chasens ER, Ewing LJ, Matthews JT, Burke LE. Effect of adherence to self-monitoring of diet and physical activity on weight loss in a technology-supported behavioral intervention. Patient Prefer Adherence. 2012;6:221–226. [DOI] [PMC free article] [PubMed] [Google Scholar]
- 21.Wadden TA, Berkowitz RI, Womble LG, et al. Randomized trial of lifestyle modification and pharmacotherapy for obesity. N Engl J Med. 2005;353:2111–2120. [DOI] [PubMed] [Google Scholar]
- 22.Baker RC, Kirschenbaum DS. Self-monitoring may be necessary for successful weight control. Behav Ther. 1993;24:377–394. [Google Scholar]
- 23.Yon BA, Johnson RK, Harvey-Berino J, Gold BC, Howard AB. Personal digital assistants are comparable to traditional diaries for dietary self-monitoring during a weight loss program. J Behav Med. 2007;30:165–175. [DOI] [PubMed] [Google Scholar]
- 24.Wing RR, Tate DF, Gorin AA, Raynor HA, Fava JL. A self-regulation program for maintenance of weight loss. N Engl J Med. 2006;355:1563–1571. [DOI] [PubMed] [Google Scholar]
- 25.Burke LE, Styn MA, Sereika SM, et al. Using mHealth technology to enhance self-monitoring for weight loss: a randomized trial. Am J Prev Med. 2012;43:20–26. [DOI] [PMC free article] [PubMed] [Google Scholar]
- 26.Painter SL, Lu W, Schneider J, James R, Shah B. Drivers of weight loss in a CDC-recognized digital diabetes prevention program. BMJ Open Diabetes Res Care. 2020;8:e001132. doi: 10.1136/bmjdrc-2019-001132 [DOI] [PMC free article] [PubMed] [Google Scholar]
- 27.Harvey J, Krukowski R, Priest J, West D. Log often, lose more: electronic dietary self-monitoring for weight loss. Obesity (Silver Spring). 2019;27:380–384. doi: 10.1002/oby.22382 [DOI] [PMC free article] [PubMed] [Google Scholar]
- 28.Cavero-Redondo I, Martinez-Vizcaino V, Fernandez-Rodriguez R, Saz-Lara A, Pascual-Morena C, Álvarez-Bueno C. Effect of behavioral weight management interventions using lifestyle mHealth self-monitoring on weight loss: a systematic review and meta-analysis. Nutrients. 2020;12:1977. doi: 10.3390/nu12071977 [DOI] [PMC free article] [PubMed] [Google Scholar]
- 29.Solbrig L, Jones R, Kavanagh D, May J, Parkin T, Andrade J. People trying to lose weight dislike calorie counting apps and want motivational support to help them achieve their goals. Internet Interv. 2017;7:23–31. [DOI] [PMC free article] [PubMed] [Google Scholar]
- 30.Perri MG, McAdoo WG, McAllister DA, et al. Effects of peer support and therapist contact on long-term weight loss. J Consult Clin Psychol. 1987;55:615–617. [DOI] [PubMed] [Google Scholar]
- 31.Leahey TM, Fava JL, Seiden A, et al. A randomized controlled trial testing an Internet delivered cost-benefit approach to weight loss maintenance. Prev Med. 2016;92:51–57. [DOI] [PMC free article] [PubMed] [Google Scholar]
- 32.Dunn CG, Turner-McGrievy GM, Wilcox S, Hutto B. Dietary self-monitoring through calorie tracking but not through a digital photography app is associated with significant weight loss: the 2SMART pilot study—a 6-month randomized trial. J Acad Nutr Diet. 2019;119:1525–1532. [DOI] [PubMed] [Google Scholar]
- 33.Helsel DL, Jakicic JM, Otto AD. Comparison of techniques for self-monitoring eating and exercise behaviors on weight loss in a correspondence-based intervention. J Am Diet Assoc. 2007;107:1807–1810. [DOI] [PubMed] [Google Scholar]
- 34.Tate DF, Quesnel DA, Lutes L, et al. Examination of a partial dietary self-monitoring approach for behavioral weight management. Obes Sci Pract. 2020;6:353–364. [DOI] [PMC free article] [PubMed] [Google Scholar]
- 35.Nezami BT, Ward DS, Lytle LA, Ennett ST, Tate DF. A mHealth randomized controlled trial to reduce sugar-sweetened beverage intake in preschool-aged children. Pediatr Obes. 2018;13:668–676. [DOI] [PubMed] [Google Scholar]
- 36.Steinberg D, Kay M, Burroughs J, Svetkey LP, Bennett GG. The effect of a digital behavioral weight loss intervention on adherence to the Dietary Approaches to Stop Hypertension (DASH) dietary pattern in medically vulnerable primary care patients: results from a randomized controlled trial. J Acad Nutr Diet. 2019;119:574–584. [DOI] [PMC free article] [PubMed] [Google Scholar]
- 37.Brindal E, Hendrie GA, Freyne J, Noakes M. A mobile phone app designed to support weight loss maintenance and well-being (MotiMate): randomized controlled trial. JMIR Mhealth Uhealth. 2019;7:e12882. doi: 10.2196/12882 [DOI] [PMC free article] [PubMed] [Google Scholar]
- 38.Epstein LH, Paluch RA, Beecher MD, Roemmich JN. Increasing healthy eating vs. reducing high energy-dense foods to treat pediatric obesity. Obesity (Silver Spring). 2008;16:318–326. [DOI] [PMC free article] [PubMed] [Google Scholar]
- 39.Tompkins KB, Tate DF, Polzien K, et al. Effect of children in the home environment on weight loss and adherence in a behavioral weight loss intervention. Obesity (Silver Spring). 2011;19:S99. [Google Scholar]
- 40.Nezami BT, Jakicic JM, Lang W, Davis K, Tate DF. Examining barriers, physical activity, and weight change among parents and nonparents in a weight loss intervention. Obes Sci Pract. 2020;6:264–271. [DOI] [PMC free article] [PubMed] [Google Scholar]
- 41.Bandura A. Self-efficacy: toward a unifying theory of behavioral change. Advances in Behaviour Research and Therapy. 1978;1:139–161. [Google Scholar]
- 42.von Ruesten A, Illner AK, Buijsse B, Heidemann C, Boeing H. Adherence to recommendations of the German food pyramid and risk of chronic diseases: results from the EPIC-Potsdam study. Eur J Clin Nutr. 2010;64:1251–1259. [DOI] [PubMed] [Google Scholar]
- 43.Moher D, Hopewell S, Schulz KF, et al. CONSORT 2010 explanation and elaboration: updated guidelines for reporting parallel group randomised trials. Int J Surg. 2012;10:28–55. [DOI] [PubMed] [Google Scholar]
- 44.Duncan M, Fenton S, Brown W, et al. Efficacy of a multi-component m-Health weight-loss intervention in overweight and obese adults: a randomised controlled trial. Int J Environ Res Public Health. 2020:17:6200. doi: 10.3390/ijerph17176200 [DOI] [PMC free article] [PubMed] [Google Scholar]
- 45.Patel ML, Hopkins CM, Brooks TL, Bennett GG. Comparing self-monitoring strategies for weight loss in a smartphone app: randomized controlled trial. JMIR Mhealth Uhealth. 2019;7:e12209. doi: 10.2196/12209 [DOI] [PMC free article] [PubMed] [Google Scholar]