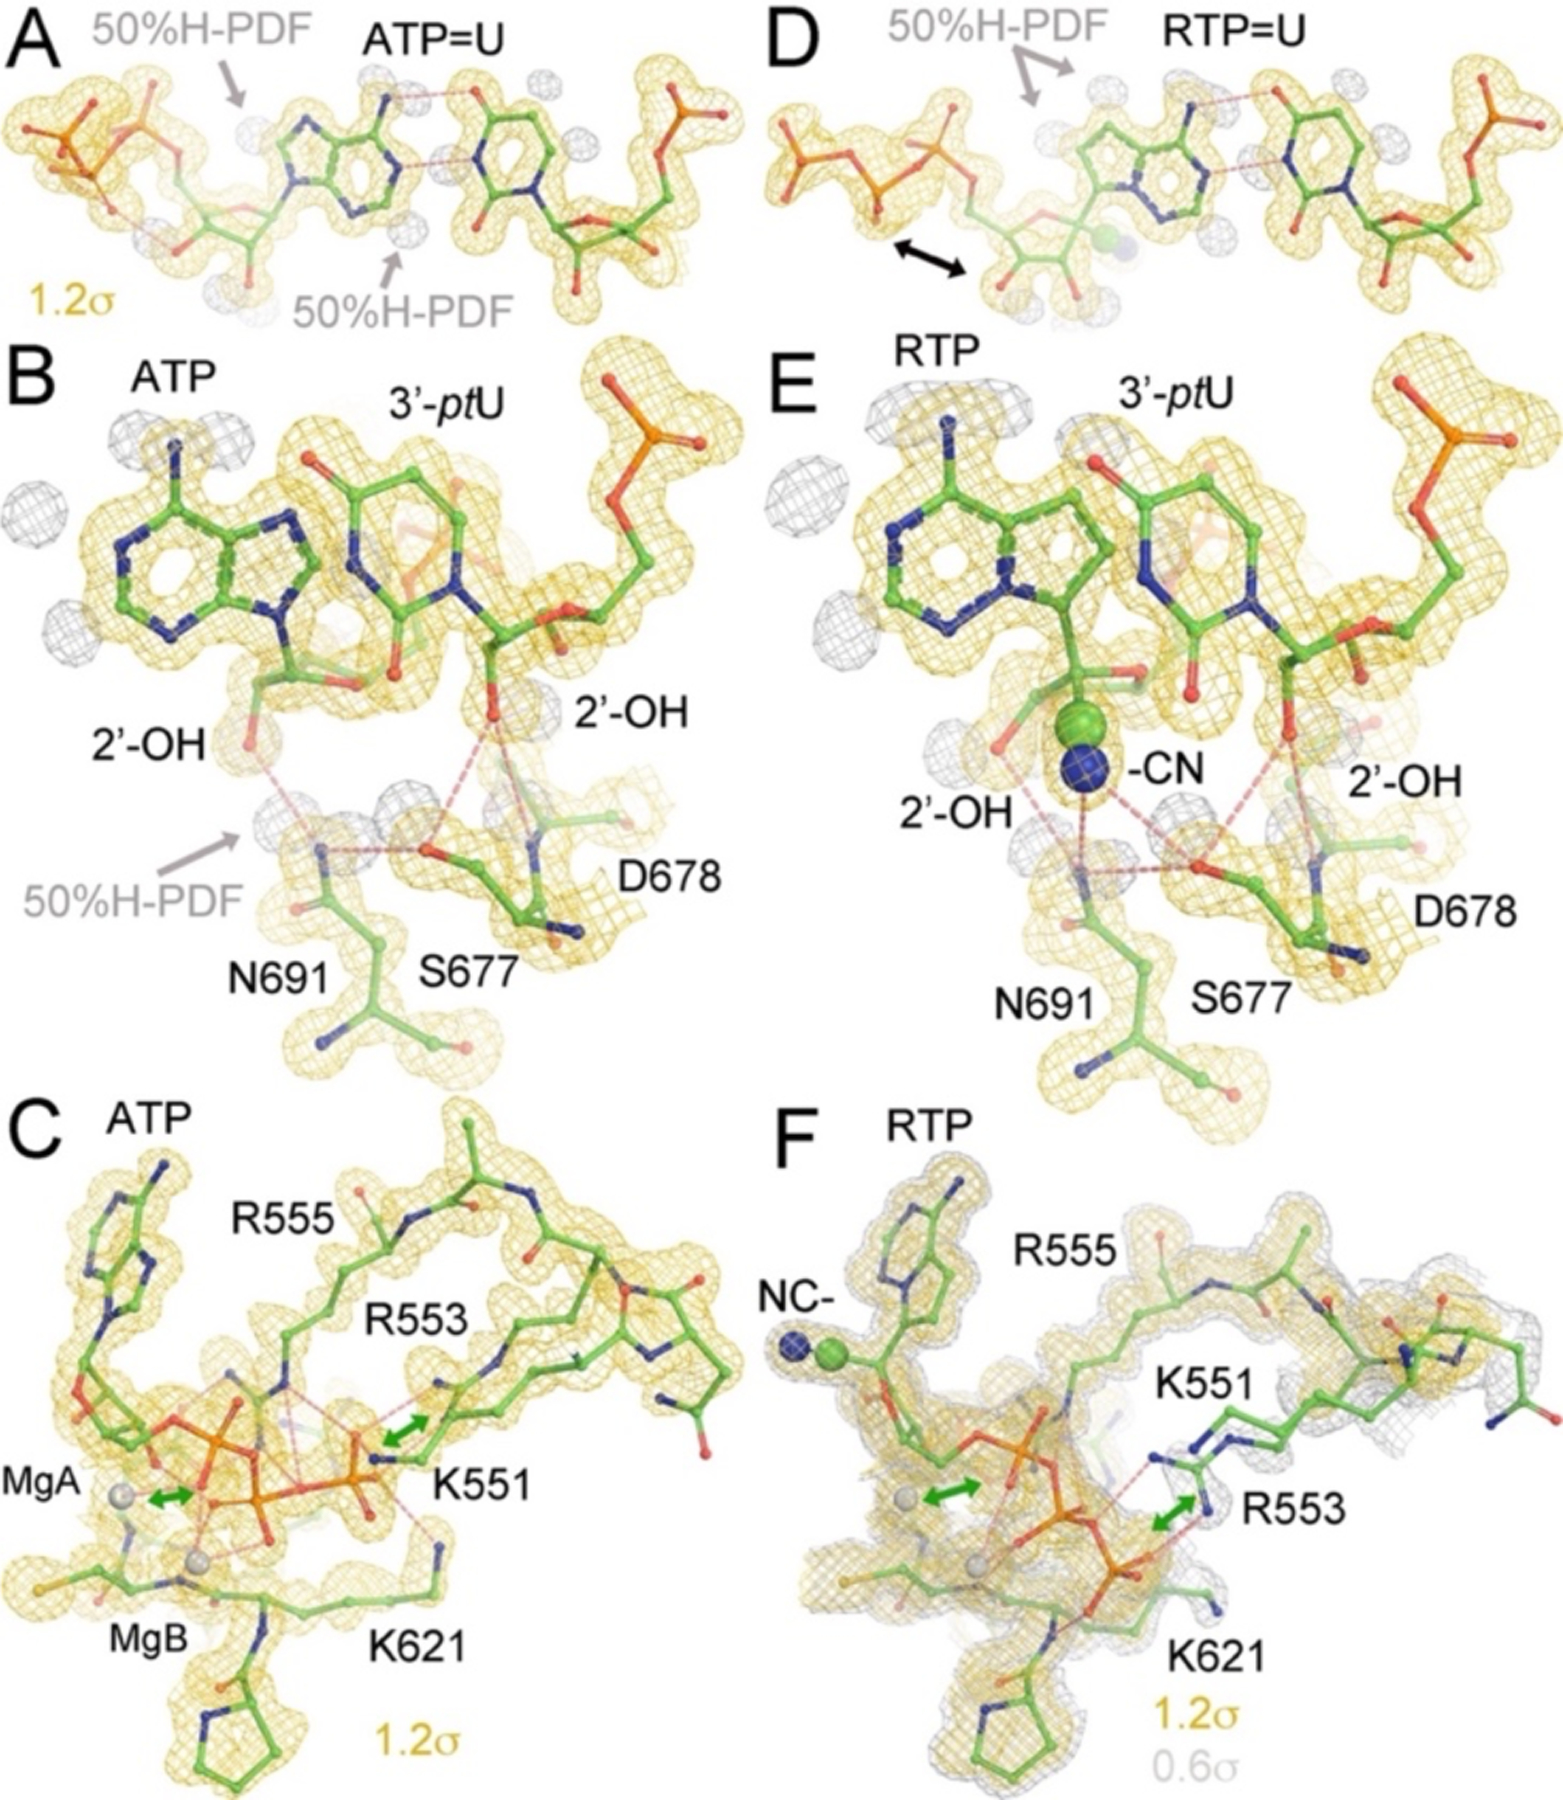
Figure 4.

HB patterns for recognition of 2’-OH and cyano groups in (A-C) ATP and (D-F) RTP complexes, respectively. MD-ED maps are contoured at a low (+0.6σ, silver, in F) and a high levels (+1.2σ, gold, all panels). H atom probability density function (PDF) maps are contoured at about 50% probability.
