PURPOSE
Identifying older patients with GI malignancies who are at increased risk of mortality remains challenging. The goal of our study was to examine geriatric assessment (GA) predictors of 1-year mortality and explore the use of a survival tree analysis in a prospective cohort of older adults (≥ 60 years) with newly diagnosed GI malignancies.
METHODS
Survival tree analysis was performed to understand variable interactions and identify predictors of overall survival, computed from time of GA to death or last follow-up. Cox regression was used to estimate associations of 1-year mortality, first using a base model (age, race, cancer stage, cancer risk group, and planned chemotherapy), then using all significant predictors from the univariable analyses, and finally only those identified in survival tree analysis.
RESULTS
A total of 478 participants met eligibility, with a mean age of 70 years. The survival tree analysis identified nutrition, cancer stage, physical and emotional health, age, and functional status as predictors of mortality. Older patients without malnutrition or depression had the best 1-year survival, whereas those with malnutrition, stage IV disease, and functional limitations had the worst 1-year survival. Our base model demonstrated good discrimination (area under curve [AUC] 0.76) but was improved with the addition of GA variables (AUC 0.82) or from survival tree analysis (AUC 0.82).
CONCLUSION
Measures of function, nutrition, and mental health are important predictors of mortality in older adults with GI cancers. Using GA as part of clinical management can aid in the prediction of survival and help inform treatment decision making.
INTRODUCTION
Cancer is predominantly a disease of aging; by the year 2030, nearly 70% of all new cancer diagnoses will be in older adults (≥ age 60 years).1 Predicting outcomes, such as mortality, is critical to decision making when developing personalized cancer treatment plans for older adults to avoid overtreatment or undertreatment. This is particularly true for more aggressive cancers such as GI malignancies that frequently have a limited life expectancy. However, decision making is complicated by the high prevalence of comorbid conditions and age-related impairments.2,3 Age and performance status alone are insufficient in explaining the heterogeneity of aging evident in older adults with cancer.4,5 A geriatric assessment (GA) systematically examines multiple domains of aging-related health, and is recommended in the routine management of all older adults with cancer.6,7 However, a recent survey of oncology providers found that only 20% used GA in clinical practice, and barriers, particularly lack of time and staff, remain an obstacle to routine use.8 Thus, understanding which components of a GA are most associated with early mortality is necessary to develop streamlined measures to deploy in routine clinical care without disrupting workflow. Prior studies examining predictors of mortality in older adults with cancer have used traditional regression models and lack comprehensive assessment of how these predictors interact. Survival tree analysis is a machine learning approach that is a popular alternative to Cox regression models giving greater flexibility and facilitating detection of interactions between predictors.9 Given the health complexity of older adults with cancer and the potential for interactions between variables within GAs, the use of survival tree analysis is an ideal method to provide a more in-depth understanding of predictors of survival.
CONTEXT
Key Objective
What geriatric assessment factors predict 1-year mortality in older adults with GI malignancies and how do they interact?
Knowledge Generated
Using a survival tree analysis, we found measure of function, nutrition, and mental health are strong predictors of 1-year mortality. Older adults with malnutrition, stage IV disease, and impairments in instrumental activities of daily living had the worst 1-year survival.
Relevance
Performing a geriatric assessment as part of clinical management can aid in the prediction of 1-year survival and help inform treatment decision making among older adults with GI malignancies.
The goal of our study was to identify components of GA at cancer diagnosis that were associated with 1-year mortality in a prospective cohort of older adults with GI malignancies, using survival trees with Cox regression to identify clinically meaningful predictors and patient subgroups.
METHODS
Study Population
Participants were selected from the Cancer and Aging Resilience Evaluation (CARE) Registry initiated at the University of Alabama at Birmingham (UAB) in September 2017. The CARE Registry is an ongoing, prospective registry enrolling older adults with cancer with a specific focus on GI malignancies. Older adults (≥ age 60 years) with a GI malignancy seen for consultation at UAB complete a self-reported GA tool as part of routine clinical care.10 Patients are approached for consent to have their results stored in the CARE Registry. Age ≥ 60 years was chosen as eligibility, given the uncertainty of the appropriate age cutoff for older patients and because of the poor correlation of age and impairments in GA.5 The UAB Institutional Review Board reviewed and approved this study (institutional review board-300000092).
For this analysis, we included all patients enrolled from September 2017 through December 2020 diagnosed with a GI malignancy who had provided information on GA from 3 months before to 6 months after cancer diagnosis and were successfully linked to mortality follow-up. All participants in this report had provided written informed consent.
Geriatric Assessment
The CARE tool is a patient-reported GA tool modified from the original Cancer and Aging Research Group GA.11-13 The CARE tool includes several validated measures that assess physical function, falls, functional status (instrumental activities of daily living [IADL] and activities of daily living [ADL]), nutrition, patient-reported performance status, social support, social activities, anxiety, depression, cognitive complaints, comorbid conditions, and polypharmacy (Data Supplement).10,14 The CARE tool also includes the Patient-Reported Outcomes Measurement Information System 10 global as a measure of health-related quality of life (HRQoL). The PROMIS 10 global includes physical and mental health subscales.15,16
Survival Outcomes
The primary outcome of interest was all-cause mortality at the 1-year time point from date of GA. Vital status was updated to December 28, 2020, by linking the cohort to Accurint database,17 which uses death information from Social Security Administration records, obituaries, and state death records; we supplemented this information from medical records.
Covariates
Demographic and clinical characteristics were abstracted from medical records, and included date of birth, sex, cancer type, cancer stage, date of diagnosis, and planned systemic therapy. Race, ethnicity, education level, marital status, and employment were obtained by self-report as part of the CARE tool. Participants were grouped into high-risk (pancreatic, hepatobiliary, and esophageal cancers) and low-risk (colorectal, GI stromal tumors, neuroendocrine tumors, and other) cancers on the basis of estimated survival.18 We created a yes/no systemic chemotherapy variable to account, in part, for differences in cancer treatment.
Statistical Analyses
Descriptive statistics were used to characterize the population. For this analysis of predictors of 1-year mortality, we used continuous variables rather than using dichotomized cutoffs when possible. The physical and mental HRQoL subscores were converted to T-scores with a standardized mean score of 50 and a standard deviation of 10. Overall survival was defined as the time from GA to death within 1 year and was censored at 1 year (or date of last follow-up if < 1 year). We constructed unadjusted Cox proportional hazards models to identify variables significantly associated with 1-year overall survival. Then we used a survival tree analysis with the same survival outcome (using R statistical software). A survival tree is a machine-learning alternative to Cox models that groups subjects according to their survival time and covariates, which can automatically detect complex interactions without prespecification.9 All GA variables were included for consideration by the survival tree (as continuous variables) as well as clinical demographic and cancer variables, although not all variables were included in the final tree by the algorithm. The survival tree was used to identify interactions and classifications from within the predictors and to identify which variables and groups of patients were the most important for predicting 1-year mortality. The clusters identified from the survival tree were then examined in a Cox regression model using a Kaplan-Meier curve to compare the survival of each cluster. Next, we developed a base predictive model using Cox regression that included age (continuous), cancer risk group (high v low), cancer stage (0-II, III, and IV), and planned chemotherapy treatment (yes/no). These base model covariates were chosen a priori on the basis of the literature and clinical judgment as known predictors of survival. Then we created a full Cox model that included all significant variables with entry criteria of P ≤ .05 from the unadjusted analyses. Finally, we created a parsimonious model that only included those variables identified in the survival tree analysis. Model fit and performance was evaluated using time-dependent receiver operating characteristic curves with reporting of area under the curve (AUC) at the 1-year time point.19 All hypothesis testing was two-sided, and the level of the significance was set at .05. We conducted statistical analysis using SAS statistical software version 9.4 (SAS Institute Inc, Cary, NC) and R Studio statistical software (version R 4.1.1; packages rpart, rpart.plot, and survival).
RESULTS
Study Population and Survival
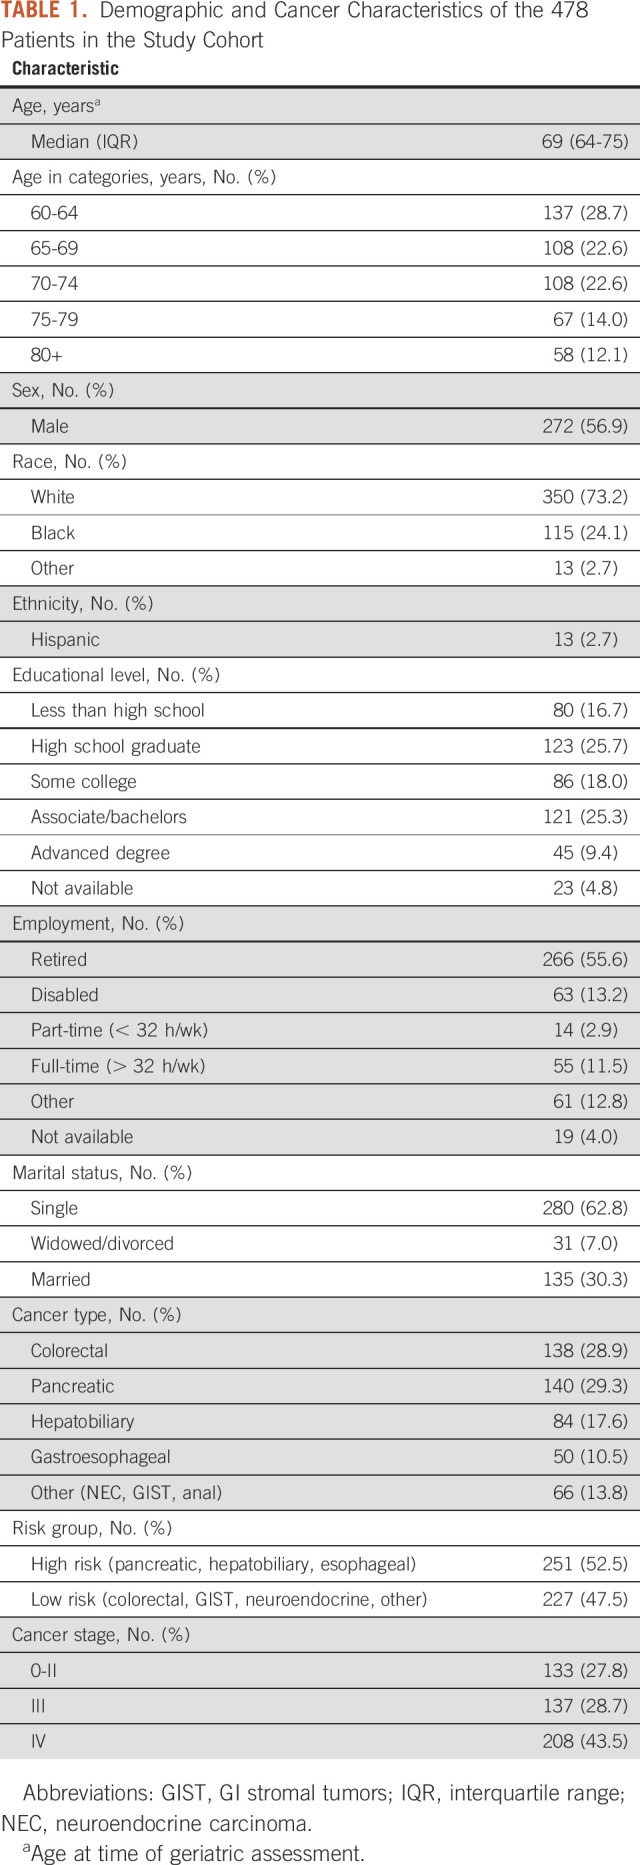
Of the 865 participants within the CARE Registry with a GI malignancy, 732 consented to the study and 725 were successfully linked to mortality. Of these 725 patients, 478 (65.9%) completed the GA within the predefined period (Data Supplement). In a comparison of baseline characteristics between study participants and nonparticipants, nonparticipants were more likely to have pancreatic and hepatobiliary cancer and less likely to have stage 0-II cancers (Data Supplement). The median age at GA was 69 years (interquartile range, 64-75 years; Table 1). The majority of participants were male (56.9%) and White (73.2%). Most common cancer types included pancreatic cancer (n = 140; 29.3%), colorectal cancer (n = 138; 28.9%), and hepatobiliary cancer (n = 84; 17.6%); 52.5% had high-risk tumors. Most participants had advanced-stage malignancy (stage III/IV: 72.2%). The cohort was followed for a median of 15.7 months, with an overall survival at 1 year of 71.7%.
TABLE 1.
Demographic and Cancer Characteristics of the 478 Patients in the Study Cohort
Variables Associated With 1-Year Overall Survival
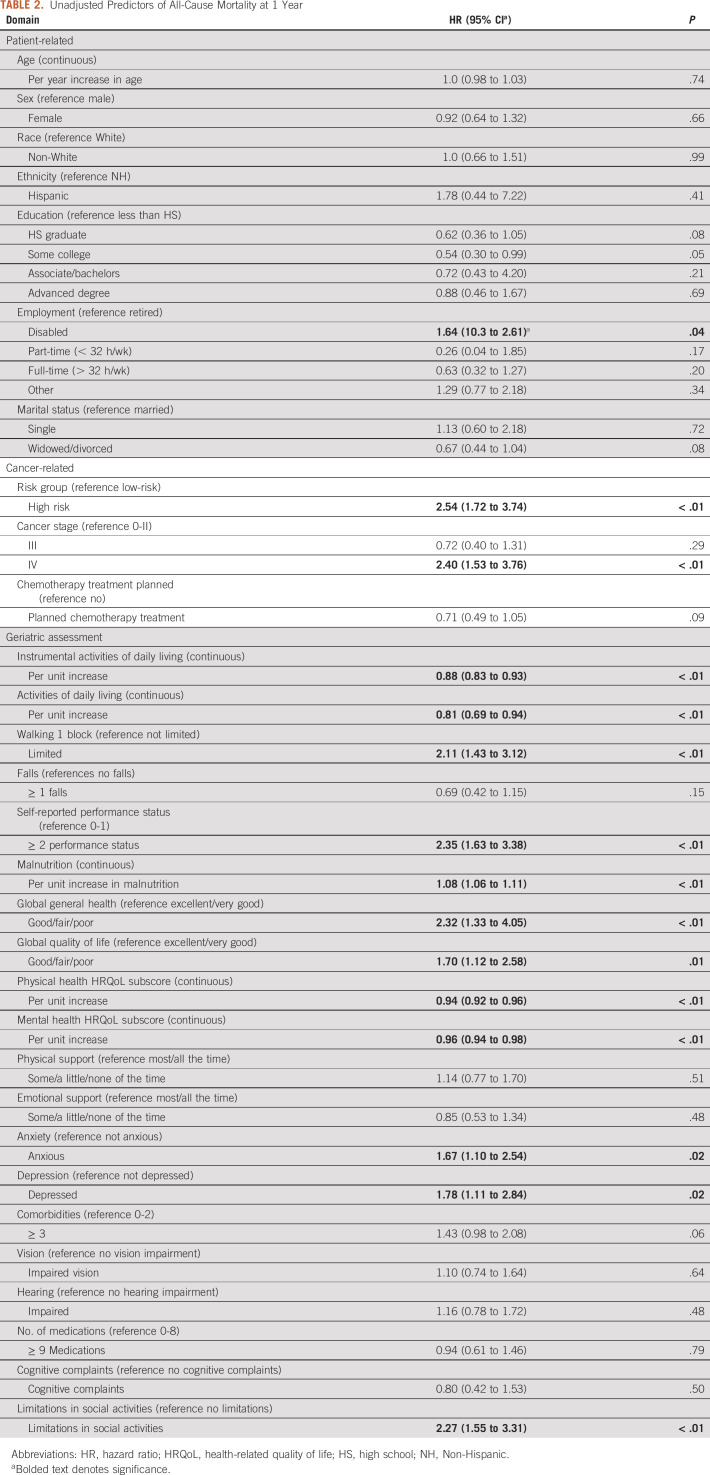
Unadjusted analysis revealed the following variables to be associated with a higher hazard of all-cause mortality at 1 year: disabled employment status (hazard ratio [HR, 1.64; 95% CI, 10.3 to 2.61; reference: retired), high-risk group (HR, 2.54; 95% CI, 1.72 to 3.74; reference low-risk), and stage IV cancer stage (HR, 2.40; 95% CI, 1.53 to 3.76; reference stage 0-II; Table 2). There was no significant association between age, sex, race/ethnicity, and mortality. The majority of GA measures were associated with 1-year mortality in unadjusted analyses. In particular, measures of function (IADL, ADL, falls, and ability to walk one block), malnutrition, HRQoL (global quality of life and physical/mental subscores), mental health (anxiety and depression), and social activities (Table 2) were associated with all-cause mortality at 1 year. Social support, ≥ 3 comorbidities, vision/hearing impairments, polypharmacy, and cognitive complaints were not associated with 1-year mortality.
TABLE 2.
Unadjusted Predictors of All-Cause Mortality at 1 Year
Survival Tree Analysis
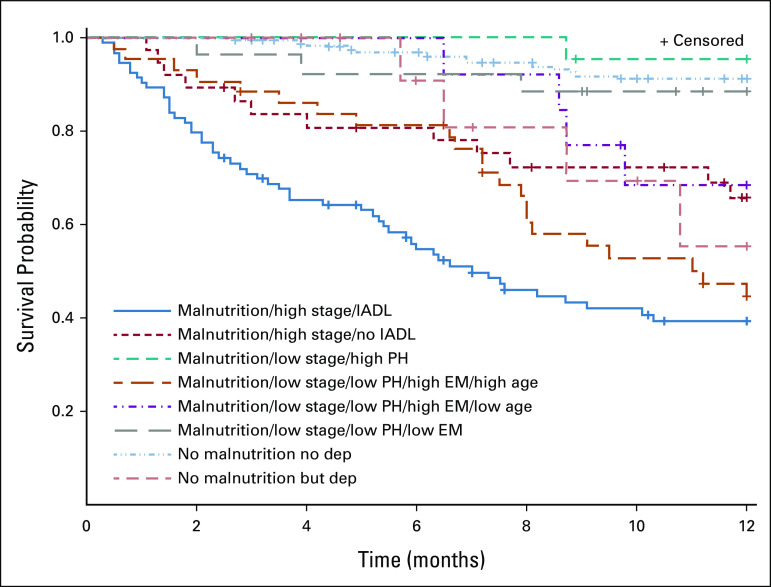
Using a survival tree method, the first split was identified for the nutrition score (< 5 [normal nutrition] v ≥ 5 [malnourished]), separating a group of 301 participants who were malnourished from the 177 with normal nutrition (Fig 1). The participants with normal nutrition were split between those with more versus less depressive symptoms. The 301 participants with malnutrition were split between those with cancer stage 0-III (n = 160) versus stage IV (n = 141). Those with stage IV disease were then further divided by whether participants had an IADL limitation. Those with stage 0-III disease were further split by their physical HRQoL subscore (< 49 v ≥ 49), mental HRQoL subscore (< 49 v ≥ 49), and age (< 67 v ≥ 67). The final survival tree resulted in eight different groups (Fig 1). Overall, the largest group that had the best 1-year survival consisted of those with normal nutrition and no depressive symptoms (Table 3 and Fig 2). The group with malnutrition, stage IV cancer, and IADL limitations had the worst survival (HR, 11.4; 95% CI, 6.2 to 21.0).
FIG 1.
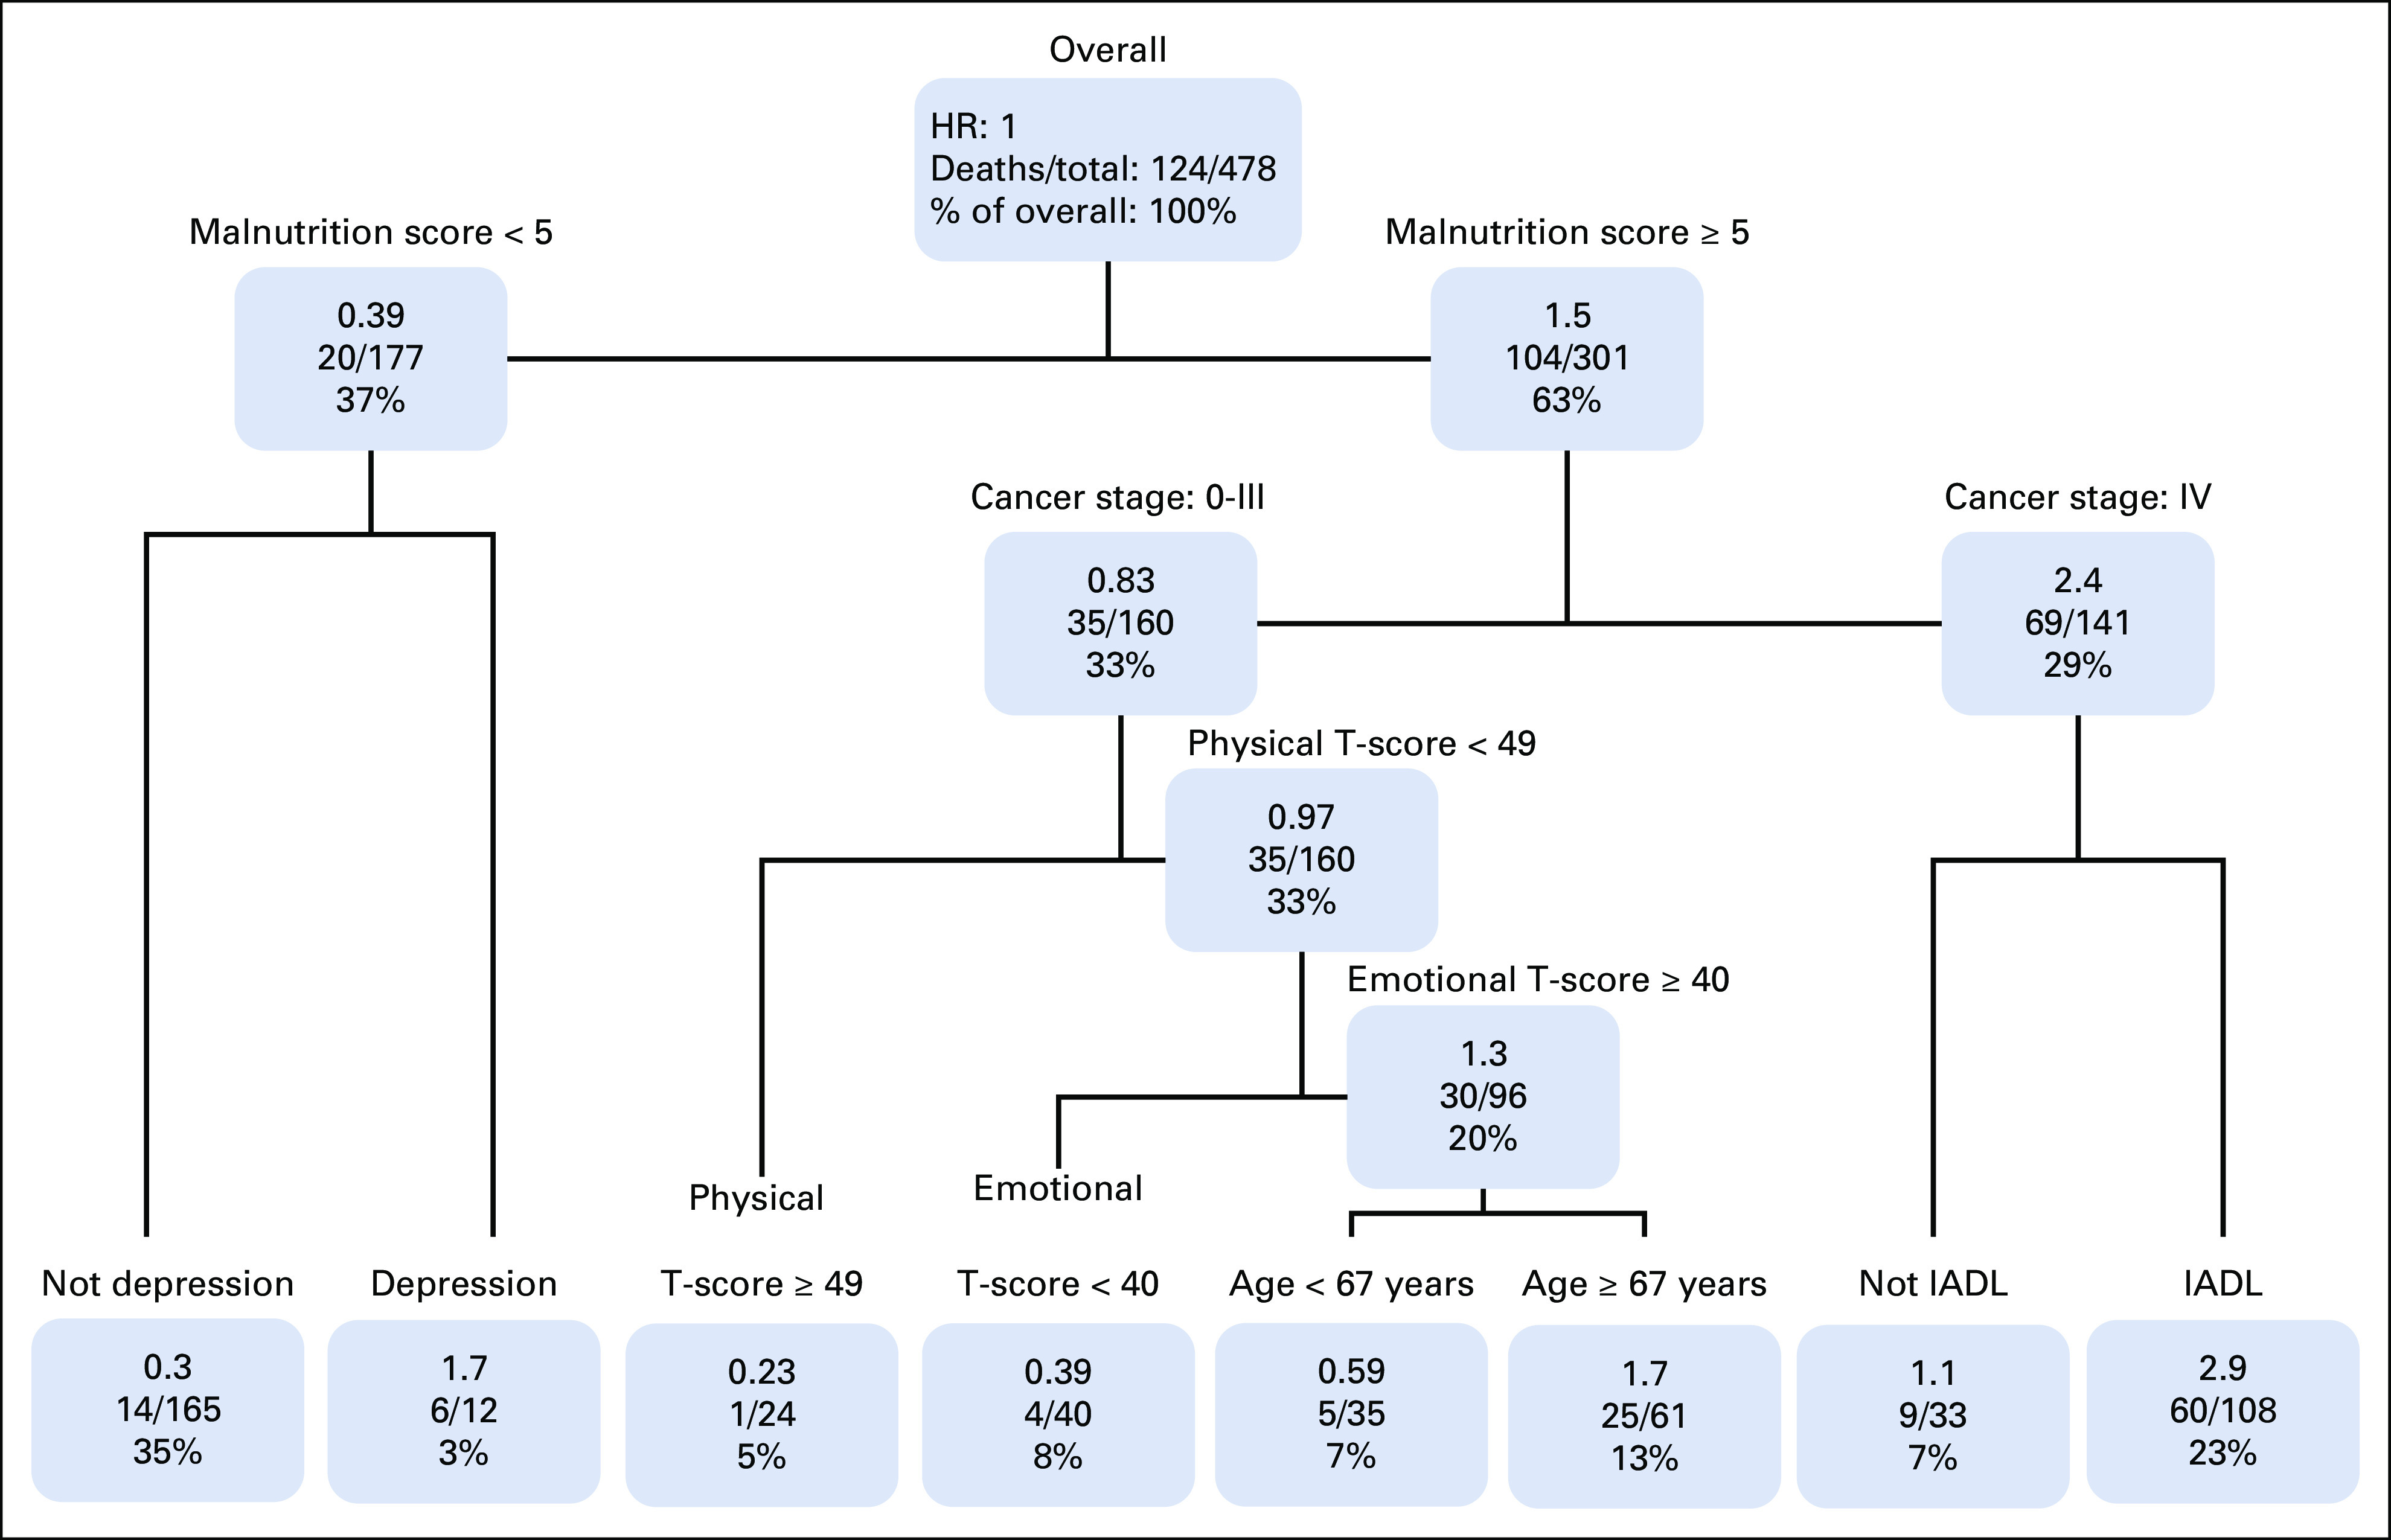
Survival tree analyses. HR, hazard ratio; IADL, instrumental activity of daily living.
TABLE 3.
Cox Model of Survival Tree Clusters (area under curve = 0.81)
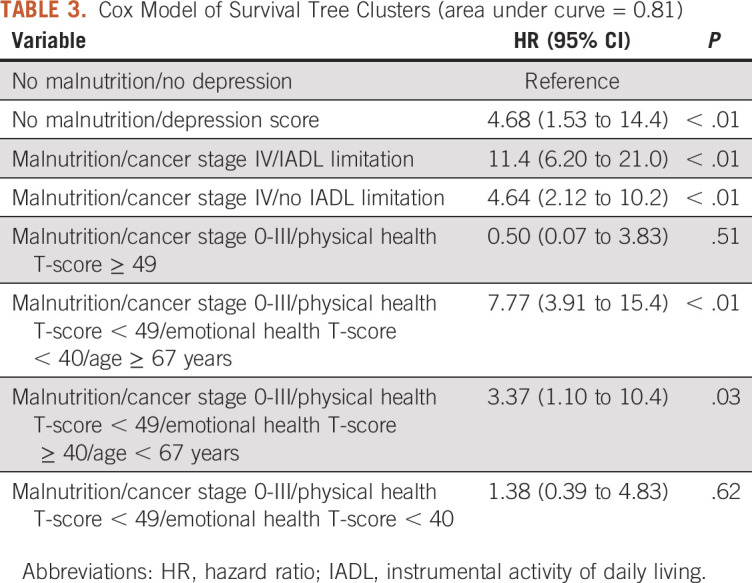
FIG 2.
Kaplan-Meier curve of survival tree clusters depicting product-limit survival estimates: the group with the worst survival had malnutrition, stage IV disease, and impairments in IADLs (denoted by solid blue line). The groups with the best survival consisted of those with normal nutrition and no depressive symptoms (the dashed light blue line) and those with malnutrition, stage I-III disease, and high physical health scores (the dashed teal line). dep, depression; EM, emotional health; high stage, stage IV disease; IADL, instrumental activities of daily living; low stage, I-III; PH, physical health.
Multivariate Models
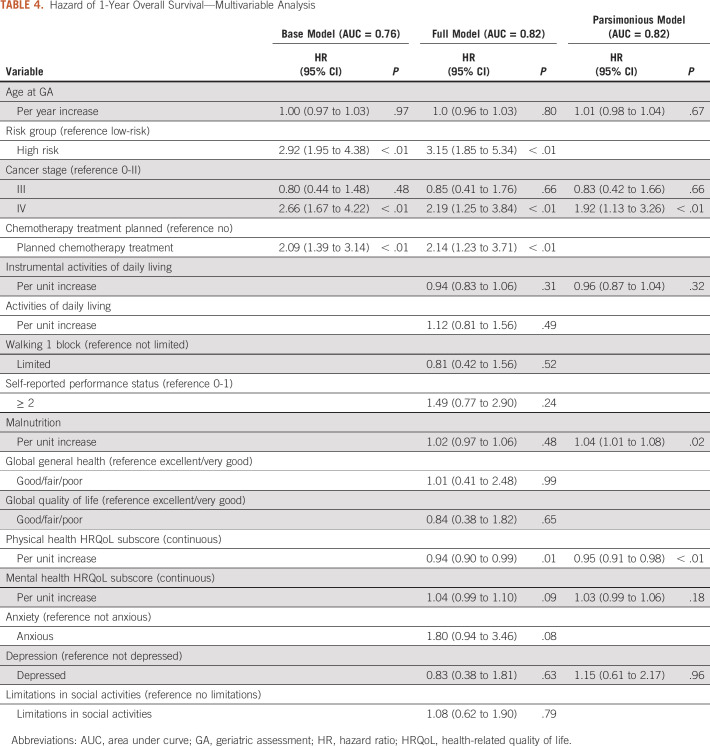
The base model using Cox regression that included age, risk group, cancer stage, and planned chemotherapy treatment had an AUC of 0.76 (Table 4). Upon adding significant predictors with P ≤ .05 from the univariable analyses, the AUC increased to 0.82. Finally, we created a parsimonious model that included only factors identified in the survival tree analysis, which included age, cancer stage, IADLs, malnutrition, physical and mental HRQoL, and depression, that yielded an identical AUC of 0.82.
TABLE 4.
Hazard of 1-Year Overall Survival—Multivariable Analysis
DISCUSSION
The results from our study indicate that incorporating elements from a patient-reported GA improves survival prognostication in older adults with GI malignancies. Our survival tree analysis indicated that specific GA domains, particularly malnutrition, depression, and physical and mental health, could aid in the classification of mortality risk beyond cancer stage and chronologic age alone. Such results can be helpful in personalizing cancer care decision making and potentially target palliative and end-of-life resources.
Although several studies have examined predictors of 1-year mortality in older adults with cancer, few have specifically examined predictors of mortality in older adults with GI malignancies. A large study by the ELPACA study group found that GA measures were significant predictors of survival, and limitations in ADLs, malnutrition, and severe comorbidities were the strongest predictors, but only about one third of the study population had a GI malignancy.20 Similarly, in a secondary analysis of the COACH study, GA improved calibration of prognostic models beyond performance status and clinical demographic variables.21 In another study that examined risk of early death (within 100 days) in older adults, slow gait speed and malnutrition were both independent predictors.22 A recent analysis by Nishijima et al23 developed a three-item prognostic scale consisting of the most prognostic elements of a GA, including limitations in walking, shopping, and weight loss. Importantly and similar to our own study, GA measures routinely aid in mortality prediction, and measures of nutrition, function, and physical activity appear most predictive. Our results further confirm the importance of GA data in predicting mortality specifically among older adults with GI malignancies, and demonstrate that a completely patient-reported GA (ie, the CARE tool) is able to predict mortality.
This study is one of the first to use a survival tree analysis in an older adult population with cancer. Using traditional regression models often leads to models that are difficult to interpret because of the large number of variables typically included in GAs. Survival trees naturally group participants according to their length of survival on the basis of covariate patterns. Using a survival tree analytic approach has the advantage of evaluating interactions within the GA measures, which is particularly important, given the complexities involved in older adults. The survival tree identified eight different groups delineated by age, cancer stage, and GA scores on the nutrition, depression, physical/mental health, and limitations in IADL. In particular, those with advanced cancer stage, malnutrition, and IADL limitations had the worst 1-year overall survival. Using just the variables identified from the survival tree analysis in Cox regression showed nearly identical results as the full model. Further exploration and validation of this approach to survival in older adults is warranted.
This study is not without limitations. Our study consists of older adults with GI malignancies from a single site from the Deep South and may not be representative of other cancer populations and/or geographic areas. Externally validating our model in other populations and/or regions is warranted. Although we limited our sample to GI malignancies alone, the cancer types were heterogeneous with regards to survival and therapeutic treatments. Future work is needed to evaluate predictors of survival in individual cancer types, which include cancer-specific prognostic parameters (such as microsatellite instability status and BRAF mutations in colorectal cancer). In addition, we used all-cause mortality and do not have cancer-specific survival nor causes of death. Our study sample had a large proportion of Black participants, but had a noticeable lack of Asian and Hispanic patients. Although a high proportion of the eligible population enrolled in the CARE Registry, there remains some potential selection bias. In our comparison of participants versus nonparticipants, nonparticipants had slightly higher prevalence of more aggressive tumors (pancreatic and hepatobiliary cancers) and more advanced cancer stage. Finally, although we did account for whether systemic chemotherapy was given, we did not have granular details regarding the intensity, duration, and/or number of lines pursued.
In conclusion, the use of a GA in the management of older adults with GI malignancies can aid in the prediction of survival and therefore help inform and personalize treatment decision making. Future work to develop a pragmatic survival prediction tool, similar to the Cancer and Aging Research Group toxicity calculator that can be integrated into the oncology clinic and assist with decision making, is needed. In addition, refining mortality prediction within specific cancer subgroups (i.e. colorectal cancer, pancreatic cancer, etc) may improve the discrimination and clinical utility of such tools.
Grant R. Williams
Honoraria: Cardinal Health
Smith Giri
Honoraria: CareVive, OncLive, Sanofi
Research Funding: CareVive Systems, Pack Health, Sanofi (Inst)
Andrew McDonald
Consulting or Advisory Role: Varian Medical Systems
Research Funding: Varian Medical Systems (Inst), Collegium (Inst)
Olumide Gbolahan
Stock and Other Ownership Interests: Pfizer
Consulting or Advisory Role: Merck Sharp & Dohme, Exelixis, Incyte, QED Therapeutics
Speaker's Bureau: OncLive/MJH Life Sciences
Research Funding: AstraZeneca/MedImmune (Inst)
Darryl Outlaw
Honoraria: OncLive/MJH Life Sciences
Moh'd Khushman
Stock and Other Ownership Interests: Halozyme, Guardant Health, Aprea Therapeutics, Blueprint Medicines, Daiichi Sankyo, Global Blood Therapeutics, Cardiff Oncology, Moderna Therapeutics, Regeneron
Consulting or Advisory Role: AstraZeneca, Taiho Pharmaceutical, Bayer
Speaker's Bureau: AstraZeneca, Pfizer
No other potential conflicts of interest were reported.
DISCLAIMER
The content is solely the responsibility of the authors and does not necessarily represent the official views of the National Institutes of Health.
PRIOR PRESENTATION
Presented at the ASCO 2021 annual meeting, June 4-8, 2021, virtual.
SUPPORT
Supported in part by the National Cancer Institute of the National Institutes of Health (K08CA234225) and the Doris Duke Charitable Foundation CARES program at UAB.
AUTHOR CONTRIBUTIONS
Conception and design: Grant R. Williams, Smith Giri, Andrew McDonald, Smita Bhatia
Financial support: Grant R. Williams
Administrative support: Grant R. Williams, Smita Bhatia
Provision of study materials or patients: Grant R. Williams, Moh'd Khushman
Collection and assembly of data: Grant R. Williams, Smith Giri, Mustafa Al-Obaidi, Christian Harmon, Olumide Gbolahan
Data analysis and interpretation: Grant R. Williams, Chen Dai, Smith Giri, Kelly M. Kenzik, Andrew McDonald, Darryl Outlaw, Moh'd Khushman, Joshua Richman
Manuscript writing: All authors
Final approval of manuscript: All authors
Accountable for all aspects of the work: All authors
AUTHORS' DISCLOSURES OF POTENTIAL CONFLICTS OF INTEREST
The following represents disclosure information provided by authors of this manuscript. All relationships are considered compensated unless otherwise noted. Relationships are self-held unless noted. I = Immediate Family Member, Inst = My Institution. Relationships may not relate to the subject matter of this manuscript. For more information about ASCO's conflict of interest policy, please refer to www.asco.org/rwc or ascopubs.org/cci/author-center.
Open Payments is a public database containing information reported by companies about payments made to US-licensed physicians (Open Payments).
Grant R. Williams
Honoraria: Cardinal Health
Smith Giri
Honoraria: CareVive, OncLive, Sanofi
Research Funding: CareVive Systems, Pack Health, Sanofi (Inst)
Andrew McDonald
Consulting or Advisory Role: Varian Medical Systems
Research Funding: Varian Medical Systems (Inst), Collegium (Inst)
Olumide Gbolahan
Stock and Other Ownership Interests: Pfizer
Consulting or Advisory Role: Merck Sharp & Dohme, Exelixis, Incyte, QED Therapeutics
Speaker's Bureau: OncLive/MJH Life Sciences
Research Funding: AstraZeneca/MedImmune (Inst)
Darryl Outlaw
Honoraria: OncLive/MJH Life Sciences
Moh'd Khushman
Stock and Other Ownership Interests: Halozyme, Guardant Health, Aprea Therapeutics, Blueprint Medicines, Daiichi Sankyo, Global Blood Therapeutics, Cardiff Oncology, Moderna Therapeutics, Regeneron
Consulting or Advisory Role: AstraZeneca, Taiho Pharmaceutical, Bayer
Speaker's Bureau: AstraZeneca, Pfizer
No other potential conflicts of interest were reported.
REFERENCES
- 1.Smith BD, Smith GL, Hurria A, et al. : Future of cancer incidence in the United States: Burdens upon an aging, changing nation. J Clin Oncol 27:2758-2765, 2009 [DOI] [PubMed] [Google Scholar]
- 2.DuMontier C, Loh KP, Bain PA, et al. : Defining undertreatment and overtreatment in older adults with cancer: A scoping literature review. J Clin Oncol 38:2558-2569, 2020 [DOI] [PMC free article] [PubMed] [Google Scholar]
- 3.DuMontier C, Sedrak MS, Soo WK, et al. : Arti Hurria and the progress in integrating the geriatric assessment into oncology: Young International Society of Geriatric Oncology review paper. J Geriatr Oncol 11:203-211, 2020 [DOI] [PMC free article] [PubMed] [Google Scholar]
- 4.Jolly TA, Deal AM, Nyrop KA, et al. : Geriatric assessment-identified deficits in older cancer patients with normal performance status. Oncologist 20:379-385, 2015 [DOI] [PMC free article] [PubMed] [Google Scholar]
- 5.Giri S, Al-Obaidi M, Weaver A, et al. : Association between chronologic age and geriatric assessment-identified impairments: Findings from the CARE registry. J Natl Compr Cancer Netw 19:922-927, 2021 [DOI] [PMC free article] [PubMed] [Google Scholar]
- 6.Mohile SG, Dale W, Somerfield MR, et al. : Practical assessment and management of vulnerabilities in older patients receiving chemotherapy: ASCO guideline for geriatric oncology. J Clin Oncol 36:2326-2347, 2018 [DOI] [PMC free article] [PubMed] [Google Scholar]
- 7.Dotan E, Walter LC, Browner IS, et al. : NCCN guidelines(R) insights: Older adult oncology, version 1.2021. J Natl Compr Cancer Netw 19:1006-1019, 2021 [DOI] [PubMed] [Google Scholar]
- 8.Dale W, Williams GR, MacKenzie AR, et al. : How is geriatric assessment used in clinical practice for older adults with cancer? A survey of cancer providers by the American Society of Clinical Oncology. JCO Oncol Pract 17:336-344, 2021 [DOI] [PMC free article] [PubMed] [Google Scholar]
- 9.Ramezankhani A, Tohidi M, Azizi F, et al. : Application of survival tree analysis for exploration of potential interactions between predictors of incident chronic kidney disease: A 15-year follow-up study. J Transl Med 15:240, 2017 [DOI] [PMC free article] [PubMed] [Google Scholar]
- 10.Williams GR, Kenzik KM, Parman M, et al. : Integrating geriatric assessment into routine gastrointestinal (GI) consultation: The Cancer and Aging Resilience Evaluation (CARE). J Geriatr Oncol 11:270-273, 2020 [DOI] [PMC free article] [PubMed] [Google Scholar]
- 11.Hurria A, Cirrincione CT, Muss HB, et al. : Implementing a geriatric assessment in cooperative group clinical cancer trials: CALGB 360401. J Clin Oncol 29:1290-1296, 2011 [DOI] [PMC free article] [PubMed] [Google Scholar]
- 12.Hurria A, Gupta S, Zauderer M, et al. : Developing a cancer-specific geriatric assessment: A feasibility study. Cancer 104:1998-2005, 2005 [DOI] [PubMed] [Google Scholar]
- 13.Williams GR, Deal AM, Jolly TA, et al. : Feasibility of geriatric assessment in community oncology clinics. J Geriatr Oncol 5:245-251, 2014 [DOI] [PubMed] [Google Scholar]
- 14.Giri S, Mir N, Al-Obaidi M, et al. : Use of single-item self-rated health measure to identify frailty and geriatric assessment-identified impairments among older adults with cancer. Oncologist 27:e45-e52, 2022 [DOI] [PMC free article] [PubMed] [Google Scholar]
- 15.Hays RD, Bjorner JB, Revicki DA, et al. : Development of physical and mental health summary scores from the patient-reported outcomes measurement information system (PROMIS) global items. Qual Life Res 18:873-880, 2009 [DOI] [PMC free article] [PubMed] [Google Scholar]
- 16.Pergolotti M, Deal AM, Williams GR, et al. : Activities, function, and health-related quality of life (HRQOL) of older adults with cancer. J Geriatr Oncol 8:249-254, 2017 [DOI] [PMC free article] [PubMed] [Google Scholar]
- 17.Accurint. http://www.accurint.com
- 18.Siegel RL, Miller KD, Fuchs HE, et al. : Cancer statistics, 2021. CA Cancer J Clin 71:7-33, 2021 [DOI] [PubMed] [Google Scholar]
- 19.Guo C, So Y, Jang W, et al. : Evaluating predictive accuracy of survival models with PROC PHREG. Paper SAS462-2017. 1-16, 2017. https://tds.sas.com/resources/papers/proceedings17/SAS0462-2017.pdf [Google Scholar]
- 20.Ferrat E, Paillaud E, Laurent M, et al. : Predictors of 1-year mortality in a prospective cohort of elderly patients with cancer. J Gerontol A Biol Sci Med Sci 70:1148-1155, 2015 [DOI] [PubMed] [Google Scholar]
- 21.Lund JL, Duberstein PR, Loh KP, et al. : Life expectancy in older adults with advanced cancer: Evaluation of a geriatric assessment-based prognostic model. J Geriatr Oncol 13:176-181, 2022 [DOI] [PMC free article] [PubMed] [Google Scholar]
- 22.Boulahssass R, Gonfrier S, Ferrero JM, et al. : Predicting early death in older adults with cancer. Eur J Cancer 100:65-74, 2018 [DOI] [PubMed] [Google Scholar]
- 23.Nishijima TF, Deal AM, Lund JL, et al. : The incremental value of a geriatric assessment-derived three-item scale on estimating overall survival in older adults with cancer. J Geriatr Oncol 9:329-336, 2018 [DOI] [PubMed] [Google Scholar]


