

Abstract
Background:
The presence of contaminants in cannabis presents a potential health hazard to recreational users and susceptible patients with medical conditions. Because of the federally illegal status of cannabis, there are no unified regulatory guidelines mitigating the public health risk of cannabis contaminants.
Objective:
To inform further research and provide solutions to the public health risk of cannabis contaminants at a national level, we examined the current landscape of state-level contaminant regulations, and cannabis contaminants of concern, as well as patient populations susceptible to contaminants.
Methods:
We examined the regulatory documents for medical and recreational cannabis in all legalized U.S. jurisdictions and compiled a complete list of regulated contaminants, namely, pesticides, inorganics, solvents, microbes, and mycotoxins. We data mined the compliance testing records of 5,654 cured flower and 3,760 extract samples that accounted for of California’s legal cannabis production in 2020–2021. We also reviewed the publicly available medical cannabis use reports to tabulate the susceptible patient populations.
Results:
As of 18 May 2022, 36 states and the District of Columbia listed a total of 679 cannabis contaminants as regulated in medical or recreational cannabis, including 551 pesticides, 74 solvents, 12 inorganics, 21 microbes, 5 mycotoxins, and 16 other contaminants. Different jurisdictions showed significant variations in regulated contaminants and action levels ranging up to four orders of magnitude. A failure rate of 2.3% was identified for flowers and 9.2% for extracts in the California samples. Insecticides and fungicides were the most prevalent categories of detected contaminants, with boscalid and chlorpyrifos being the most common. The contaminant concentrations fell below the regulatory action levels in many legalized jurisdictions, indicating a higher risk of contaminant exposure. Cannabis use reports indicated usage in several patient populations susceptible to contamination toxicity, including cancer (44,318) and seizure (21,195) patients.
Discussion:
Although individual jurisdictions can implement their policies and regulations for legalized cannabis, this study demonstrates the urgent need to mitigate the public health risk of cannabis contamination by introducing national-level guidelines based on conventional risk assessment methodologies and knowledge of patients’ susceptibility in medical use. https://doi.org/10.1289/EHP11206
Introduction
The broader use and state-level legalization of cannabis have gained significant public interest and support in recent years. Approximately half of all U.S. adults have reported that they have used cannabis at least once in their lives, with nearly reporting using cannabis within the past year.1,2 In 2017, the U.S. legal cannabis market was valued at .1 It is projected to be worth in 2026.1 In addition to the economic benefits, cannabis legalization has been proposed to reduce the racial disparity in drug arrests.3 Further, there is a cultural transition in the public perception and acceptance of using cannabis as a self-administered therapeutic.4 Some patients are now considering medical cannabis as a substitute for prescription drugs.5 With the change in government policy regarding cannabis use, the public perceptions of the impact of cannabis on health has become more favorable, especially on mental health.6 Because of these factors and changes in public opinion, the federal legalization of cannabis is now being considered by the U.S. Congress.7
Although public interest focuses mainly on the socioeconomic impact and medical benefits of legalized cannabis,4,8 little attention has been paid to its implications in chemical exposure and consumer safety. Like other agricultural commodities, cannabis is prone to contamination by pesticides, metals, microbes, and mycotoxins.9–14 In addition, solvent residues are an increasing concern for cannabis extracts.15,16 The presence of these contaminants presents a potential health hazard not only to regular cannabis users and the general public but also to people with specific health conditions that make them susceptible to harmful contaminants.10,17 Immunocompromised patients with cancer and the human immunodeficiency virus (HIV),18 women of reproductive age,19 and patients with seizures and epilepsy20 are among those who are more susceptible to the health hazards of pesticide and microbial contaminants.21
At the federal level, cannabis is still listed as an illegal Schedule I substance.22 This limits the efforts of several federal agencies in assessing and mitigating the public health risk of cannabis contamination in the United States. Currently, cannabis is neither federally regulated as an agricultural, food, nor pharmaceutical commodity. The U.S. Environmental Protection Agency (U.S. EPA) has registered only 59 biopesticides and 1 conventional pesticide for hemp, but no pesticides for cannabis.23 The U.S. Department of Agriculture (USDA) does not monitor the pesticide residue levels in cannabis—which is federally illegal to grow—as it does in other agricultural commodities.24 In addition, because medical cannabis is not approved by the U.S. Food and Drug Administration (FDA) as a drug, there is no federal requirement for its safety compliance.22 As a result, individual jurisdictions in the United States where cannabis has been legalized must implement their policies and regulations for cannabis contaminants.25 This is similar to the state and local policies concerning facemask and vaccination mandates to prevent the spread of COVID-19,26 where inconsistent policies on a jurisdiction-by-jurisdiction basis have resulted in poor public health outcomes in certain jurisdictions.27
This study aims to examine the current landscape of state-level contaminant regulations for cannabis. It consists of three aspects: a) reviewing the regulations, b) examining contaminant load in cannabis samples, and c) reviewing the publicly available medical cannabis use reports in legalized jurisdictions. First, we compared the action levels and contaminant coverage of regulations in different legalized jurisdictions. Second, we data mined the compliance testing records of cannabis produced in California—the largest legal cannabis market in the United States—and examined the contaminated cannabis outbreaks and recalls across the United States reported in media outlets in the same period. We then compared the range of detected contaminants and the range of action levels in jurisdictions and visualized the disparity across the United States. Last, we characterized the patient populations affected by contaminants in medical cannabis.
Methods
Reviewing State-Level Regulations of Cannabis Contaminants
We first searched for the regulatory documents of cannabis contaminants in the government (.gov) websites of the 50 U.S. states and Washington, DC (i.e., 51 jurisdictions in total). We excluded the jurisdictions that a) legalized to only decriminalize cannabis or b) only allowed the use of cannabidiol (CBD) oil in our analyses, focusing only on those where at least one state cabinet–level agency was given a legalized mandate to regulate cannabis contaminants. We used a set of primary search terms—including the name of the jurisdictions and “cannabis” and “testing”—to identify a short list of relevant documents. We then applied secondary search terms—including “pesticide,” “metal,” “solvent,” “microbial,” “mycotoxin,” and “action level”—to locate the information for data extraction. The document collection began on 6 February 2021 and ended on 18 May 2022. This allowed us to compile a complete list of regulated contaminants in drug-type Cannabis sativa L. in all legalized jurisdictions in the United States.
Given that different jurisdictions listed some contaminants under different nomenclature, we identified the contaminants based on the Distributed Structure-Searchable Toxicity substance identifiers (DSSTox substance IDs, or DTXSIDs) using the U.S. EPA CompTox Chemicals Dashboard (https://comptox.epa.gov/dashboard).28 If a contaminant was not identified as a single chemical and had no DTXSID, we would create a numbered non-DTXSID tag as a unique contaminant identifier. The category, subcategory, registration status (for pesticides), and chemical class of each contaminant were curated according to a) the categorization by the state-level regulatory agencies; b) the U.S. EPA CompTox Chemicals Dashboard,28 including the “List of active ingredients (updated June 25th, 2019)” and “List of solvents in the PARIS III solvent database”; and c) the Compendium of Pesticide Common Names.29 A Sankey diagram categorizing all contaminants was created with the Plotly package (version 4.9.4.1; Plotly) in R Studio (version 1.4.1717; RStudio). We also extracted the action levels of regulated contaminants (if provided) in the regulatory documents.
Examining Contaminant Load in California Cannabis Samples
According to a market research estimate,30 California is currently the largest cannabis market in the United States. As mandated by the Medicinal and Adult-Use Cannabis Regulation and Safety Act,31 all cannabis and cannabis products in the legal market of California are required to be tested for 68 pesticides, 4 inorganics, 20 solvents, 6 microbes, and 5 mycotoxins. The cannabis manufacturers must submit their products—including cannabis flowers and cannabis products, such as edibles, concentrates, and other consumables—to a state-licensed cannabis testing laboratory. All products must be certified for compliance testing before they can be sold legally. Products that fail the state’s regulatory levels in the compliance testing are subject to recalls. As a case study investigating the scale of cannabis contamination, we mined preexisting anonymized analytical data of 5,654 cured cannabis flower samples and 3,760 concentrate samples (including oil extracts and vape cartridges) from CannaSafe, a state-licensed cannabis testing laboratory in the Los Angeles area. The samples were submitted by cannabis producers and manufacturers in various regions in California for compliance testing between June 2020 and October 2021. Based on our experience as commercial cannabis testing laboratories in California, as well as the statistics reported by the California Department of Cannabis Control,32 we estimated that this data set represented of all cannabis testing conducted in California in that period.
The data set examined in the present research was generated by the cannabis testing laboratory using state-certified analytical methodologies for pesticides, inorganics, solvents, mycotoxins, and microbes. Briefly, the laboratory methodologies were the following for the different classes of contaminants. For pesticides and mycotoxins, 1 g of sample homogenate, either flower or concentrate, was added to a centrifuge tube and of acidified (1% acetic acid) acetonitrile [high-performance liquid chromatography (HPLC) grade] enriched with the internal standard of triphenylphosphate. The samples were shaken vigorously for 5 min. The acetonitrile extract was passed through a C18 dispersive solid-phase extraction cartridge. The resulting extract was split for analysis by LC–tandem mass spectrometry (LC-MS-MS) and gas chromatography with MS-MS (GC-MS-MS). LC-MS-MS was the preferred methodology, but GC-MS-MS was used for analytes not amenable to LC techniques. The solvent extract was filtered ( polytetrafluoroethylene filter) and analyzed directly by LC-MS-MS (Agilent LCMS/MS model Ultivo 9000). The analytical column had a length of and the stationary phase consisted of particles with a phenyl hexyl coating. The solvent program started at 20% methanol (1% formic, ammonium formate), and the methanol fraction increased to 90% over 8 min. Detection of the analytes was conducted by MS-MS methods that employed multiple reaction monitoring to select a diagnostic fragment of the molecule and further break it into secondary fragments. This resulted in a more selective and sensitive analysis than single-stage MS. Data analyses were performed using Agilent MassHunter Data Analysis software. The extract destined for GC-MS-MS (Agilent GCMS/MS model Intuvo 7000) analysis was further diluted 1:1 with a 50:50 mixture of acetone and hexane. The sample injection used a splitless injection port at 280°C. The analytical column was an Agilent 5MS column ( length, internal diameter, and film thickness). The oven program had an initial temperature of 60°C, which was held for 1 min. Next, the temperature was increased at a rate of 40°C/min to 170°C, and then the rate was slowed to 10°C/min to 310°C. The final temperature was held for 2 min. Similar to the LC analysis, the analyte detection in the GC analysis was conducted with MS-MS methods.
Elemental analyses were performed by inductively coupled plasma MS (ICP-MS, Agilent ICPMS model 7700). In this case, of sample was digested in a mixture of water followed by concentrated nitric acid using a Milestone ultraWAVE ECR microwave digestion system. Solvent analyses, which were conducted only on cannabis extract samples, were performed using the headspace full-evaporation technique using an Agilent GC model Intuvo 9000 equipped with a mass selective detector model 5977B and a headspace sampler model 7697A. Briefly, of the homogenized cannabis concentrate was placed in a headspace vial and heated to 120°C. After this heating period, of vapor was removed from the vial and injected onto the GC-MS that was equipped with an Agilent DB-WAX UI , (p/n 122-7032UI) column. The temperature program started at 30°C and was held for 3 min. The temperature then increased at a rate of 10°C/min to 140°C and further increased at a rate of 45°C/min to 200°C, which was held for 1 min. Analytes were detected by single-stage MS. The detection limit of an analyte is below the action level and at a maximum of for analytes with zero tolerance in California regulations. Microbial analyses were done using Medicinal Genomics microbial safety molecular assay testing kits [SenSATIVAx and PathoSEEK; all quantitative polymerase chain reaction (qPCR) based]. The assays were conducted following the manufacturer’s instructions. A Bio-Rad CFX96 Thermocycler were used for all PCR along with the manufacturer preinstalled analysis software (Bio-Rad CFX Manager Industrial Diagnostic, edition 3.0).
To visualize the action level disparity of cannabis contaminants across the United States, we first obtained the action levels for all detected contaminants in the above data set from the available regulatory documents of all legalized cannabis jurisdictions. Next, we compared the concentration range of each detected contaminant alongside the range of action levels in all legalized jurisdictions using a range plot. In addition, we calculated the percentage of the contaminated samples that would have passed the required testing in all jurisdictions. Zero percentage indicates that all contaminated samples would have failed the action levels set for the detected contaminants in the jurisdiction. A percentage of 100 indicates that a) no contaminated samples would have failed the action level in the jurisdiction or b) there was no action level set for the detected contaminants. The passing percentages were visualized using a choropleth map of the United States using the Choroplethr package (version 3.7.0) in R Studio (version 2022.02.3; RStudio) running R (version 4.2.0; R Development Core Team). In addition, we used Google News, Newsbank, and Access World News to search for the news reports of contaminated cannabis outbreaks and recalls between 1 June 2020 and 31 October 2021. Our search terms included “cannabis recall contamination,” “cannabis contamination,” “marijuana contamination,” “marijuana pesticide,” “marijuana metal,” “marijuana solvent,” and “marijuana recall.” The reported number of cannabis contamination outbreaks was visualized in a separate choropleth map, as described above.
Reviewing the Publicly Available Medical Cannabis Use Reports
Last, we searched the medical cannabis use reports released by state-level public health agencies from 2016 to 2021. We used the name of the jurisdictions and “cannabis” and “report” as our primary search terms. We reviewed the shortlisted documents and identified the medical cannabis use reports by their publishers, which should be mentioned in the regulatory documents of their corresponding jurisdictions. These reports typically included the age range, sex, and qualifying condition(s) of cannabis users. Reports that did not have the qualifying condition(s) of medical cannabis users were excluded. We tabulated the known number of medical cannabis users and their qualifying conditions based on these reported statistics to characterize the patient populations affected by exposure to cannabis contaminants. Because the patient statistics in these reports were not collected at the same time, it is important to note that the tabulated statistics are not meant to capture the exact size of patient populations in all reporting states in the past 5 y but, rather, the comparative size of patient populations across all qualifying conditions. The medical conditions were sorted according to the list of diseases evaluated by the National Academies of Sciences, Engineering, and Medicine for the therapeutic effects of cannabis.33 The list is provided in Excel Table S3.
Results
Accessibility and Differences of State-Level Regulations
We began by surveying the contaminant regulation of drug-type Cannabis sativa L. in 50 states and Washington, DC. As of 18 May 2022, 36 states and Washington, DC, had legalized medical cannabis, and 17 states and Washington, DC, had legalized both medical and recreational cannabis (Table 1). The medical cannabis programs were run by state-level public health agencies in only 27 states, whereas the remaining 10 programs were run by departments of commerce, public safety, and others. There was no apparent difference in regulatory stringency between the medical cannabis programs that were run by public health agencies and those that were not. All 37 jurisdictions provided cannabis regulation documents in their websites. Twenty-three jurisdictions listed specific contaminants in all four categories (i.e., pesticides, inorganics, solvents, and microbes/mycotoxins) in their regulations. In comparison, 5 jurisdictions did not mention any specific contaminants and 1 jurisdiction provided no action levels for its list of contaminants (Table 2). Although some jurisdictions showed obvious similarities in their lists, because of the difficulties in tracking the revisions to these regulations, the original source of the contaminants and action levels cannot be fully determined outside of what is explicitly cited in the regulations. Many of these regulatory documents required technical knowledge to decipher. For example, several contaminants were listed with different names by different jurisdictions (e.g., “chlorthal-dimethyl” and “dimethyl tetrachloroterephthalate”). In contrast, some were listed both as individual chemicals or as a group (e.g., “avermectins,” “avermectin B1a,” and “avermectin B1b”). In addition, only 16 states provided Chemical Abstracts Service Registry Numbers (CASRNs) in their regulatory documents as chemical identifiers. The regulatory documents, corresponding agencies, and cannabis testing reports (if available) for the 37 jurisdictions are listed in the Supplemental Material, “Identified Regulatory Documents, Public Health Reports, Cannabis Testing Reports, and News Reports.”
Table 1.
Cannabis legalization in the 50 U.S. states and Washington, DC, as of 18 May 2022.
| Legalization status | Jurisdictions |
|---|---|
| Medical cannabis only | 19—Alabama, Arkansas, Connecticut, Delaware, Florida, Hawaii, Louisiana, Maryland, Minnesota, Mississippi, Missouri, New Hampshire, North Dakota, Ohio, Oklahoma, Pennsylvania, Rhode Island,a Utah, and West Virginia |
| Medical and recreational cannabis | 18—Alaska, Arizona, California, Colorado, Illinois, Maine, Massachusetts, Michigan, Montana, Nevada, New Jersey, New Mexico, New York, Oregon, Vermont, Virginia, Washington, and Washington, DC |
Note: DC, District of Columbia.
Rhode Island has voted to legalize recreational cannabis, but the law is not in effect as of 18 May 2022.
Table 2.
Cannabis contaminant regulations in 37 U.S. states and Washington, DC, as of 18 May 2022.
| Contaminant regulations | Jurisdictions () |
|---|---|
| Regulating contaminants in all four contaminant categories (i.e., pesticides, inorganics, solvents, and microbes/mycotoxins) with action levels | 23 |
| Regulating contaminants in only one, two, or three categories with action levels | 8 |
| Adopting the most stringent acceptable standard for a pesticide in any food item set forth in subpart C of the U.S. Environmental Protection Agency’s regulations for tolerances and exemptions (40 CFR 180).34 | 4a |
| Action levels not found | 6b |
Note: DC, District of Columbia.
Included in the 31 jurisdictions above.
Five of the six jurisdictions did not mention any specific contaminants in their regulatory documents. One jurisdiction provided no action levels for the list of contaminants it provided. Mississippi made a list of action levels available, but we were unable to determine if they were published before 18 May 2022 and thus were not included in analysis. The citation of the action levels in Mississippi are provided in Supplemental Material, “Identified Regulatory Documents, Public Health Reports, Cannabis Testing Reports, and News Reports.”
There was large variability in the number of regulated contaminants listed in 36 states and Washington, DC (Figure 1). Eight jurisdictions provided action levels for only one, two, or three categories of contaminants. Most jurisdictions regulated contaminants, whereas a few had significantly longer lists as a result of the adopted regulations for non-cannabis agricultural products. The variability in the number of regulated pesticides, inorganics, solvents, microbes, and mycotoxins in the 37 jurisdictions is shown in Figure 1. The 4 states with regulated pesticides adopted the full list of U.S. EPA tolerances and exemptions for pesticide chemical residues in food for their cannabis regulations.34 In addition, 2 states cited the USDA 2010–2011 Pilot Study: Pesticide Residue Testing of Organic Produce as a source to regulate “the 195 pesticides federally prohibited for use on organic produce.”35 However, only 1 state mandated the whole list with zero tolerance as guidance for testing, which accounted for the one other outlier in the pesticide category. The other 26 jurisdictions with curated lists for contaminants averaged around 81 contaminants over all categories. The contaminant names, categories, uses, chemical classes, DTXSIDs, and CASRNs are provided in Excel Table S1.
Figure 1.
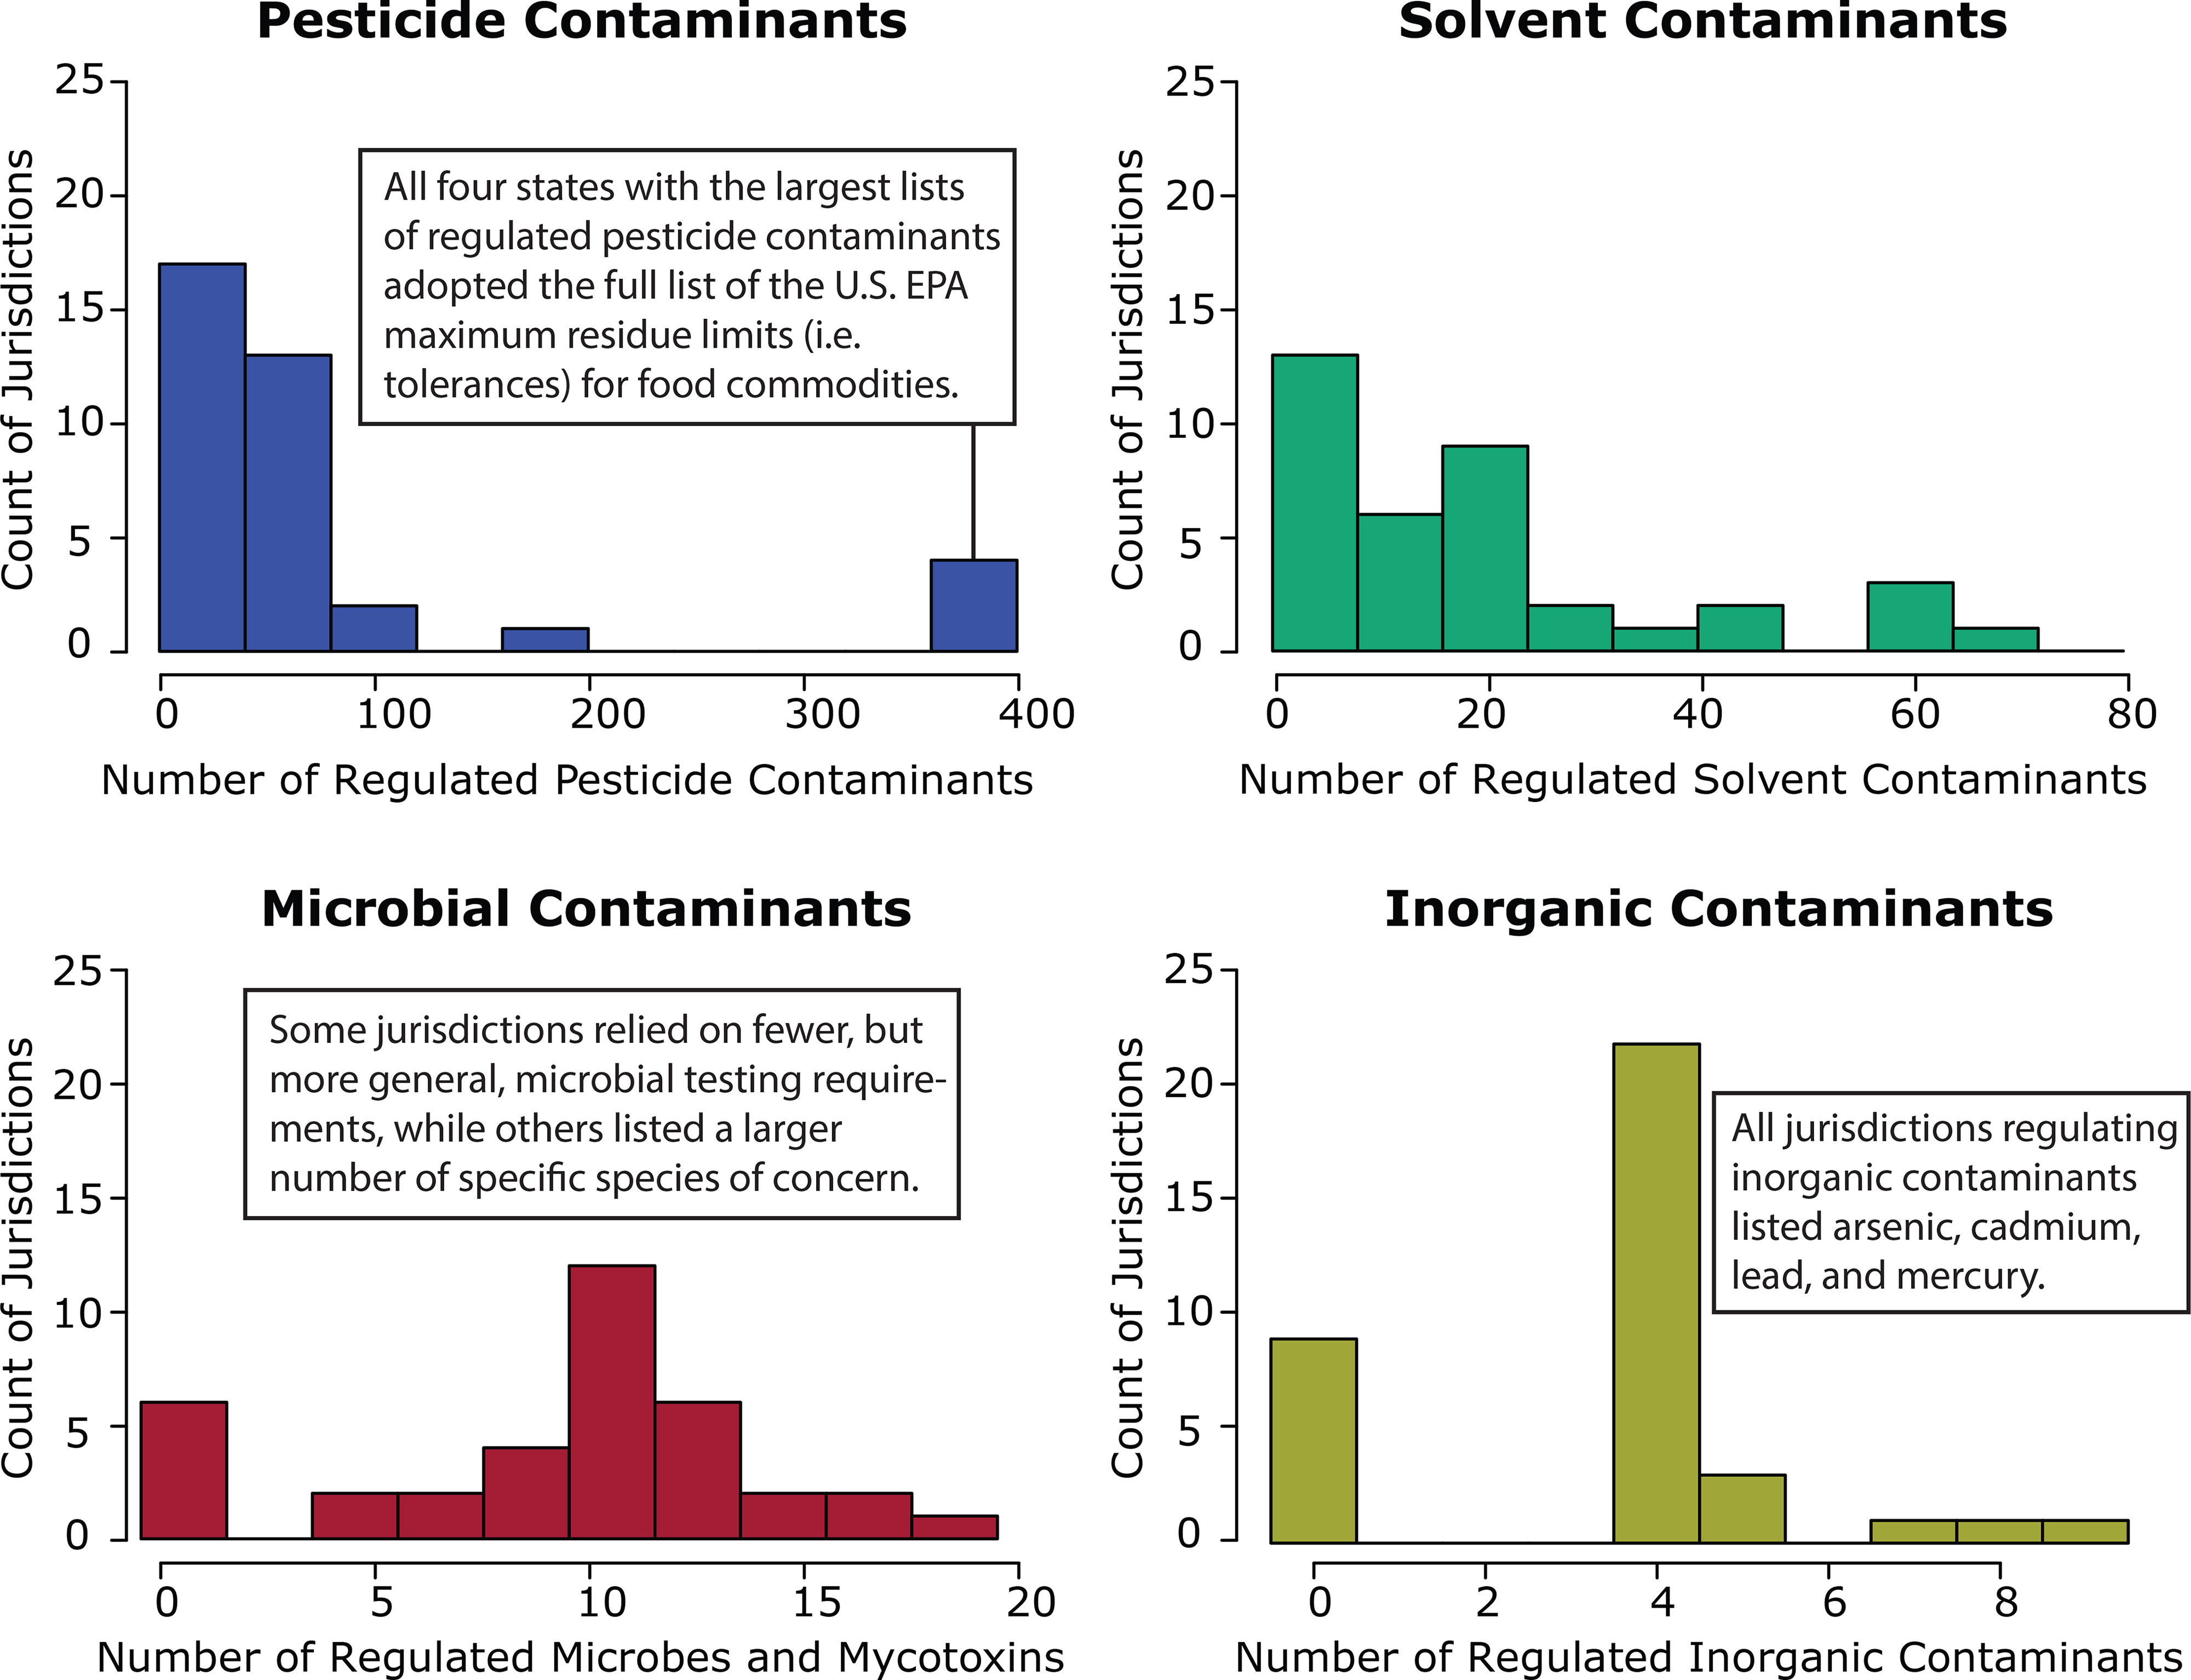
Histograms showing the number of listed cannabis contaminants regulated in each of the 36 legalized states and Washington, DC’s regulatory documents for cannabis as of 18 May 2022. The four main categories of contamination listed are presented as separate panels. Five of the states named no individual contaminants for any category. All regulatory documents are listed in Supplemental Material, “Identified Regulatory Documents, Public Health Reports, Cannabis Testing Reports, and News Reports.” Note: EPA, Environmental Protection Agency.
Shortcomings of Contaminant Regulations by Categories
We systematically examined the common contaminant categories in the listed regulations (Supplemental Material, “Identified Regulatory Documents, Public Health Reports, Cannabis Testing Reports, and News Reports”), including pesticides, inorganics, solvents, microbes, and mycotoxins. As of 18 May 2022, 31 states and Washington, DC, listed 679 cannabis contaminants in their regulatory documents, including 551 pesticides, 74 solvents, 12 inorganics, and 26 microbes and mycotoxins, as well as 16 other contaminants (Figure 2). Pesticides were the largest category of regulated contaminants. Insecticides represented the largest subcategory (174), which was followed by herbicides (160), fungicides (123), and miticides (i.e., acaricides; 17; Table 3). The miticides bifenazate and etoxazole, the fungicide myclobutanil, and the insecticide imidacloprid were regulated by the highest number of jurisdictions (27). There was a large variation in regulated pesticides and action levels in different jurisdictions, as previously reported.20 Most regulated pesticides came from the U.S. EPA tolerance document that included not only active ingredients but also metabolites and degradation products (406 in total, 257 listed by no other jurisdictions).34 Many pesticides in this document were highly unlikely to be used in cannabis cultivation and processing, including chlorpropham (a plant hormone that prevents potatoes from sprouting), oxytetracycline (an antibiotic), and norflurazon (an aquatic herbicide for Hydrilla control). The U.S. EPA tolerance document and individual jurisdictions also listed a total of 42 legacy pesticides that were no longer registered for any agricultural use in the United States, such as dichlorodiphenyltrichloroethane (DDT), chlordane, lindane, and parathion. In addition, although the strictest U.S. EPA tolerance values were adopted as action levels, most of these values were developed for animal products, such as milk and eggs. In comparison with the average level of dietary consumption for these animal products in human populations, cannabis is usually consumed in much smaller quantities through inhalation. Thus, these animal products are not appropriate surrogates for establishing action levels for cannabis.
Figure 2.
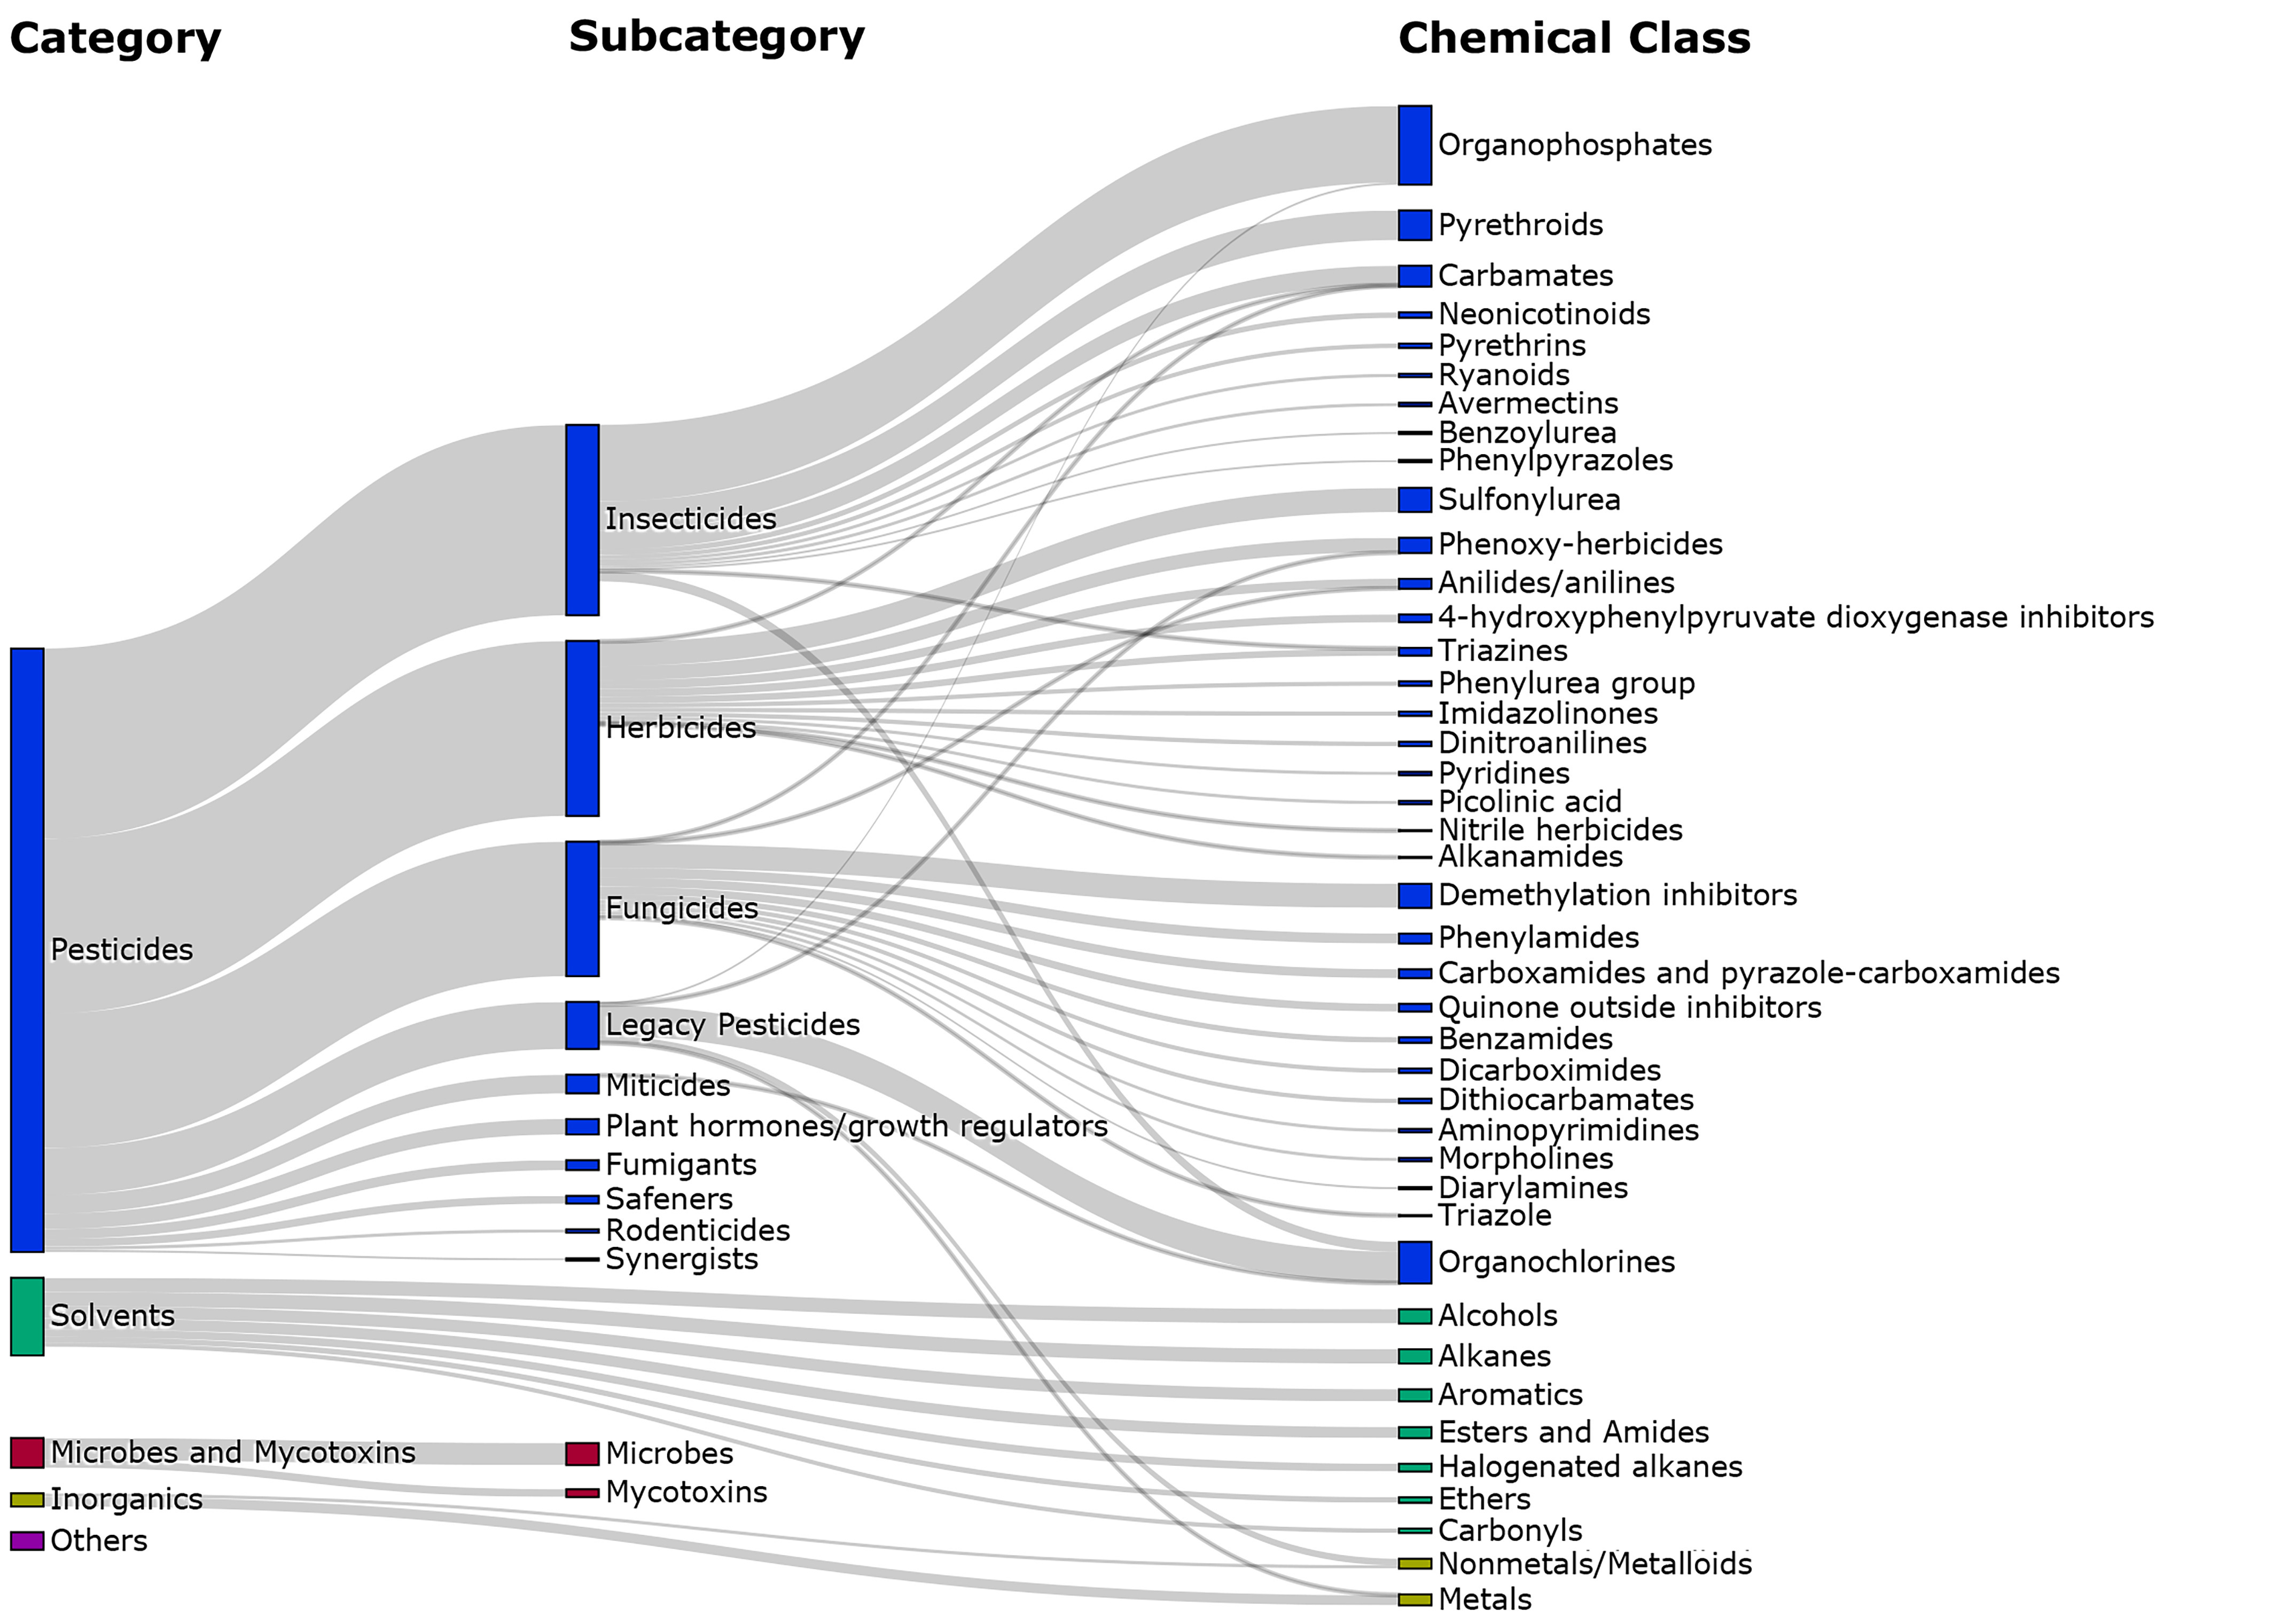
Sankey diagram categorizing all 679 contaminants regulated in cannabis in 31 legalized states and Washington, DC, as of 18 May 2022. The other five legalized jurisdictions did not mention any specific contaminants in their regulatory documents. All vertical bars are scaled to the number of contaminants in each group. Contaminants are identified with the U.S. EPA DSSTox substance ID (DTXSIDs; if available) and grouped in the leftmost column by the main categories found in regulatory documents. The lines connecting to subsequent columns track the breakdown of the main categories into the subsequent groupings. Subcategories are formed based on similarities in uses for pesticides and sources for microbes and mycotoxins. The regulated contaminants are also grouped by chemical classes, where applicable, in the rightmost column. Note: DSSTox substance ID, Distributed Structure-Searchable Toxicity substance identifier; EPA, Environmental Protection Agency.
Table 3.
The number of cannabis contaminants regulated in 31 legalized U.S. states and Washington, DC, alongside the count of detected contaminants in the compliance testing of 5,654 cured cannabis flowers and 3,760 cannabis extracts in California between June 2020 and May 2021.
| Category | 31 U.S. states and DC (including California) |
California | Detected in | ||
|---|---|---|---|---|---|
| Flowers | Extracts | Any sample | |||
| Pesticides | |||||
| Insecticides | 174 | 42 | 24 | 24 | 30 |
| Herbicides | 160 | 1 | 1 | 1 | 1 |
| Fungicides | 123 | 15 | 5 | 9 | 9 |
| Miticides | 17 | 7 | 4 | 6 | 6 |
| Legacy pesticides | 42 | 1 | 1 | 1 | 1 |
| Plant hormones/growth regulators | 14 | 1 | 1 | 1 | 1 |
| Synergists | 2 | 1 | 1 | 1 | 1 |
| Other | 19 | 0 | 0 | 0 | 0 |
| Total | 551 | 68 | 37 | 43 | 49 |
| Solvents | 74 | 20 | 0 | 13 | 13 |
| Inorganics | |||||
| Metals | 9 | 3 | 1 | 3 | 3 |
| Nonmetals | 3 | 1 | 0 | 1 | 1 |
| Total | 12 | 4 | 1 | 4 | 4 |
| Microbes | 21 | 6 | 1 | 0 | 1 |
| Mycotoxins | 5 | 5 | 0 | 1 | 1 |
| Other | 16 | 0 | 0 | 0 | 0 |
| Total | 679 | 103 | 39 | 61 | 68 |
Note: The other five legalized jurisdictions did not mention any specific contaminants in their regulatory documents. Contaminants listed by the 32 jurisdictions are harmonized and counted with the Chemical Abstracts Service Registry Numbers (CASRNs; if provided) and the U.S. EPA DSSTox substance ID (DTXSIDs; if available). DC, District of Columbia; DSSTox substance ID, Distributed Structure-Searchable Toxicity substance identifier; EPA, Environmental Protection Agency.
Cannabis plants—including hemp and cannabis—can actively sequester inorganic contaminants from the environment. Although hemp has been extensively studied for its potential uses in environmental remediation,36–42 inorganic contaminants in cannabis and cannabis products are now raising public health concern.11,43 Twenty-eight jurisdictions listed inorganic contaminants—often categorized as “metals” or “heavy metals”—in their regulatory documents. Arsenic, cadmium, lead, and mercury were listed by all 28 jurisdictions (Excel Table S1), with action levels ranging from 0.00009 to (Excel Table S2). Other regulated inorganics included chromium (listed by 6 jurisdictions), nickel (2 jurisdictions), and copper (2 jurisdictions). Notably, several inorganic compounds were categorized by some jurisdiction as pesticides, such as thallium sulfate, copper arsenate, and lead arsenate. Although elemental concentration can be easily detected and quantified, it does not provide information about whether the observed elements were part of a specific pesticide formulation. Some inorganic pesticides may dissociate and become indistinguishable from other regulated inorganic contaminants. Given the large number of regulated contaminants listed by some jurisdictions, this can create a definitional problem for law enforcement. However, this issue can be solved by setting an action level for the elemental concentration in the sample alone, which makes no assumption about the origin of the element.
Cannabis concentrates can be contaminated with solvent residues during the manufacturing process.16 The most common regulated solvents were hexane (25 jurisdictions), heptane (25 jurisdictions), butane (24 jurisdictions), toluene (24 jurisdictions), and benzene (23 jurisdictions) (Excel Table S1). Action levels for solvents varied widely from zero tolerance to (Excel Table S2). This is consistent with the fact that some solvents naturally occur in Cannabis plants (e.g., ethanol), whereas others are processing residues that present in a lesser amount (e.g., butane). Some jurisdictions established two different sets of action levels for inhaled products and edibles that contained tetrahydrocannabinol (THC) and CBD extracts. Some jurisdictions also encouraged the use of carbon dioxide extraction, which left behind no solvent residues and was considered safer for human consumption.44
Microbes and mycotoxins can be introduced into cannabis in growing, processing, or storage.14 Thirty-six jurisdictions mentioned microbial contamination in their regulatory documents, but only 32 listed specific microbes and mycotoxins. The most common regulated contaminants in this category included E. coli and/or Shiga toxin-producing E. coli (listed by 31 jurisdictions); Salmonella (26 jurisdictions); aflatoxin B1, B2, G1, and G2 (27 jurisdictions); and ochratoxin A (26 jurisdictions) (Excel Table S1). Many jurisdictions also listed “total aerobic microbe” and “total yeast and mold” as an assessment of spoilage and cannabis quality. A small number of jurisdictions also listed some specific human pathogens, including Candida albicans (3 jurisdictions), Listeria monocytogenes (2 jurisdictions), and Klebsiella (1 jurisdiction) (Excel Table S1). The regulation of microbes and mycotoxins was highly variable among different jurisdictions, which ranged from a zero-tolerance policy in some jurisdictions to high tolerance in others. In addition, the fungal species Fusarium spp. and Fusarium mycotoxins were previously found in Cannabis plants and CBD products.45–47 However, Fusarium mycotoxins—which were prevalent contaminants in several agricultural commodities48—were not regulated by any jurisdictions.
Contaminant Load in California Cannabis Samples
We data mined the compliance testing records of 5,654 flower and 3,760 extract samples in California and identified 141 flower and 423 extract samples containing a detectable level of regulated contaminants. Of the contaminated samples, 132 flower and 347 extract samples failed the state’s regulatory action levels. The flower samples contained 39 of the 103 regulated contaminants in California and the extract samples contained 61 of the regulated contaminants (Table 3). Overall, we calculated a total failure rate of 5.1% for all cannabis samples, including a 2.3% failure rate for flowers and a 9.2% failure rate for extracts. Our result was consistent with the cumulative failure rate of 4.2% in all certified cannabis analyses in California’s legal market since the inception of the California Department of Cannabis Control (CDCC) in 2017 (i.e., 8,476 failed samples due to contamination or other issues in a total of 204,163 tested samples).32 The failure rates are also consistent with the reported rates from other legal markets in the United States, including Colorado49 and Oregon50 (see Supplemental Material, “Identified Regulatory Documents, Public Health Reports, Cannabis Testing Reports, and News Reports”).
Insecticides and fungicides were the most prevalent contaminant categories in cannabis flowers (Figure 3). Insecticide contamination accounted for more than half of the contaminated samples (77), followed by fungicides (40 samples), miticides (18 samples), and herbicides (3 samples) (Excel Sheet S2). The insecticide chlorpyrifos was detected in the highest number of samples (19), followed by the fungicide myclobutanil (16 samples), boscalid (11 samples), and the miticide spiromesifen (10 samples). The prevalence of several organophosphate insecticides, including chlorpyrifos, malathion, and dichlorvos, as well as the fungicide myclobutanil, was consistent with the findings in two earlier studies of 389 and 100 cannabis flower samples in Oregon,51,52 although the synergist piperonyl butoxide was detected in this study at a much lower frequency (in only 2 samples). Aspergillus fumigatus and cadmium were the only two non-pesticide contaminants detected. All but 3 failed samples in flowers contained only a single contaminant above California’s regulatory action levels.
Figure 3.
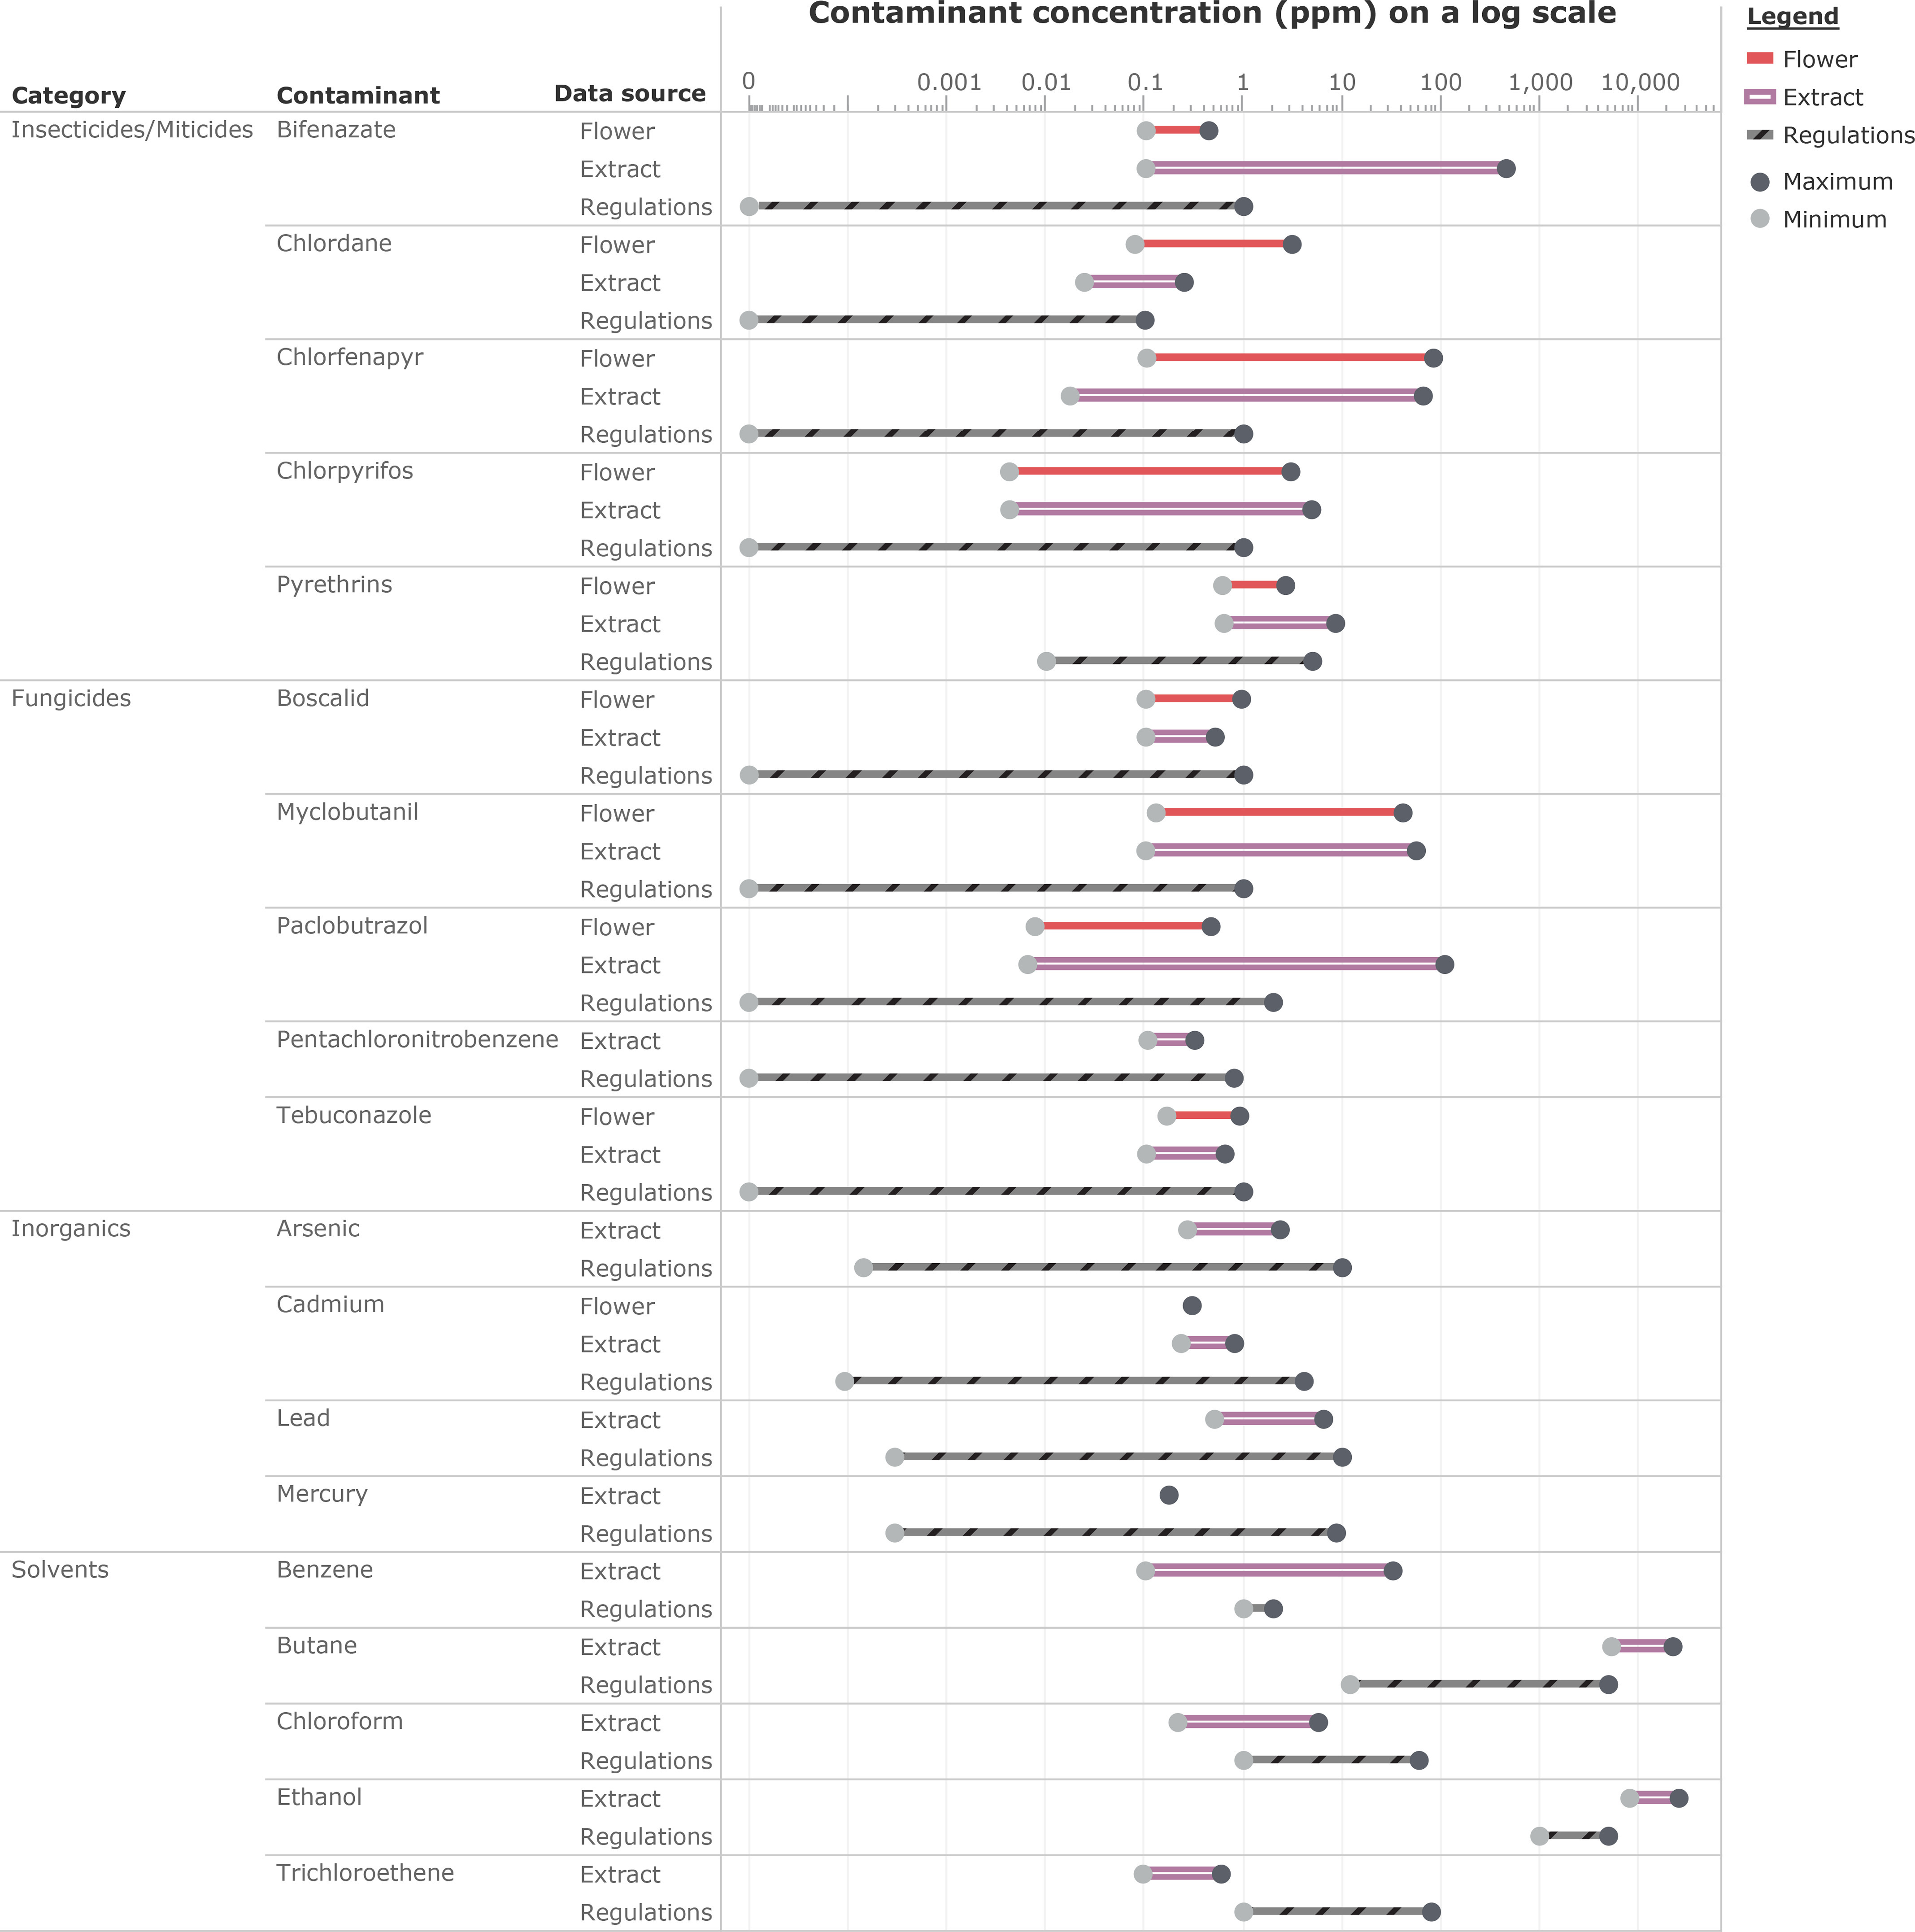
Range plot comparing the concentration levels of the top five most often detected contaminants of each main category of contaminants along with their regulatory action levels in 30 states and Washington, DC. Action levels were not found in the other six legalized jurisdictions. The concentration levels are based on 141 flower and 423 extract samples that had detected contamination in the compliance testing of 5,654 cured cannabis flowers and 3,760 cannabis extracts in California between June 2020 and May 2021. The chemical analysis is conducted with methodologies in compliance with the California state regulations. Only four inorganics are analyzed in these samples. No arsenic, lead, or mercury was detected in the flower samples. In addition, solvents were not tested in the flower samples. Data are provided in Excel Table S2.
Cannabis extract samples had a significantly higher rate of co-contamination. Ninety-four samples contained more than one contaminant and two of those 94 samples had nine different contaminants. In comparison, only 3 cannabis flower samples contained two contaminants and no other co- contamination of flowers was detected. The observed co-contamination of extracts was likely due to the use of multiple batches of cannabis or improperly cleaned machinery in the extraction process. The most common contaminants in cannabis extracts were insecticides, fungicides, and solvents (which were not tested for in flowers). Insecticides accounted for roughly one-third of the detections (204), followed by fungicides (148 detections), solvents (144 detections), miticides (56 detections), inorganic “heavy metals” (22 detections), herbicides (7 detections), and others (7 detections) (Excel Table S2). The most common pesticides found in the cannabis extracts were boscalid (60 samples), chlorfenapyr (55 samples), chlorpyrifos (50 samples), bifenazate (44 samples), and myclobutanil (41 samples), which was similar to the flower data set analyzed above. The solvents with the highest rates of detection were chloroform (49 samples) and benzene (38 samples).
Disparity in state-level regulations can result in a greater risk of contaminant exposure in some jurisdictions. It can also confuse cannabis growers, manufacturers, and testing laboratories. Figure 3 shows the overlap between the range of regulatory action levels in jurisdictions and the range of the most common contaminants detected in each of the four main categories. This overlap indicates the possibility for identical cannabis samples to have been deemed acceptable for the required testing (if any) in one jurisdiction but not in others. Notably, there were also marked differences in the number of jurisdictions regulating different detected contaminants (Excel Table S2). Figure 4 shows the percentage of the contaminated samples in California that would have hypothetically passed the listed action levels in each jurisdiction. Most of the disparity between jurisdictions arose as a result of missing action levels for the relevant contaminants (Excel Table S4). Although some jurisdictions stated that no pesticide contaminants were allowed in cannabis, without specifying the contaminants, it was impossible for cannabis growers or enforcement agencies to determine what analytes to be looking for. This hypothetical visualization also assumed that all jurisdictions would enforce compliance testing to all samples for contamination, which was another variability between jurisdictions that we had not accounted for. These factors could result in higher exposure levels and poor public health outcomes in certain jurisdictions if not addressed.
Figure 4.
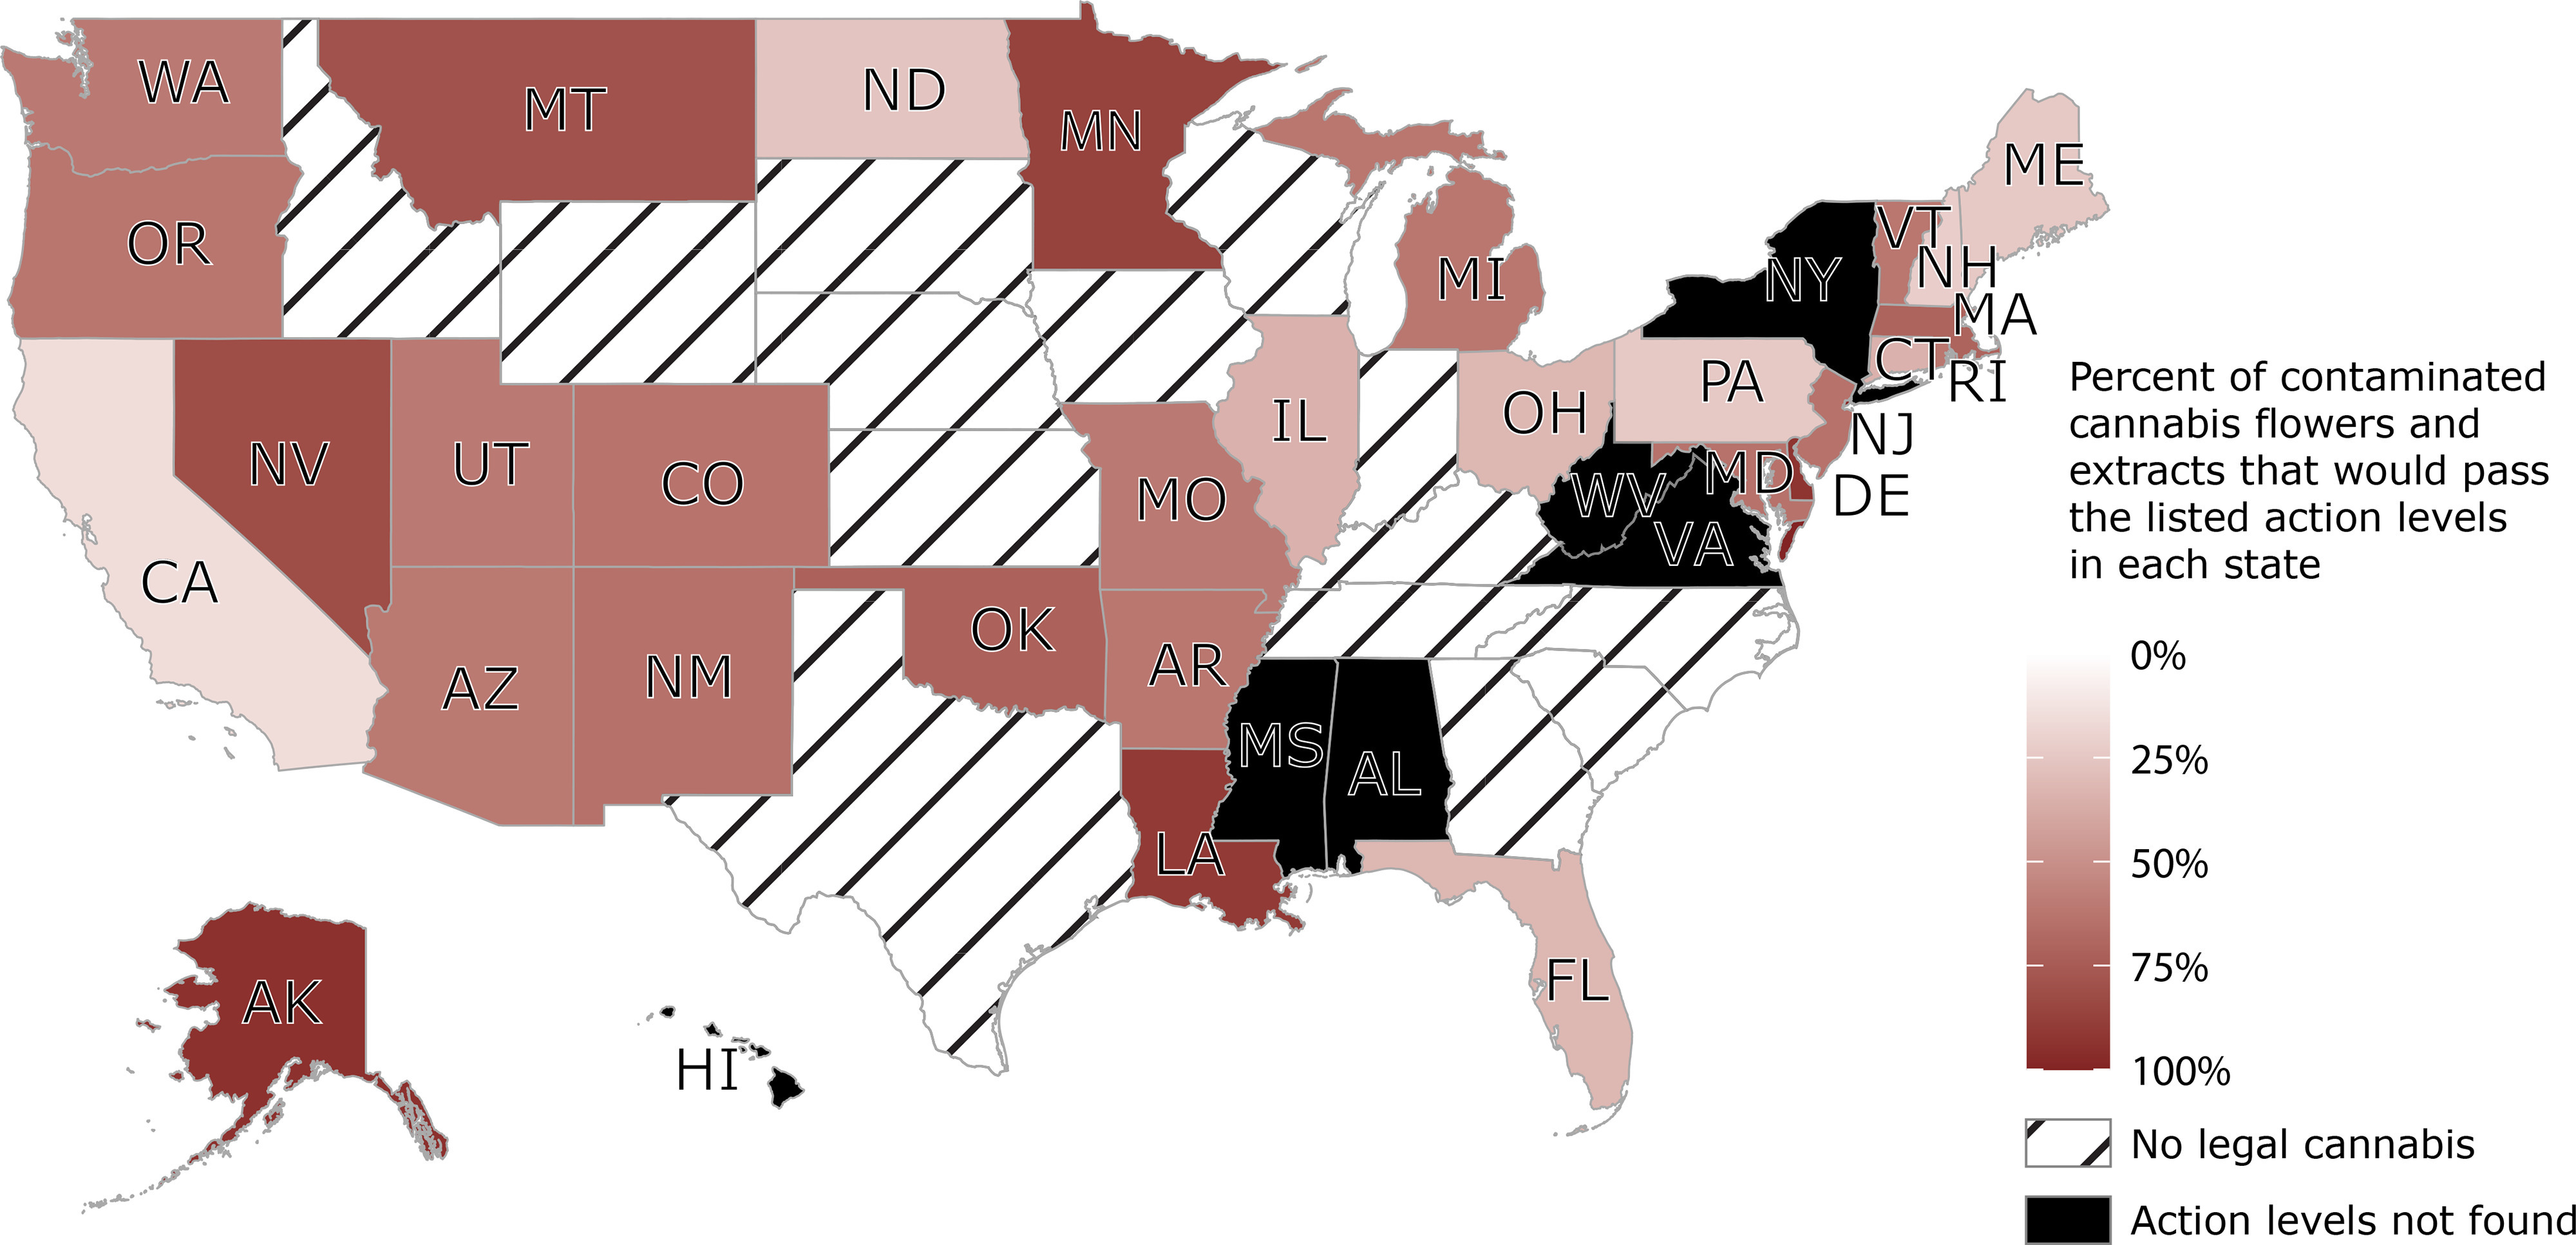
Choropleth map showing the percentage of contaminated samples, both flowers and extracts, passing the listed action levels, as of 30 June 2021, in each jurisdiction. States are shaded based on the percentages of the combined 141 flower and 423 extract samples contaminated in a 2020–2021 survey in California. Zero percentage indicated that all contaminated samples would have failed the action levels set for the detected contaminants in the jurisdiction. A percentage of 100 indicated that a) no contaminated samples would have failed the action level in the jurisdiction or b) there was no action level set for the detected contaminants. The passing percentages were visualized using a choropleth map of the United States. Jurisdictions with no legal cannabis or no listed action levels are not evaluated. Data are provided in Excel Table S4. Note: AK, Alaska; AL, Alabama; AR, AR, Arkansas; AZ, Arizona; CA, California; CO, Colorado; CT, Connecticut; DE, Delaware; FL, Florida; HI, Hawaii; IL, Illinois; LA, Louisiana; MA, Massachusetts; MD, Maryland; ME, Maine; MI, Michigan; MN, Minnesota; MO, Missouri; MT, Montana; ND, North Dakota; NH, New Hampshire; NJ, New Jersey; NM, New Mexico; NV, Nevada; NY, New York; OH, Ohio; OR, Oregon; PA, RI, Rhode Island; UT, Utah; VA, Virginia; VT, Vermont; WA, Washington; WV, West Virginia.
Although microbes accounted for of all regulated contaminants in the United States, they contributed to most of the reported cannabis contamination outbreaks. Figure 5 shows a choropleth of the number of reported incidents for contaminated cannabis outbreaks and recalls in each state between 1 June 2020 and 31 October 2021 (see Supplemental Material, “Identified Regulatory Documents, Public Health Reports, Cannabis Testing Reports, and News Reports”). The majority of these incidents (8 of 14) were caused by microbial contamination,53–60 whereas 1 of those 8 reports also mentioned lead contamination.53 Three incidents were due to various pesticide contamination.61–63 Two recalls were due to cadmium.64,65 The remaining 1 was due to improper handling.66 The prevalence of microbial contamination outbreaks is consistent with the statistics reported by the states. In Colorado, microbial contaminants account for most failed flower and shake/trim samples.49 California’s state data also shows an overall 0.5% failure rate that involves microbial contaminants.32
Figure 5.
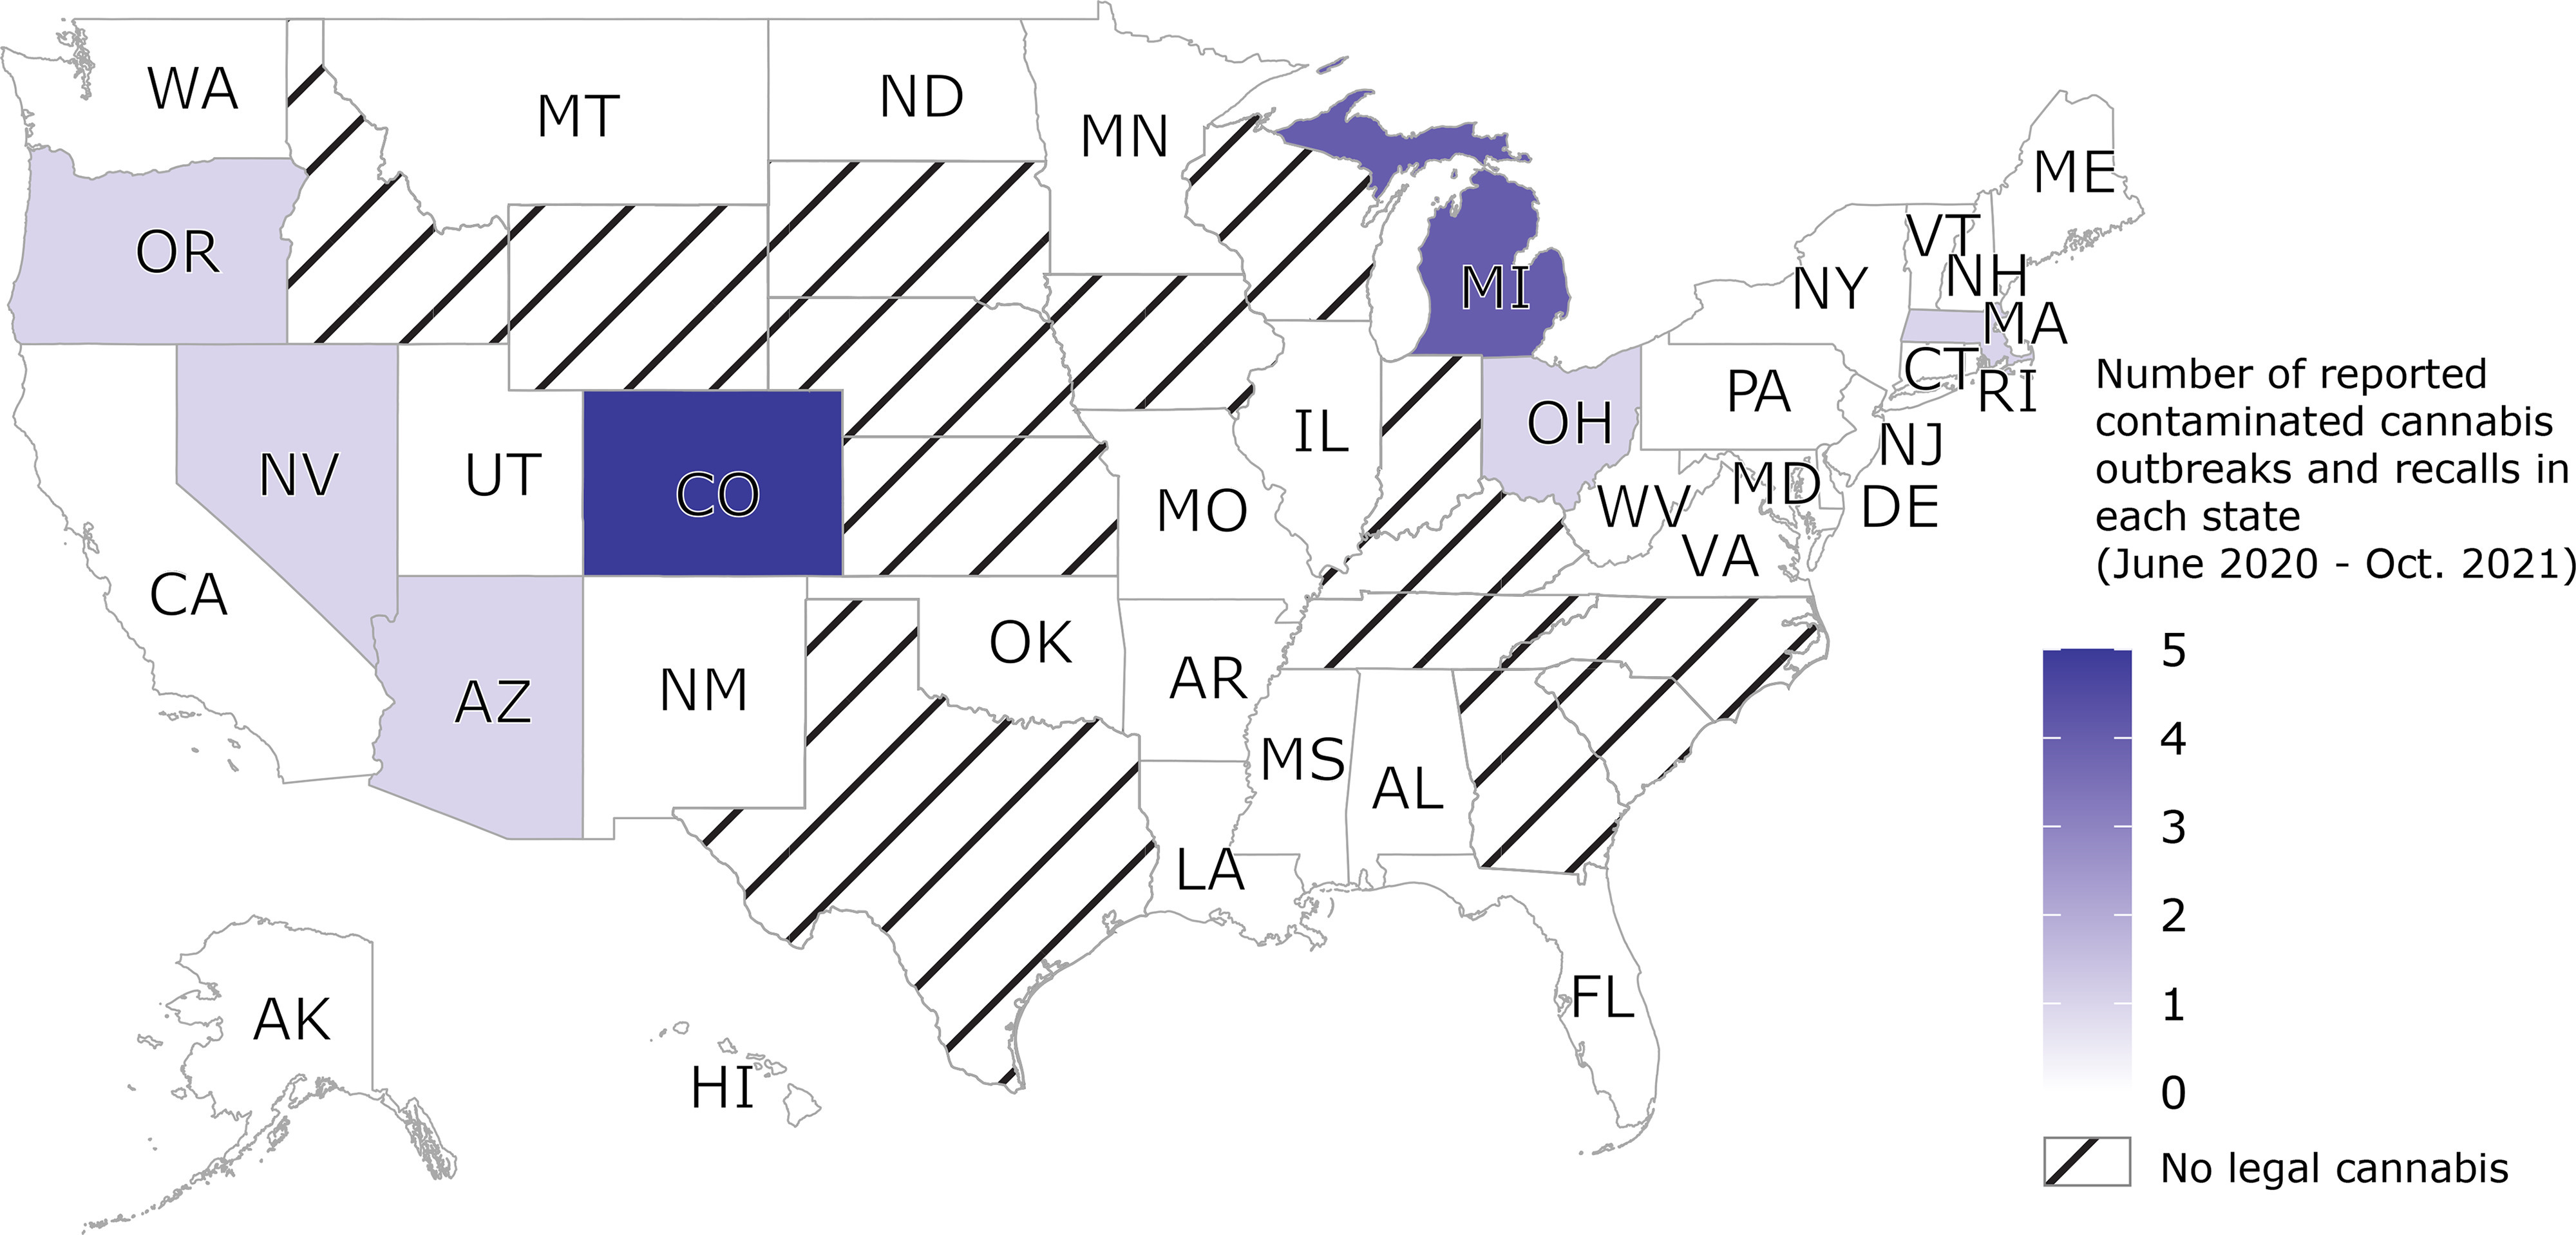
Choropleth map showing the number of reported incidents of contaminated cannabis outbreaks and recalls in each jurisdiction between 1 June 2020 and 31 October 2021. News reports are searched using Google News, Newsbank, and Access World News. Eight of these 14 recalls were caused by microbial contamination. All news reports are listed in Supplemental Material, “Identified Regulatory Documents, Public Health Reports, Cannabis Testing Reports, and News Reports.” Note: AK, Alaska; AL, Alabama; AR, AR, Arkansas; AZ, Arizona; CA, California; CO, Colorado; CT, Connecticut; DE, Delaware; FL, Florida; HI, Hawaii; IL, Illinois; LA, Louisiana; MA, Massachusetts; MD, Maryland; ME, Maine; MI, Michigan; MN, Minnesota; MO, Missouri; MT, Montana; ND, North Dakota; NH, New Hampshire; NJ, New Jersey; NM, New Mexico; NV, Nevada; NY, New York; OH, Ohio; OR, Oregon; PA, RI, Rhode Island; UT, Utah; VA, Virginia; VT, Vermont; WA, Washington; WV, West Virginia.
Characterizing Susceptible Patient Populations
Cannabis and cannabis products—unlike tobacco—are often marketed as alternative options to standard medical treatments. As such, medical cannabis can potentially expose susceptible patients to harmful contaminants10,17; however, there is minimal information about the scale of cannabis use in different patient populations. At the time of writing, only two large-scale studies (i.e., participants) in the PubMed database reported the cannabis use rates of patients with Parkinson’s Disease (25%–40%).67,68 The present study found that 25 of the 34 legalized jurisdictions released cannabis use reports between 2016 and 2021 (Supplemental Material, “Identified Regulatory Documents, Public Health Reports, Cannabis Testing Reports, and News Reports). Twenty of those jurisdictions reported the number of licensed cannabis users by qualifying conditions. The majority of patients were prescribed medical cannabis for use in alleviating pain (799,808 patients), followed by post-traumatic stress disorder (164,383 patients), spasticity associated with multiple sclerosis or spinal cord injury (78,145 patients), cancer (44,318 patients), and epilepsy (21,195 patients). Anorexia, weight loss, and amyotrophic lateral sclerosis had relatively few patients (8,016 and 432 patients, respectively). The result was unexpected given that both conditions were listed by a large number of jurisdictions as qualifying conditions (25 and 19 jurisdictions, respectively).20 Notably, recreational cannabis had been legalized in 15 states and many cannabis users may have self-medicated without a medical use license. The number of patients who are subject to harmful contaminant exposure may be higher than the reported number of medical use licenses. The complete list of qualifying conditions and the total number of self-reported patients are provided in Excel Table S3.
Discussion
In this study, we applied data mining and visualization to examine the complex landscape of state-level regulations for cannabis contaminants in the United States. We found that a) there was more inconsistency in cannabis-borne contaminant regulation as compared with other agricultural commodities; b) pesticides, inorganics, solvents, microbes, and mycotoxins were key categories of regulated contaminants; c) insecticides, fungicides, and solvents were the most prevalent contaminant categories in cannabis flowers and extracts; d) disparity in state-level regulations can result in greater risk of contaminant exposure; and e) there is a critical need to better understand the cannabis-borne contaminant exposure of susceptible patient populations. Our findings have two important public health implications. First, the scattershot approach of regulations at the state level can confuse cannabis manufacturers and discourage compliance while subjecting cannabis users to a higher level of contaminant exposure in some jurisdictions. Second, given the current status of cannabis contaminant regulation in the United States, it is unclear whether the health benefit of cannabis usage outweighs the health risk of exposure to cannabis-borne contaminants.
The current listing of regulated contaminants in cannabis resembles an assortment of contaminants—such as organophosphate insecticides, arsenic, E. coli, and aflatoxin B1—that can be commonly found in human diets and the environment. This appears to be a consequence of adopting food and environmental regulations to a new, formerly illegal commodity where the contaminant information is not available.69–71 Subsequently, there was a mismatch between the current regulations and prevalent contaminants detected in cannabis. For instance, herbicides accounted for 24% of all regulated cannabis contaminants, but weed control was not known to be a key concern in cannabis production.72 This is further supported by the fact that herbicide contamination was found in only 3 of all 5,654 flowers tested (i.e., 0.05%) and 7 of the 3,760 extracts (i.e., 0.19%). In addition, we found significant variations in regulatory action levels that could not be explained by patterns of use, human health risk, or environmental concerns. For instance, the action levels of organophosphate insecticide dichlorvos and dimethoate in cannabis ranged from zero tolerance in California to in several states. In contrast, the U.S. EPA tolerances of dichlorvos and dimethoate range from 0.5 to in most fruits and vegetables.34
Although cannabis growth has more compliance testing requirements than other agricultural commodities in the United States, the testing information was surprisingly inaccessible. Besides the present study, only a few surveys with more specific focuses are available in the open literature.11,16,51,52,73,74 This was unlike other U.S. agricultural commodities where contaminant data are collected and reported at the federal level, such as the USDA Pesticide Data Program.24 The lack of data access has hindered the refinement of regulations to better capture the prevalent contaminants in cannabis. In our opinion, this is an unintended consequence of the Schedule I listing of cannabis at the federal level. This prevents the federal agencies from working with state-level regulatory agencies to report the contaminant data in open-access databases.
Cannabis can be used as a therapeutic agent, but it is not regulated as one in the United States. Our results show that 5.1% of the cannabis samples for compliance testing exceeded California’s regulatory action levels of contaminants. Although batches that fail compliance testing are supposed to be removed from the legal market, they are sometimes sold in the black market, which is still thriving in California and the other parts of the United States. In addition, patients may be given no information by their health providers regarding the safety issues of cannabis use. They may acquire cannabis from illegal or unknown sources. Several surveys have investigated medical use of cannabis in specific patient populations.67,75,76 Yet, the level of cannabis-borne contaminant exposure in patient populations is a largely unstudied area. Further investigation is needed to examine the safety considerations in susceptible patient populations across all medical conditions. Last, there is a critical knowledge gap regarding cannabis-borne contaminant exposure with different consumption methods. Combustion and pyrolysis of the contaminants may change the associated risk of contamination.76,77
The progression and prognosis of many qualifying conditions may be worsened by exposure to detected contaminants in cannabis. In our survey, 73 of the 141 contaminated samples contained insecticides, including chlorpyrifos. Many of these insecticides could target neurotransmitter signaling pathways associated with seizures and epilepsy.20 A recent study in Australia found that some families used artisanal cannabis products to manage their children’s seizures rather than pharmaceutical-grade cannabis.78 Analysis of the products found that 29% of samples were contaminated with ethanol or isopropanol above the acceptable limits. There were also concerns over the microbial contaminant Aspergillus spp. that can infect immunocompromised cancer patients.18 The 2017 survey found that cannabis samples from dispensaries in California contained significant numbers of fungal and bacterial contaminants.13 A follow-up study revealed that cannabis users were 3.5 times more likely to have a fungal infection than persons who did not use cannabis.21 These findings are especially concerning to people with immunocompromising conditions such as cancer and acquired immunodeficiency syndrome (AIDS) because these patients are at risk of experiencing a fatal infection.
In conclusion, this study demonstrates an urgent need for a unified regulatory approach to mitigate the public health risk of cannabis contamination at a national level. Although individual jurisdictions may implement their cannabis policies and regulations, there should be a national-level guideline on the contaminant regulations of cannabis. In our opinion, this guideline should be based on human health risk assessment methodologies consistent with other agricultural and food commodities. In addition, a more stringent approach is needed to regulate contaminants in medical cannabis to address additional vulnerabilities present in these populations. Given the existing knowledge gaps regarding cannabis contamination toxicity and exposure, this effort would require federal and state support to advance the toxicological and epidemiological research of cannabis-borne contaminants, particularly in susceptible patient populations with medical conditions. With the constraints faced by federal agencies in regulating an illegal Schedule I substance, we think this effort should involve the analytical science community, the medical community, and multistate trade collaboratives. This two-tier approach may provide a science-based solution to mitigate the health hazards of cannabis contaminants in an expanding U.S. cannabis market.
Supplementary Material
Acknowledgments
The authors thank N. Baker, R. Bireley, M. Chan, M. Go, K. Sweat, and T. Sandrin for their research assistance and constructive comments. The chemical analysis for cannabis contaminants was conducted with methodologies in compliance with the California state regulations. The authors do not endorse any commercial products or services.
References
- 1.NCDAS (National Center for Drug Abuse Statistics). 2022. Marijuana addiction: rates & usage statistics. https://drugabusestatistics.org/marijuana-addiction/ [accessed 29 May 2022].
- 2.SAMHSA (Substance Abuse and Mental Health Services Administration). 2020. 2019 National Survey of Drug Use and Health. https://www.samhsa.gov/data/release/2019-national-survey-drug-use-and-health-nsduh-releases [accessed 29 May 2022].
- 3.Mitchell O, Caudy MS. 2015. Examining racial disparities in drug arrests. Justice Q 32(2):288–313, 10.1080/07418825.2012.761721. [DOI] [Google Scholar]
- 4.Bridgeman MB, Abazia DT. 2017. Medicinal cannabis: history, pharmacology, and implications for the acute care setting. P T 42(3):180–188, PMID: . [PMC free article] [PubMed] [Google Scholar]
- 5.Mercurio A, Aston ER, Claborn KR, Waye K, Rosen RK. 2019. Marijuana as a substitute for prescription medications: a qualitative study. Subst Use Misuse 54(11):1894–1902, PMID: , 10.1080/10826084.2019.1618336. [DOI] [PMC free article] [PubMed] [Google Scholar]
- 6.Gali K, Winter SJ, Ahuja NJ, Frank E, Prochaska JJ. 2021. Changes in cannabis use, exposure, and health perceptions following legalization of adult recreational cannabis use in California: a prospective observational study. Subst Abuse Treat Prev Policy 16(1):16, PMID: , 10.1186/s13011-021-00352-3. [DOI] [PMC free article] [PubMed] [Google Scholar]
- 7.Nadler J. 2020. Marijuana Opportunity Reinvestment and Expungement Act of 2020. https://www.congress.gov/bill/116th-congress/house-bill/3884 [accessed 11 April 2022].
- 8.Carliner H, Brown QL, Sarvet AL, Hasin DS. 2017. Cannabis use, attitudes, and legal status in the U.S.: a review. Prev Med 104:13–23, PMID: , 10.1016/j.ypmed.2017.07.008. [DOI] [PMC free article] [PubMed] [Google Scholar]
- 9.McPartland JM, McKernan KJ. 2017. Contaminants of concern in cannabis: microbes, heavy metals and pesticides. In: Cannabis sativa L. - Botany and Biotechnology. Chandra S, Lata H, ElSohly MA, eds. Cham, Switzerland: Springer International Publishing, 457–474. [Google Scholar]
- 10.Dryburgh LM, Bolan NS, Grof CPL, Galettis P, Schneider J, Lucas CJ, et al. 2018. Cannabis contaminants: sources, distribution, human toxicity and pharmacologic effects. Br J Clin Pharmacol 84(11):2468–2476, PMID: , 10.1111/bcp.13695. [DOI] [PMC free article] [PubMed] [Google Scholar]
- 11.Amendola G, Bocca B, Picardo V, Pelosi P, Battistini B, Ruggieri F, et al. 2021. Toxicological aspects of cannabinoid, pesticide and metal levels detected in light Cannabis inflorescences grown in Italy. Food Chem Toxicol 156:112447, PMID: , 10.1016/j.fct.2021.112447. [DOI] [PubMed] [Google Scholar]
- 12.Taylor A, Birkett JW. 2020. Pesticides in cannabis: a review of analytical and toxicological considerations. Drug Test Anal 12(2):180–190, PMID: , 10.1002/dta.2747. [DOI] [PubMed] [Google Scholar]
- 13.Thompson GR III, Tuscano JM, Dennis M, Singapuri A, Libertini S, Gaudino R, et al. 2017. A microbiome assessment of medical marijuana. Clin Microbiol Infect 23(4):269–270, PMID: , 10.1016/j.cmi.2016.12.001. [DOI] [PubMed] [Google Scholar]
- 14.Vujanovic V, Korber DR, Vujanovic S, Vujanovic J, Jabaji S. 2020. Scientific prospects for cannabis-microbiome research to ensure quality and safety of products. Microorganisms 8(2):290, PMID: , 10.3390/microorganisms8020290. [DOI] [PMC free article] [PubMed] [Google Scholar]
- 15.Romano LL, Hazekamp A. 2013. Cannabis oil: chemical evaluation of an upcoming cannabis-based medicine. Cannabinoids 1(1):1–11. [Google Scholar]
- 16.Raber JC, Elzinga S, Kaplan C. 2015. Understanding dabs: contamination concerns of cannabis concentrates and cannabinoid transfer during the act of dabbing. J Toxicol Sci 40(6):797–803, PMID: , 10.2131/jts.40.797. [DOI] [PubMed] [Google Scholar]
- 17.Montoya Z, Conroy M, Vanden Heuvel BD, Pauli CS, Park SH. 2020. Cannabis contaminants limit pharmacological use of cannabidiol. Front Pharmacol 11:571832, PMID: , 10.3389/fphar.2020.571832. [DOI] [PMC free article] [PubMed] [Google Scholar]
- 18.Davis MP. 2016. Cannabinoids for symptom management and cancer therapy: the evidence. J Natl Compr Canc Netw 14(7):915–922, PMID: , 10.6004/jnccn.2016.0094. [DOI] [PubMed] [Google Scholar]
- 19.Leung MCK, Silva MH, Palumbo AJ, Lohstroh PN, Koshlukova SE, DuTeaux SB. 2019. Adverse outcome pathway of developmental neurotoxicity resulting from prenatal exposures to cannabis contaminated with organophosphate pesticide residues. Reprod Toxicol 85:12–18, PMID: , 10.1016/j.reprotox.2019.01.004. [DOI] [PubMed] [Google Scholar]
- 20.Pinkhasova DV, Jameson LE, Conrow KD, Simeone MP, Davis AP, Wiegers TC, et al. 2021. Regulatory status of pesticide residues in cannabis: implications to medical use in neurological diseases. Curr Res Toxicol 2:140–148, PMID: , 10.1016/j.crtox.2021.02.007. [DOI] [PMC free article] [PubMed] [Google Scholar]
- 21.Benedict K, Thompson GR III, Jackson BR. 2020. Cannabis use and fungal infections in a commercially insured population, United States, 2016. Emerg Infect Dis 26(6):1308–1310, PMID: , 10.3201/eid2606.191570. [DOI] [PMC free article] [PubMed] [Google Scholar]
- 22.FDA (U.S. Food and Drug Administration). 2021. FDA Regulation of Cannabis and Cannabis-Derived Products, Including Cannabidiol (CBD). https://www.fda.gov/news-events/public-health-focus/fda-regulation-cannabis-and-cannabis-derived-products-including-cannabidiol-cbd#approved [accessed 11 April 2022].
- 23.U.S. EPA (U.S. Environmental Protection Agency). 2021. Pesticide products registered for use on hemp. https://www.epa.gov/pesticide-registration/pesticide-products-registered-use-hemp [accessed 11 April 2022].
- 24.USDA (U.S. Department of Agriculture). 2019. Pesticide Data Program Annual Summary. Washington, DC: USDA. https://www.ams.usda.gov/sites/default/files/media/2019PDPAnnualSummary.pdf [accessed 18 May 2022]. [Google Scholar]
- 25.Pruyn SA, Wang Q, Wu CG, Taylor CL. 2022. Quality standards in state programs permitting cannabis for medical uses. Cannabis Cannabinoid Res. Preprint posted online 28 March 2022, PMID: , 10.1089/can.2021.0164. [DOI] [PMC free article] [PubMed] [Google Scholar]
- 26.Fraser MR, Juliano C, Nichols G. 2021. Variation among public health interventions in initial efforts to prevent and control the spread of COVID-19 in the 50 states, 29 big cities, and the District of Columbia. J Public Health Manag Pract 27(suppl 1):S29–S38, PMID: , 10.1097/PHH.0000000000001284. [DOI] [PubMed] [Google Scholar]
- 27.Page-Tan C, Corbin TB. 2021. Protective policies for all? An analysis of COVID-19 deaths and protective policies among low-, medium-, and high-vulnerability groups. Disasters 45(suppl 1):S119–S145, PMID: , 10.1111/disa.12525. [DOI] [PubMed] [Google Scholar]
- 28.Williams AJ, Lambert JC, Thayer K, Dorne JLCM. 2021. Sourcing data on chemical properties and hazard data from the US-EPA CompTox Chemicals Dashboard: a practical guide for human risk assessment. Environ Int 154:106566, PMID: , 10.1016/j.envint.2021.106566. [DOI] [PMC free article] [PubMed] [Google Scholar]
- 29.British Crop Production Council. 2022. Compendium of Pesticide Common Names. https://pesticidecompendium.bcpc.org/index.html [accessed 15 March 2021].
- 30.Tapman M, Nielsen K. 2021. 2020 and 2021 Cannabis Market Review. BDSA. https://bdsa.com/content/2020-and-2021-cannabis-market-review/ [accessed 18 May 2022]. [Google Scholar]
- 31.California State Legislature. 2017. Medicinal and Adult-Use Cannabis Regulation and Safety Act. https://leginfo.legislature.ca.gov/faces/codes_displayexpandedbranch.xhtml?tocCode=BPC&division=10.&title=&part=&chapter=&article= [accessed 18 May 2022].
- 32.CDCC (California Department of Cannabis Control). 2021. Cannabis batch testing. Certificates of analysis as of May 21, 2021. https://bcc.ca.gov/clear/documents/weekly/20210524_report.xlsx [accessed 18 May 2022].
- 33.National Academies of Sciences, Engineering, and Medicine. 2017. Chapter 4. Therapeutic effects of cannabis and cannabinoids. In: The Health Effects of Cannabis and Cannabinoids: The Current State of Evidence and Recommendations for Research. Washington, DC: National Academies Press, 85–140. [PubMed] [Google Scholar]
- 34.U.S. EPA. Tolerances and Exemptions for Pesticide Chemical Residues in Food. Washington, DC. 40 Code of Federal Regulations Part 1802021. https://www.ecfr.gov/current/title-40/chapter-I/subchapter-E/part-180?toc=1 [accessed 1 February 2021]. [Google Scholar]
- 35.USDA. 2012. 2010–2011 Pilot Study: Pesticide Residue Testing of Organic Produce. Washington, DC: USDA, 1–32. https://www.ams.usda.gov/reports/2010-2011-pilot-study-pesticide-residue-testing-organic-produce [accessed 18 May 2022]. [Google Scholar]
- 36.Linger P, Müssig J, Fischer H, Kobert, J. 2002. Industrial hemp (Cannabis sativa L.) growing on heavy metal contaminated soil: fibre quality and phytoremediation potential. Ind Crops Prod 16(1):33–42, 10.1016/S0926-6690(02)00005-5. [DOI] [Google Scholar]
- 37.Ahmad R, Tehsin Z, Malik S, Asad S, Muhammad S, Shah M, et al. 2015. Phytoremediation potential of hemp (Cannabis sativa L.): identification and characterization of heavy metals responsive genes. Clean (Weinh) 44(2):195–201, 10.1002/clen.201500117. [DOI] [Google Scholar]
- 38.Placido DF, Lee CC. 2022. Potential of industrial hemp for phytoremediation of heavy metals. Plants (Basel) 11(5):595, PMID: , 10.3390/plants11050595. [DOI] [PMC free article] [PubMed] [Google Scholar]
- 39.Citterio S, Santagostino A, Fumagalli P, Prato N, Ranalli P, Sgorbati S. 2003. Heavy metal tolerance and accumulation of Cd, Cr and Ni by Cannabis sativa L. Plant Soil 256:243–252, 10.1023/A:1026113905129. [DOI] [Google Scholar]
- 40.Stonehouse GC, McCarron BJ, Guignardi ZS, El Mehdawi AF, Lima LW, Fakra SC, et al. 2020. Selenium metabolism in hemp (Cannabis sativa L.)—potential for phytoremediation and biofortification. Environ Sci Technol 54(7):4221–4230, PMID: , 10.1021/acs.est.9b07747. [DOI] [PubMed] [Google Scholar]
- 41.Husain R, Weeden H, Bogush D, Deguchi M, Soliman M, Potlakayala S, et al. 2019. Enhanced tolerance of industrial hemp (Cannabis sativa L.) plants on abandoned mine land soil leads to overexpression of cannabinoids. PLoS One 14(8):e0221570, PMID: , 10.1371/journal.pone.0221570. [DOI] [PMC free article] [PubMed] [Google Scholar]
- 42.Grifoni M, Rosellini I, Petruzzelli G, Pedron F, Franchi E, Barbafieri M. 2021. Application of sulphate and cytokinin in assisted arsenic phytoextraction by industrial Cannabis sativa L. Environ Sci Pollut Res Int 28(34):47294–47305, PMID: , 10.1007/s11356-021-14074-3. [DOI] [PubMed] [Google Scholar]
- 43.Meehan-Atrash J, Rahman I. 2022. Novel Δ8-tetrahydrocannabinol vaporizers contain unlabeled adulterants, unintended byproducts of chemical synthesis, and heavy metals. Chem Res Toxicol 35(1):73–76, PMID: , 10.1021/acs.chemrestox.1c00388. [DOI] [PMC free article] [PubMed] [Google Scholar]
- 44.Da Porto C, Decorti D, Natolino A. 2014. Separation of aroma compounds from industrial hemp inflorescences (Cannabis sativa L.) by supercritical CO2 extraction and on-line fractionation. Ind Crops Prod 58:99–103, 10.1016/j.indcrop.2014.03.042. [DOI] [Google Scholar]
- 45.Gwinn KD, Hansen Z, Kelly H, Ownley BH. 2022. Diseases of Cannabis sativa caused by diverse Fusarium species. Front Agron 3:796062, 10.3389/fagro.2021.796062. [DOI] [Google Scholar]
- 46.Jerushalmi S, Maymon M, Dombrovsky A, Freeman S. 2020. Fungal pathogens affecting the production and quality of medical cannabis in Israel. Plants (Basel) 9(7):882, PMID: , 10.3390/plants9070882. [DOI] [PMC free article] [PubMed] [Google Scholar]
- 47.Narváez, A, Rodríguez-Carrasco Y, Castaldo L, Izzo L, Ritieni A. 2020. Ultra-high-performance liquid chromatography coupled with quadrupole orbitrap high-resolution mass spectrometry for multi-residue analysis of mycotoxins and pesticides in botanical nutraceuticals. Toxins (Basel) 12(2):114, PMID: , 10.3390/toxins12020114. [DOI] [PMC free article] [PubMed] [Google Scholar]
- 48.Munkvold GP. 2017. Fusarium species and their associated mycotoxins. In: Mycotoxigenic Fungi: Methods and Protocols. Moretti A, Susca A, eds. New York, NY: Springer New York, 51–106. [DOI] [PubMed] [Google Scholar]
- 49.Colorado Department of Revenue. 2021. Marijuana Enforcement Division (MED). September 17. MED 2020 Annual Update :14. https://sbg.colorado.gov/sites/sbg/files/210916%202020%20MED%20Annual%20Final.pdf [accessed 18 May 2022].
- 50.Oregon Secretary of State, Oregon Audits Division. 2019. Oregon’s Framework for Regulating Marijuana Should Be Strengthened to Better Mitigate Diversion Risk and Improve Laboratory Testing. Salem, Oregon: Oregon Secretary of State, 29–30. https://sos.oregon.gov/audits/Documents/2019-04.pdf [accessed 18 May 2022]. [Google Scholar]
- 51.Maguire WJ, Call CW, Cerbu C, Jambor KL, Benavides-Montes VE. 2019. Comprehensive determination of unregulated pesticide residues in Oregon Cannabis flower by liquid chromatography paired with triple quadrupole mass spectrometry and gas chromatography paired with triple quadrupole mass spectrometry. J Agric Food Chem 67(46):12670–12674, PMID: , 10.1021/acs.jafc.9b01559. [DOI] [PubMed] [Google Scholar]
- 52.Voelker R, Holmes M. 2015. Pesticide Use on Cannabis. Eugene, OR: Cannabis Safety Institute, 1–19. [Google Scholar]
- 53.Mitchell T. 2021. Medical marijuana recalled in Colorado Springs. Westword, 22 April 2021. https://www.westword.com/marijuana/medical-marijuana-recalled-heavy-metal-mold-colorado-springs-dispensary-11949057 [accessed 18 May 2022].
- 54.Outbreak News Today. 2021. Arizona: marijuana products recalled due to possible contamination with salmonella or aspergillus fungus. Outbreak News Today, 24 June 2021. https://outbreaknewstoday.com/arizona-marijuana-products-recalled-due-to-possible-contamination-with-salmonella-or-aspergillus-fungus-71463/ [accessed 18 May 2022].
- 55.Roznowski B. 2021. Marijuana Enforcement Division issues health and safety advisory for some marijuana flower products. KMGH, 15 October 2021. https://www.thedenverchannel.com/news/local-news/marijuana-enforcement-division-issues-health-and-safety-advisory-for-some-marijuana-flower-products [accessed 18 May 2022].
- 56.MJBizDaily. 2021. Colorado authorities issue recall of contaminated cannabis. MJBizDaily, 17 December 2021. https://mjbizdaily.com/colorado-authorities-issue-recall-of-contaminated-cannabis/ [accessed 18 May 2022].
- 57.Christensen D. 2021. Holistic pot facility battles mold contamination in Monson. Daily Hampshire Gazette, 24 September 2021. https://www.gazettenet.com/Mold-at-marijuana-cultivation-facility-42659718 [accessed 18 May 2022].
- 58.Neavling S. 2020. Michigan recalls numerous varieties of marijuana flower sold at nine dispensaries statewide. Detroit Metro Times, 17 September 2020. https://www.metrotimes.com/weed/michigan-recalls-numerous-varieties-of-marijuana-flower-sold-at-nine-dispensaries-statewide-25365419 [accessed 18 May 2022].
- 59.Witsil F. 2021. Michigan marijuana may be contaminated with mold, testing labs warn. Detroit Free Press, 27 January 2021. https://www.freep.com/story/news/local/michigan/2021/01/27/michigan-cannabis-contaminated-mold/4274212001/ [accessed 18 May 2022].
- 60.MJBizDaily. 2020. Three Nevada marijuana retailers accused of selling contaminated flower. MJBizDaily, 29 July 2020. https://mjbizdaily.com/three-nevada-marijuana-retailers-accused-of-selling-contaminated-flower/ [accessed 18 May 2022].
- 61.Mitchell T. 2020. Durango dispensary issues recall over pesticide concerns. Westword, 10 July 2020. https://www.westword.com/marijuana/durango-marijuana-dispensary-pesticide-recall-11742452 [accessed 18 May 2022].
- 62.Burns G. 2021. Michigan officials have ‘no comment’ on how contaminated marijuana made it to store shelves. MLive, 4 October 2021. https://www.mlive.com/public-interest/2021/10/michigan-officials-have-no-comment-on-how-contaminated-marijuana-made-it-to-store-shelves.html [accessed 18 May 2022].
- 63.KOIN. 2021. OLCC recalls marijuana products contaminated by pesticide. KOIN, 6 January 2021. https://www.koin.com/news/oregon/olcc-recalls-marijuana-products-contaminated-by-pesticide/ [accessed 18 May 2022].
- 64.Mitchell T. 2021. Heavy metals contaminant sparks latest marijuana recall. Westword, 2 April 2021. https://www.westword.com/marijuana/heavy-metals-contaminant-sparks-colorado-marijuana-recall-11933203 [accessed 18 May 2022].
- 65.Borchardt J. 2020. Ohio recalls medical marijuana chocolates sold at 8 dispensaries. Cincinnati Enquirer, 2 October 2020. https://www.cincinnati.com/story/news/2020/10/02/ohio-recalls-medical-marijuana-chocolates-sold-8-dispensaries/5895081002/ [accessed 18 May 2022].
- 66.Michigan Marijuana Regulatory Agency. 2020. Marijuana regulatory agency recalls contaminated pre-rolls, suspends processor licenses pending investigation. 6 August 2020. https://www.michigan.gov/mra/news-releases/2020/08/06/marijuana-regulatory-agency-recalls-contaminated-pre-rolls-suspends-processor-licenses-pending-inve [accessed 29 June 2022].
- 67.Feeney MP, Bega D, Kluger BM, Stoessl AJ, Evers CM, De Leon R, et al. 2021. Weeding through the haze: a survey on cannabis use among people living with Parkinson’s disease in the US. NPJ Parkinsons Dis 7(1):21, PMID: , 10.1038/s41531-021-00165-y. [DOI] [PMC free article] [PubMed] [Google Scholar]
- 68.Kindred JH, Li K, Ketelhut NB, Proessl F, Fling BW, Honce JM, et al. 2017. Cannabis use in people with Parkinson’s disease and multiple sclerosis: a web-based investigation. Complement Ther Med 33:99–104, PMID: , 10.1016/j.ctim.2017.07.002. [DOI] [PubMed] [Google Scholar]
- 69.Seltenrich N. 2019. Into the weeds: regulating pesticides in cannabis. Environ Health Perspect 127(4):42001, PMID: , 10.1289/EHP5265. [DOI] [PMC free article] [PubMed] [Google Scholar]
- 70.Seltenrich N. 2019. Cannabis contaminants: regulating solvents, microbes, and metals in legal weed. Environ Health Perspect 127(8):82001, PMID: , 10.1289/EHP5785. [DOI] [PMC free article] [PubMed] [Google Scholar]
- 71.Ellsworth J. 2019. Modeling cannabis safety from food and beverage quality regulations. Food Safety Tech, 22 October 2019. https://foodsafetytech.com/column/modeling-cannabis-safety-from-food-and-beverage-quality-regulations/ [accessed 18 May 2022].
- 72.Wilson SH, Bodwitch H, Carah J, Daane KM, Getz CM, Grantham TE, et al. 2019. First known survey of cannabis production practices in California. Calif Agric (Berkeley) 73(3):119–127, 10.3733/ca.2019a0015. [DOI] [Google Scholar]
- 73.Evoy R, Kincl L. 2020. Evaluation of pesticides found in Oregon cannabis from 2016 to 2017. Ann Work Expo Health 64(7):770–774, PMID: , 10.1093/annweh/wxz075. [DOI] [PubMed] [Google Scholar]
- 74.Moulins JR, Blais M, Montsion K, Tully J, Mohan W, Gagnon M, et al. 2018. Multiresidue method of analysis of pesticides in medical cannabis. J AOAC Int 101(6):1948–1960, PMID: , 10.5740/jaoacint.17-0495. [DOI] [PubMed] [Google Scholar]
- 75.Kerr A, Walston V, Wong VSS, Kellogg M, Ernst L. 2019. Marijuana use among patients with epilepsy at a tertiary care center. Epilepsy Behav 97:144–148, PMID: , 10.1016/j.yebeh.2019.05.037. [DOI] [PMC free article] [PubMed] [Google Scholar]
- 76.Pergam SA, Woodfield MC, Lee CM, Cheng GS, Baker KK, Marquis SR, et al. 2017. Cannabis use among patients at a comprehensive cancer center in a state with legalized medicinal and recreational use. Cancer 123(22):4488–4497, PMID: , 10.1002/cncr.30879. [DOI] [PMC free article] [PubMed] [Google Scholar]
- 77.Health Canada. 2017. Clarification from Health Canada on myclobutanil and cannabis. https://www.canada.ca/en/health-canada/news/2017/03/clarification_fromhealthcanadaonmyclobutanilandcannabis.html [accessed 29 June 2022].
- 78.Suraev A, Benson MJ, Martin L, Lintzeris N, McGregor IS. 2022. Determination of contaminants in artisanal cannabis products used for childhood epilepsy in the Australian community: a sub-analysis of the ‘PELICAN’ study. Epilepsy Behav 127:108496, PMID: , 10.1016/j.yebeh.2021.108496. [DOI] [PubMed] [Google Scholar]
Associated Data
This section collects any data citations, data availability statements, or supplementary materials included in this article.