Abstract
Recent studies have confirmed the role of miRNA regulation of gene expression in oncogenesis for various cancers. In parallel, prior knowledge about relationships between miRNA and mRNA have been accumulated from biological experiments or statistical analyses. Improved identification of disease-associated miRNA-mRNA pairs may be achieved by incorporating prior knowledge into integrative genomic analyses. In this study we focus on 39 patients with hepatocellular carcinoma (HCC) and 25 patients with liver cirrhosis and use a flexible Bayesian two-step integrative method. We found 66 significant miRNA-mRNA pairs, several of which contain molecules that have previously been identified as potential important biomarkers. These results demonstrate the utility of the proposed approach in providing a better understanding of relationships between different biological levels, thereby giving insights into the biological mechanisms underlying the diseases, while providing a better selection of biomarkers that may serve as diagnostic, prognostic, or therapeutic biomarker candidates.
Keywords: hepatocellular carcinoma, graphical models, integrative models, liver cirrhosis prior knowledge, Bayesian variable selection
I. INTRODUCTION
Hepatocellular carcinoma (HCC) is the most common type of liver cancer and the third cause of cancer deaths worldwide [1]. In many cases, HCC occurs in people with liver cirrhosis (CIRR) which complicates the detection of symptoms during early stages. As a result, HCC is diagnosed at advanced stages qualifying it as an aggressive cancer. The known diagnostic markers have low sensitivity for early detection [2]. The identification of novel diagnostic biomarkers for early detection of HCC is therefore still an active research of area.
The role of microRNAs (miRNAs) in many biological processes such as differentiation, cell signaling, and pathways supporting cancer stemness is crucial. A better understanding of their implication in biological processes underlying diseases may be achieved through linking miRNAs to respective target genes. Many studies have established that miRNA-mRNA pairs play a critical role in the activation of oncogenic or carcinogenesis pathways as, for example, in prostate cancer, liver diseases or HCC. These results highlight the great utility of miRNAs as biomarkers of diagnosis/prognosis and disease progression. While several studies have reported miRNA-mRNA pairs with opposite expression patterns, experimentally validated results obtained in some cancers have also revealed dual-upregulation of miRNA-mRNA pairs. Although those results are promising, the characterization of relationships between miRNA and mRNA is still a challenge, notably because each miRNA has multiple mRNA targets and vice-versa. Innovative approaches are therefore required. In addition, it could be important to take into account the connections between mRNAs through miRNAs or other factors.
The advances of high-throughput technologies along with the development of relevant statistical and bioinformatics methods for analyzing omic data enhance the capacity to identify relevant molecular targets and may lighten the long process of identification. The integrative analysis of different sources of data has led to significant results by offering a better understanding of complex biological mechanisms through the discovery of new relationships between disease and biological features from different biological levels [3]. In addition, in various domains the integration of prior knowledge into statistical models has led to promising results.
Gaining insights into the mechanistic differences between HCC and CIRR contributes greatly to improving the detection of important biological features. In this paper, we introduce a Bayesian two-step integrative procedure extending the hierarchical integrative model (HIM) proposed by [4], [3], and adapted by [5], for analyzing miRNA-seq and mRNA-seq data from patients with HCC or CIRR. The goals are to improve the knowledge about the relationships between miRNAs and mRNAs, as well as among mRNAs after considering the effects of miRNAs, and to identify relevant disease-associated miRNA-mRNA pairs. In a first step, we combine a Bayesian variable selection approach integrating prior knowledge about the relationships between miRNA and mRNA with a Gaussian graphical model. This allows us to identify relationships between markers from both biological levels as well as to estimate a gene network adjusted for the effects of miRNAs. Then, a second model integrating the information obtained in the first step is used to jointly analyze miRNAs and mRNAs and to discover miRNA-mRNA pairs discriminating HCC and CIRR.
II. METHODS
A. Samples
Human liver tissues from 64 adult patients recruited at MedStar Georgetown University Hospital through a protocol approved by the Georgetown IRB were considered in this analysis. All subjects signed informed consent forms and HIPAA authorization forms. Table I provides the characteristics for the 39 HCC cases and 25 patients with CIRR whose samples have been analyzed by various platforms to acquire multi-omic data. 23% of HCC cases have histologically verified adjacent CIRR tissues. Diagnostic imaging criteria and/or histology that are well-established have been used to diagnose the HCC cases.
TABLE I.
Characteristics of patient-derived samples
| HCC (N=39) | CIRR (N=25) | p-value | ||
|---|---|---|---|---|
|
| ||||
| Age | Mean(SD) | 62.02 (11.46) | 50.05 (12.1) | 0.0013 |
| Gender | Male | 77% | 72% | 0.7683 |
| Race | EA | 41% | 64% | |
| AA | 33% | 32% | ||
| Asian | 26% | 0% | ||
| other | 0% | 4% | ||
B. miRNA-seq and mRNA-seq data
RNA samples extracted from the 64 liver tissues were analyzed by Illumina Hiseq 4000 using 150 bp paired-end (PE150) for RNA-seq expression profiling and by Illumina NextSeq 550 platform using 2×150 bp paired-end (PE150) for miRNA-seq expression profiling. More details are available in [6]. RNA-seq and mi-RNA-seq data were Gaussianized before applying the subsequent analyses. We used the function huge.npn from the R package huge [7] which consists of applying a nonparanormal transformation that estimates the Gaussian copula by marginally transforming the variables using smooth functions.
In this paper we focused on a subset of 106 mRNAs from the mRNA-seq data that are selected in previous comparisons using the same dataset and are known to have some association with liver disease [8], [5], [6], [9]. Student t-tests with multiple testing adjustment were used to identify miRNAs with significant changes in their levels between HCC and CIRR. Using a p-value cut-off of 0.05 after false discovery rate correction, a total of 261 miRNAs out of the 2195 miRNAs from the miRNA-seq data were selected.
In order to integrate prior knowledge into statistical models, scores measuring the belief in the association between mRNAs and miRNAs were computed with Ingenuity Pathway Analysis (IPA) Target filter analysis tool [10], which extracts experimentally verified and predicted associations between between mRNA-miRNA pairs from multiple sources such as TargetScan Human or TarBase. Four values corresponding to different levels of confidence were considered based on IPA calls: 1 for experimentally observed associations, 0.75 for high predicted links, 0.5 for moderate predicted links, and 0 for associations that have not been experimentally observed or predicted.
C. Bayesian two-step integrative procedure
The proposed integrative model consists of two submodels (Fig. 1): a mechanistic submodel that relates miRNA and mRNA and a clinical submodel that relates the phenotypic outcome to mRNA and miRNA expression levels.
Fig. 1.
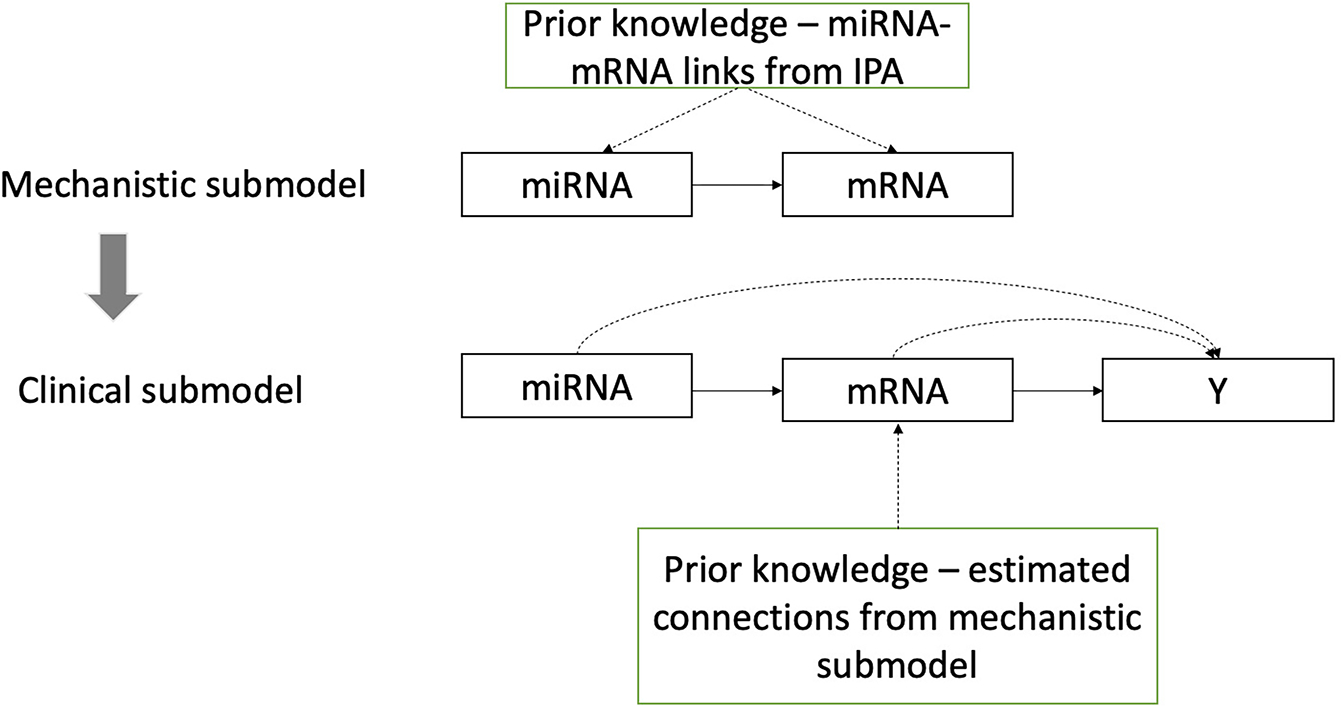
Bayesian two-step integrative procedure
a). Mechanistic submodel:
Bayesian variable selection using spike-and-slab prior [11], which consists in placing a discrete mixture distribution on regression coefficient, is used to identify miRNAs associated to each mRNA. Similarly to [12], prior knowledge was integrated into the model by including scores in the variable prior inclusion probabilities. miRNAs with posterior inclusion probability greater than 0.2 were selected. The expression level of an mRNA can thus be decomposed into two parts: the fitted values correspond to the part of the mRNA accounted for by miRNAs and the residuals corresponding to the remaining part explained by other unmeasured factors.
In order to study the relationships between mRNAs after adjusting for miRNAs, an undirected graph based on residuals is estimated by using a Gaussian graphical model (GGM) [13]. GGM has been widely used to estimate partial correlations, which correspond to correlations between variables corrected for all other variables under investigation. Thus, contrary to Pearson correlations which translate marginal relationships between variables, partial correlations help distinguish direct from indirect relationships between variables. An attractive aspect of partial correlations is their visualization via an undirected graph, where nodes are the variables and edges the dependencies between them. The absence of edges correspond to a conditional independence of two variables given the remaining variables. A lasso graphical algorithm [14] was used to estimate sparse undirected graph via the R package huge. The optimal regularization parameter was selected by using the stability approach to regularization selection (stars). A graph structure for gene expressions adjusted for miRNAs effects was therefore estimated, the corresponding graph is a covariate-adjusted Gaussian graph or conditional Gaussian graph [15]. We will refer to it as the adjusted graph. Note that the estimated partial correlation between two genes are now corrected for all other genes being analyzed and all miRNAs.
b). Clinical submodel:
The linear predictor of the probit model is modeled in terms of the mRNA expression profiles and the miRNA effects on disease status. The former may be decomposed into two parts corresponding to modulation via miRNAs (GmiRNA) and via other factors than miRNAs . The associated model is given by (1):
| (1) |
where corresponds to the set of mRNAs that had no related miRNA in the mechanistic submodel and corresponds to the set of miRNAs not found to be associated with any of the mRNAs in the mechanistic submodel. To simultaneously select relevant variables and account for the adjusted graph, a spike-and-slab approach integrating the dependence structure between mRNAs estimated by the graphical lasso model is applied [16]. In addition to selecting variables associated to the outcome this approach encourages choosing variables that have dependence structure. Variables with posterior inclusion probability greater than 0.1 were selected. As a result mRNAs, miRNAs, and miRNA-mRNA pairs associated with HCC status were identified.
III. Results
A. Mechanistic submodel
The mechanistic submodel relating each of the 106 mRNAs to the 261 miRNAs using a spike-and-slab variable selection method integrating prior knowledge about their relationships identified 371 miRNA-mRNA pairs. A subset of 166 miRNAs were related to at least one mRNA. Of the selected pairs, there were 22 experimentally verified pairs. For example, CAT was found to be associated with 9 miRNAs, 4 of which (hsa-miR-421, hsa-miR-4327, hsa-miR-4686, hsa-miR-556–3p) are known to target that mRNA.
Relationships between genes before adjusting for miRNAs were also investigated by estimating an undirected graph with a lasso graphical model. We refer to this as the unadjusted graph. The resulting graph contained 497 edges. ADAMTS13, ECM1, and PTH1R were identified as the most connected genes with 29 related edges. The adjusted graph estimated by considering mRNA expressions adjusted for miRNA effects contained 101 edges, 86 of which are in common with the unadjusted graph (see Table II). Thus, the majority of gene-gene interactions were not maintained after accounting for the miRNA regulation of these genes. The results are in line with those observed in previous studies: the edge number is reduced when accounting for potential confounder covariates. As an example, we focus on 5 genes that are connected in the unadjusted graph (left panel of Fig. 2) and conditionality independent in the adjusted graph (middle panel of Fig. 2). We also display the adjusted graph with the associated miRNAs (right panel of Fig. 2) for a better understanding. The direct relationship observed between SMPD3 and WDR66 in the unadjusted graph is mainly due to the regulation by a common miRNA (hsa-miR-200a-5p) modulating the expressions of both genes. Similarly, the edge that was present between LILRB5 and PIGU in the unadjusted graph disappears in the adjusted graph. Accounting for miRNA effects helps to clarify genes that are co-regulated by miRNA versus genes that are interacting through other mechanisms.
TABLE II.
Number of edges in the estimated unadjusted and adjusted graphs
| Undajusted graph | Adjusted graph | Common edges | |
|---|---|---|---|
|
| |||
| HCC +CIRR | 497 | 101 | 86 |
| HCC | 247 | 171 | 74 |
| CIRR | 92 | 59 | 4 |
Fig. 2.

Unadjusted graph (left), adjusted graph (middle), and adjusted graph with associated miRNAs (right)
Unchanged connections across the unadjusted and adjusted graphs evidence dependence due to biological factors other than miRNAs. For example, TERT and STAB2 remain connected in both graphs. As connections between those genes are the same in the undajusted and adjusted graphs, we only display the adjusted graph (left panel of Fig. 3) and the adjusted graph with the associated miRNAs (right panel of Fig. 3).
Fig. 3.
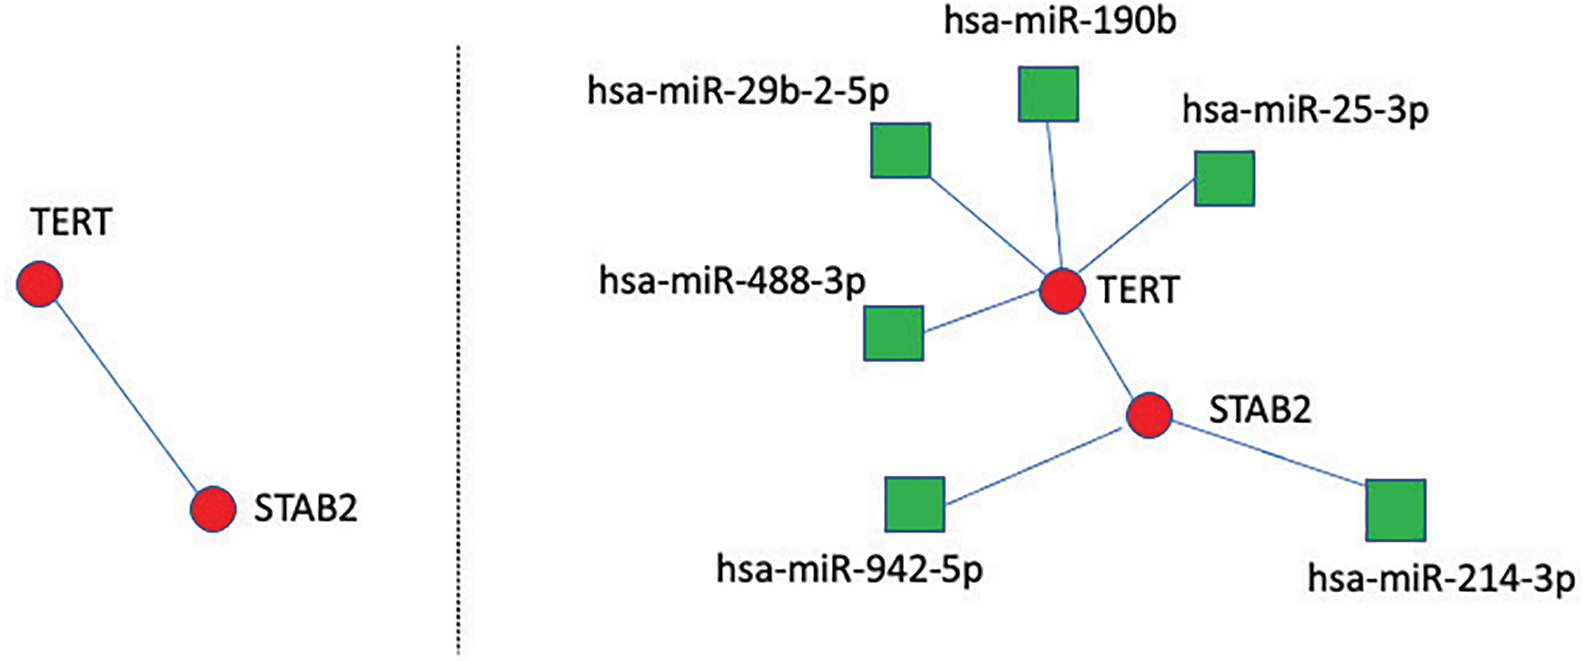
Adjusted graph (left) and adjusted graph with associated miRNAs (right)
The same approaches (spike-and slab prior integrating prior knowledge and estimation of unadjusted and adjusted graphs) were applied separately on HCC cases and patients with cirrhosis. The results are reported in Table II. We observe that the number of connections in the unadjusted graphs, when considering the two groups independently, is reduced in particular for CIRR group. A denser graph in HCC cases may indicate that the considered subset of genes is mostly connected in HCC. We also observed than the sizes of the adjusted graphs are smaller than that of the unadjusted graphs in each disease group. To compare the graphs between the two groups we performed a differential network analysis via the R package iDINGO [17]. Partial correlations were computed by using a Gaussian graphical model based on the raw gene expressions and the gene expressions adjusted for miRNAs effects. Fig. 4 presents the partial correlations in HCC versus CIRR. Pairs with a p-value less than 0.05 and with absolute values of the differential scores and partial correlations greater than 3 and 0.1, respectively, are labeled on the plots. While most pairs of genes have similar partial correlations for the unadjusted graphs, partial correlations for HCC and CIRR are more contrasted for the adjusted graphs. Among the selected mRNA-miRNA pairs in both groups, 29 are in common. Of those, 8 are also identified when analyzing the two groups. For example the pair BCL9 - hsa-miR-378d is identified in all three analyses. We emphasize that the results obtained for each group analyzed separately need to be considered with caution since the small sample size may lead to a lack of statistical power and to computational instability.
Fig. 4.
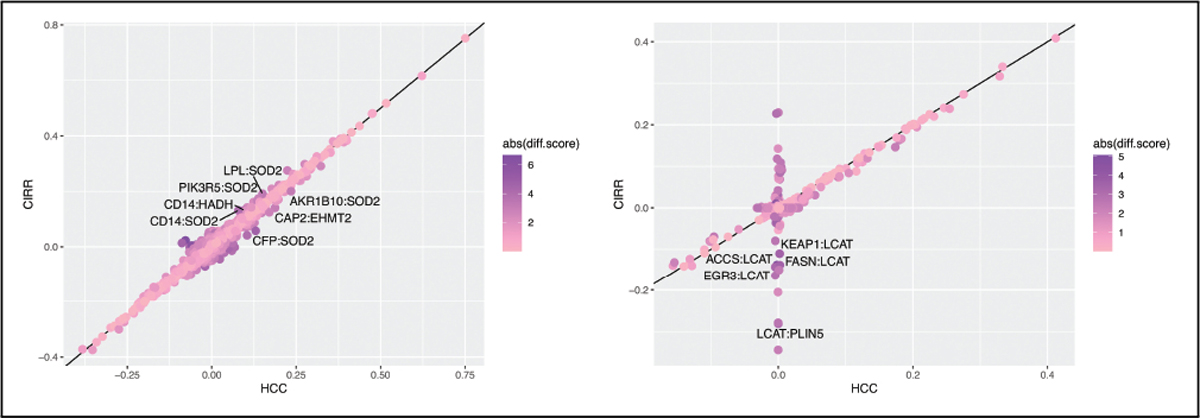
Partial correlations for HCC versus CIRR based on unadjusted graphs (on left) and adjusted graphs (on right)
B. Clinical submodel
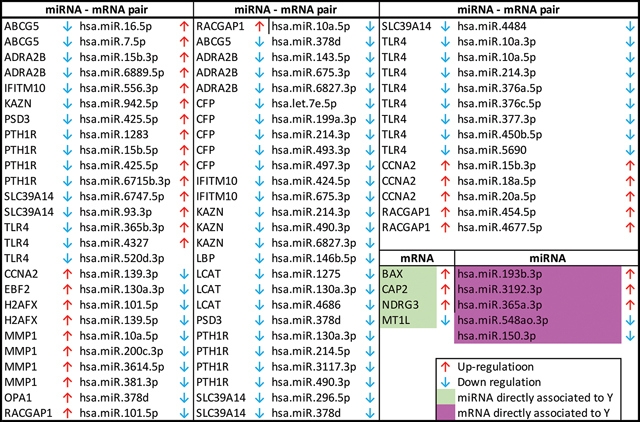
The clinical submodel selected 21 mRNAs, 5 miRNAs and 66 miRNA-mRNA pairs. Among them, 17 genes have expression levels that are modulated by miRNAs leading to 66 miRNA-mRNA pairs, and 4 have expression levels modulated by biological features other than their associated miRNAs. 5 miRNAs (hsa-miR-150–3p, hsa-miR-193–3p, hsa-miR-3192–3p, hsa-miR-365a-3p, hsa-miR-548ao-3p) are found to be directly associated to HCC (see Table A1 in the Appendix). Three of the 66 disease associated miRNA-mRNA pairs are experimentally verified (ADRA2B - hsa-miR-6889–5p, CFP - hsa-493–3p, SLC39A14 - has-296–5p). There are also a few molecules identified in the selected pairs that are involved in experimentally verified pairs. As for example miRNA hsa-miR-7–5p, which found to be related to ABCG5 in our model, is also targeting TLR4. These two genes belong to LXR/RXR pathway. Fig. 5 presents boxplots of expression levels across disease status associated to the three experimentally verified pairs. While ADRA2B and hsa-miR-6889–5p have opposite expression patterns, dual-downregulation is observed for CFP and hsa-493–3p, and SLC39A14 and hsa-296–5p.
Fig. 5.
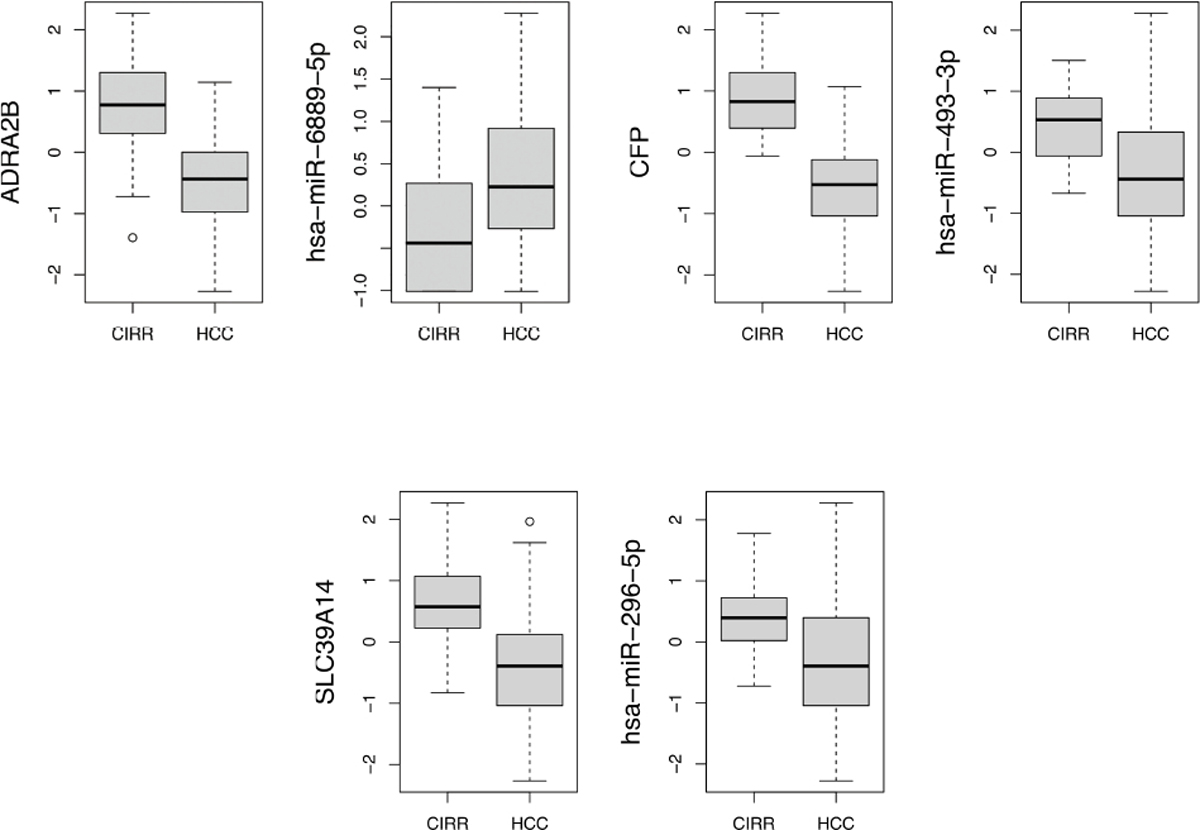
Boxplots of miRNA and mRNA expressions across disease status for three experimentally verified pairs.
A pathway analysis on the miRNAs and mRNAs selected from the clinical submodel was performed using the Ingenuity Pathway Analysis (IPA) tool. Fig. 7 represents the top 10 pathways selected using the molecules from the clinical model using the spike-and-slab prior. The overlapping canonical pathways are shown as a network where each pathway is a single node colored proportionally p-value, where brighter red represents a more significantly enriched pathway. LXR/RXR activation pathway and Hepatic Fibrosis/Hepatic Stellate Cell Activation, Role of MAPK Signaling, and INOS Signaling pathways have been significantly enriched from our analysis. Accumulating evidence demonstrated that LXR is a potential prognostic marker and exerted significant antitumor effect in HCC. Our previous studies have also reported these pathways to the significantly enriched in HCC [9], [18].
Fig. 7.
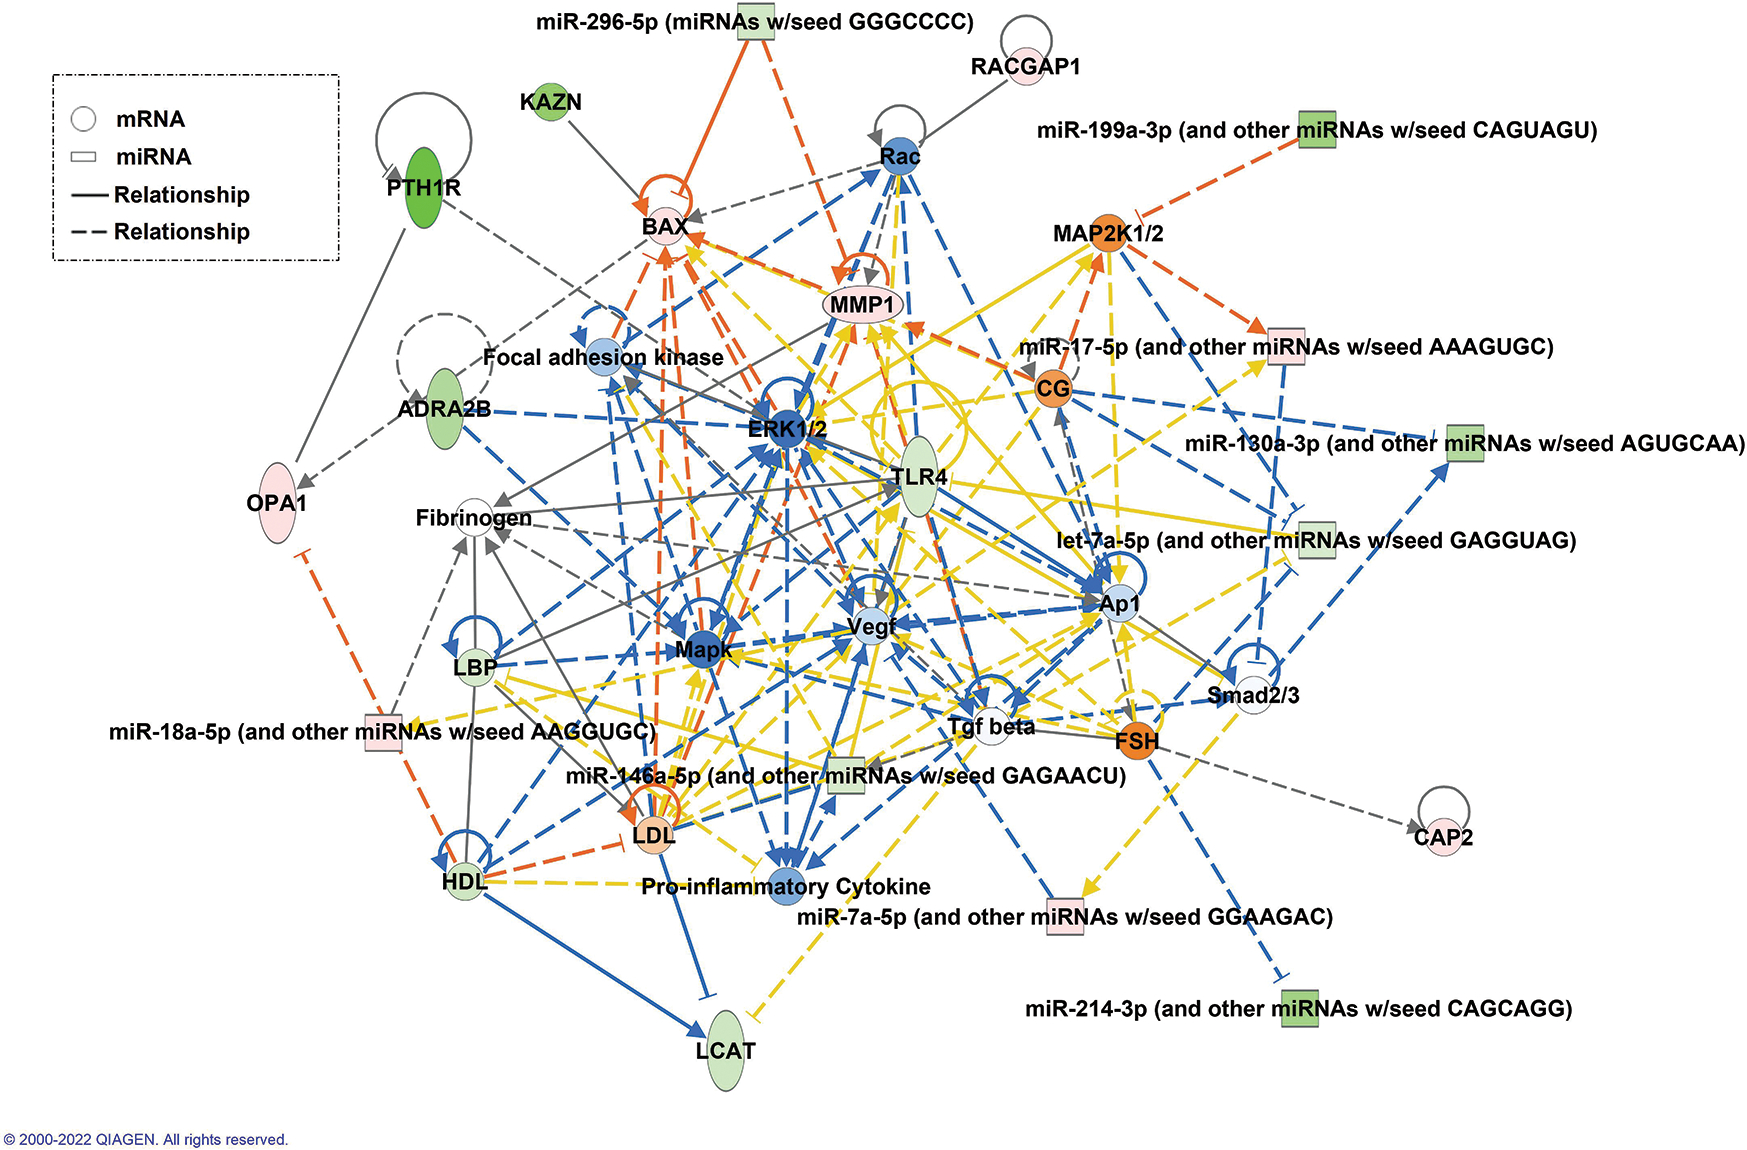
Network generated using the miRNAs and mRNAs selected from the clinical model using IPA. Green molecules are downregulated and red molecules are upregulated.
Fig. 7 shows the network generated using the molecules from the clinical model. The molecules in this network are mainly involved in cancer, organismal injury and abnormalities, reproductive system disease, and gastro intestinal diseases. We also observed a few overlaps in the miRNA-mRNA relationships that we observed in the data model. For example, miR-146a-5p and LBP pair overlaps in our model and the network generated by IPA. Down regulation of miR-146a-5p and its targets in HCC has been reported to play a tumor-suppressive role [19].
IV. Discussion
With regards to the mechanistic model, the integration of prior knowledge helped identify 22 experimentally verified miRNA-mRNA pairs. The proposed approach was also able to identify 349 novel miRNA-mRNA pairs, some of which were revealed to be associated with the disease status in the clinical submodel. The integration of prior knowledge into the analysis helps complement the information in the data and can reinforce the existing evidence as well as lead to new discoveries.
Through the estimation of adjusted and unadjusted graphs we pointed out that, although a direct application of GGM on gene expressions data provided some insights into gene regulation at the expression level, adjusting for the effects of miRNAs on mRNA expressions improved the understanding of relationships between genes. The results revealed some genes with unchanged connections in the adjusted and unadjusted graphs indicating genes that are dependent conditionally to other genes and all miRNAs. On the other hand, some connections disappeared once the effects of miRNAs are accounted for, underlying a dependence most likely due to miRNAs. As a result a finer understanding of dependence sources between genes was achieved.
The clinical submodel allowed to select 21 mRNAs, 5 miRNAs, and 66 miRNA-mRNA pairs associated to disease status. The network and pathway analyses helped us to narrow down to the most important mRNAs and miRNAs as well as miRNA-mRNA pairs that are more relevant to study HCC. The molecules are found to be involved in important pathways that are associated with HCC. These results underlined the potential of integrating the proposed approach in selecting markers associated with HCC in a larger study containing more samples and molecules.
V. CONCLUSIONS
The identification of relevant biomarkers of HCC is essential to obtain a better diagnosis in early stages and improve understanding of complex biological mechanisms underlying HCC. In this paper, we proposed a Bayesian two-step integrative procedure extending the initial approach developed by [4], [3]. The extension lies in the integration of knowledge from various sources at the different stages of the modeling. Here, the mechanistic submodel used prior knowledge from an external database, IPA in this case. The clinical submodel integrated as prior knowledge the connections estimated by the graphical lasso in the mechanistic submodel. In addition to helping statistical models lessen the challenge of ill-posed problems, these types of prior knowledge integration into the analysis provide a better understanding of relationships between biological features (between miRNAs and mRNAs, as well as between mRNAs in our application). They also help identify biologically relevant biomarkers for the phenotype under investigation. The findings, of course, need to be experimentally validated to confirm their potentials as diagnostic or prognostic biomarkers. This preliminary study will be complemented/followed by larger studies containing a higher number of mRNAs and miRNAs and where biological molecules from another biological level, such as metabolome, will be integrated.
Fig. 6.
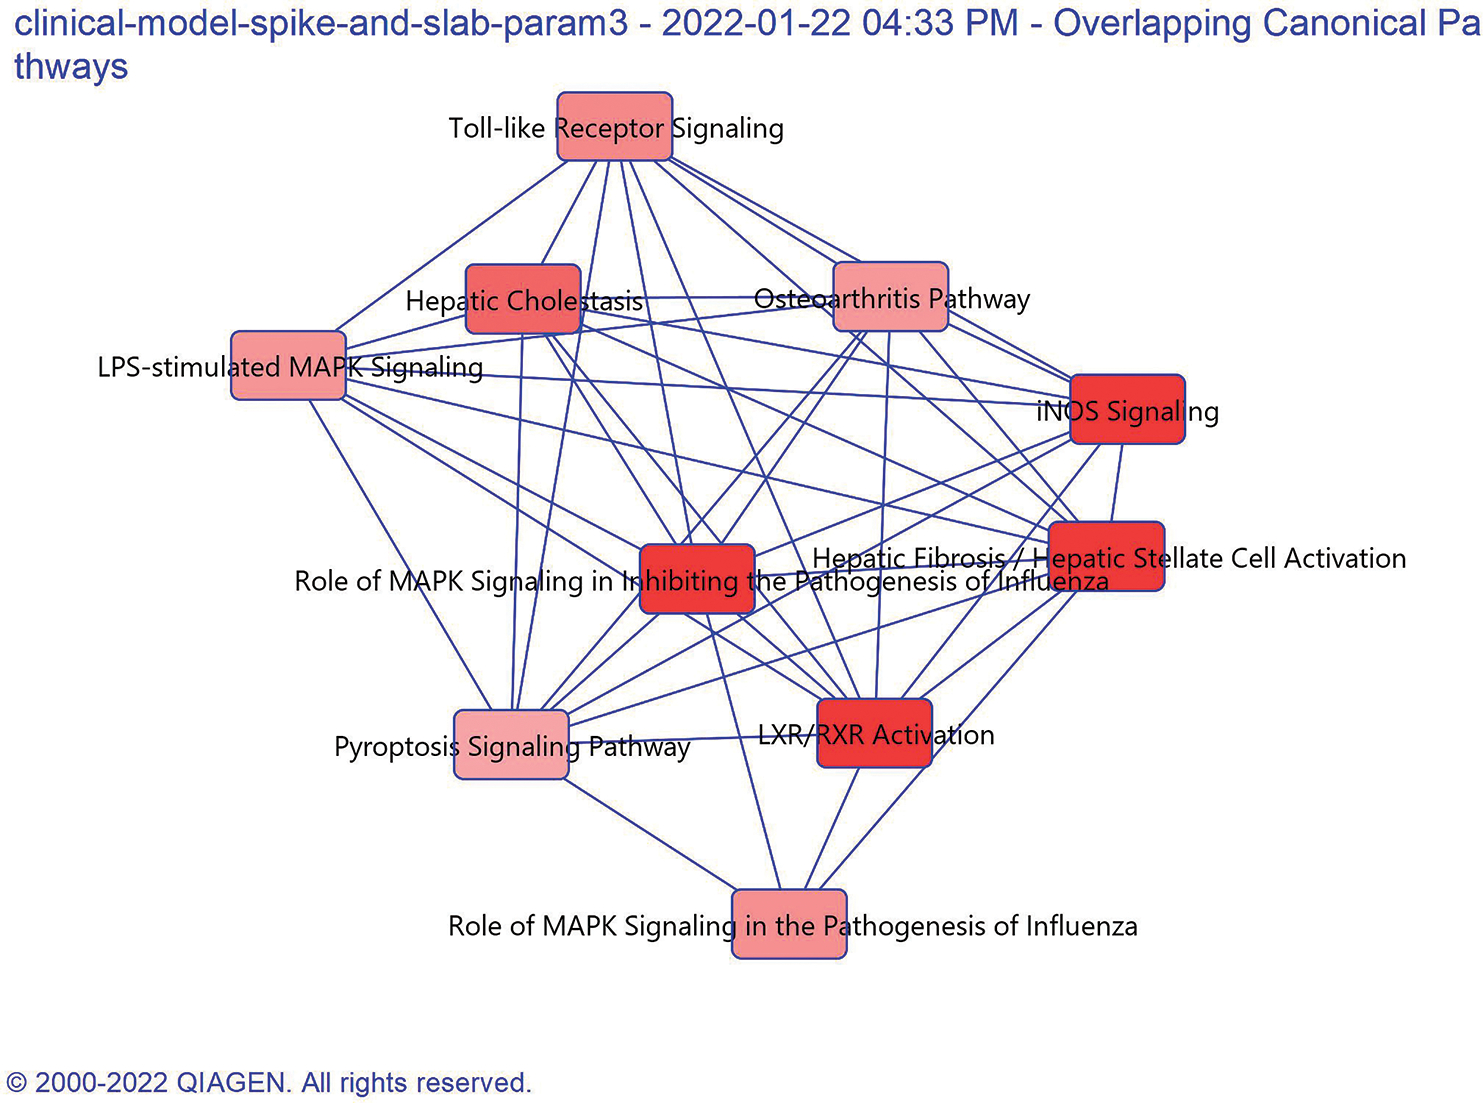
Top 10 pathways represented by the molecules selected from the clinical model. The connections show that one or more molecule is common across multiple pathways. The darker red color shows that the pathways has higher significance
ACKNOWLEDGMENT
This work is supported by National Institute of General Medical Sciences and the National Cancer Institute of the National Institutes of Health under Award Numbers R35GM141944 and U01CA185188. M.D. is fully supported by the European Union’s Horizon 2020 Research and Innovation programme under grant agreement No 840383. This research was completed while M.D. was hosted by Georgetown University as part of the outgoing phase of the grant.
APPENDIX
TABLE A1.
mRNAs, miRNAs, and miRNA-mRNA pairs identified by the clinical submodel. An upward arrow denotes a positive fold change and a downward arrow denotes a negative fold change when comparing HCC vs CIRR.
|
References
- [1].Ferlay J, Colombet M, Soerjomataram I, Mathers C, Parkin DM, Piñeros M, ..., and Bray F, Estimating the global cancer incidence and mortality in 2018: GLOBOCAN sources and methods, International journal of cancer, vol 144(8), pp: 19411953, 2019 [DOI] [PubMed] [Google Scholar]
- [2].Chauhan R, and Lahiri N, Tissue-and serum-associated biomarkers of hepatocellular carcinoma. Biomarkers in cancer, 8, BIC-S34413, 2016 [DOI] [PMC free article] [PubMed] [Google Scholar]
- [3].Denis M and Tadesse MG, Evaluation of hierarchical models for integrative genomic analyses, Bioinformatics, vol: 32(5), pp738746, 2016 [DOI] [PMC free article] [PubMed] [Google Scholar]
- [4].Jennings EM, Morris JS, Carroll RJ, Manyam GC, and Baladandayuthapani V, Bayesian methods for expression-based integration of various types of genomics data. EURASIP Journal on Bioinformatics and Systems Biology, vol: 2013(1), pp: 111, 2013 [DOI] [PMC free article] [PubMed] [Google Scholar]
- [5].Varghese RS, Zhou Y, Barefoot M, Chen Y, Di Poto C, Balla AK, ..., and Ressom HW, Identification of miRNA-mRNA associations in hepatocellular carcinoma using hierarchical integrative model, BMC medical genomics, vol. 13(1), pp 114, 2020 [DOI] [PMC free article] [PubMed] [Google Scholar]
- [6].Chen Y, Barefoot ME, Varghese R, Wang K, Di Poto C, Ressom HW, Integrative Analysis to Identify Race-Associated Metabolite Biomarkers for Hepatocellular Carcinoma, 42nd Annual International Conference of the IEEE Engineering in Medicine & Biology Society (EMBC), pp 53005303, 2020 [DOI] [PMC free article] [PubMed] [Google Scholar]
- [7].Zhao T, Liu H, Roeder K, Lafferty J, and Wasserman L, The huge package for high-dimensional undirected graph estimation in R, The Journal of Machine Learning Research, vol: 13(1), pp: 10591062, 2012 [PMC free article] [PubMed] [Google Scholar]
- [8].Varghese RS, Barefoot M, Chen Y, Zhang Y, Alley A, Kroemer AH, ... and Ressom HW, Integrative analysis of DNA methylation and microRNA expression reveals mechanisms of racial heterogeneity in hepatocellular carcinoma, Frontiers in genetics, 1575, 2021 [DOI] [PMC free article] [PubMed] [Google Scholar]
- [9].Barefoot ME, Varghese RS, Zhou Y, Di Poto C, Ferrarini A, and Ressom HW, Multi-omic Pathway and Network Analysis to Identify Biomarkers for Hepatocellular Carcinoma. In 2019 41st Annual International Conference of the IEEE Engineering in Medicine and Biology Society (EMBC), pp: 13501354, IEEE, 2019 [DOI] [PMC free article] [PubMed] [Google Scholar]
- [10].Causal analysis approaches in Ingenuity Pathway Analysis, Bioinformatics, vol: 30(4), pp: 523530, 2014 [DOI] [PMC free article] [PubMed] [Google Scholar]
- [11].Mitchell TJ, and Beauchamp JJ, Bayesian variable selection in linear regression. Journal of the american statistical association, vol: 83(404), pp: 10231032, 1988 [Google Scholar]
- [12].Stingo FC, Chen YA, Vannucci M, Barrier M, and Mirkes PE, A Bayesian graphical modeling approach to microRNA regulatory network inference, The annals of applied statistics, vol: 4(4), pp: 2024, 2010 [DOI] [PMC free article] [PubMed] [Google Scholar]
- [13].Dempster AP, Covariance selection, Biometrics, pages 157175, 1972 [Google Scholar]
- [14].Friedman J, Hastie T, and Tibshirani R, Sparse inverse covariance estimation with the graphical lasso, Biostatistics, vol: 9(3), pp: 432441, 2008 [DOI] [PMC free article] [PubMed] [Google Scholar]
- [15].Cai TT, Li H, Liu W, and Xie J, Covariate-adjusted precision matrix estimation with an application in genetical genomics, Biometrika, vol. 100, pp 139156, 2013 [DOI] [PMC free article] [PubMed] [Google Scholar]
- [16].Peterson CB, Stingo FC, and Vannucci M, Joint Bayesian variable and graph selection for regression models with network-structured predictors, Statistics in medicine, vol: 35(7), pp: 10171031, 2016 [DOI] [PMC free article] [PubMed] [Google Scholar]
- [17].Class CA, Ha MJ, Baladandayuthapani V, and Do KA, iDINGO—integrative differential network analysis in genomics with Shiny application, Bioinformatics, vol: 34(7), pp: 12431245, 2018 [DOI] [PMC free article] [PubMed] [Google Scholar]
- [18].Zhong D, Lyu X, Fu X, Xie P, Liu M, He F, and Huang G, Upregulation of miR-124–3p by liver X receptor inhibits the growth of hepatocellular carcinoma cells via suppressing cyclin D1 and CDK6. Technology in Cancer Research and Treatment, 19, 1533033820967473, 2020 [DOI] [PMC free article] [PubMed] [Google Scholar]
- [19].Zhang X, Ye ZH, Liang HW, Ren FH, Li P, Dang YW, and Chen G, Down-regulation of miR-146a-5p and its potential targets in hepatocellular carcinoma validated by a TCGA-and GEO-based study, FEBS Open Bio, vol: 7(4), pp: 504521, 2017 [DOI] [PMC free article] [PubMed] [Google Scholar]
- [20].Valinezhad Orang A, Safaralizadeh R, and Kazemzadeh-Bavili M, Mechanisms of miRNA-mediated gene regulation from common downregulation to mRNA-specific upregulation. International journal of genomics, 2014. [DOI] [PMC free article] [PubMed] [Google Scholar]


