Abstract
Current technologies still face a big challenge to achieve simultaneous rapid qualitative and quantitative detection of trypsin. In our present study, we developed a simple and effective strategy to sensitively, qualitatively and quantitatively analyze the activity of trypsin using a fluorescent polystyrene (PS) microsphere probe. PS spheres were first functionalized by the surface coating of polyethylene glycol (PEG), which could significantly decrease the possibility of nonspecific physical adsorption of the fluorescein isothiocyanate isomer-modified peptide (peptide-FITC). Then, the obtained PS-PEG spheres were chemically interacted with peptide-FITC, which were then employed to monitor the real-time activity of trypsin. The peptide used in our work contained rich lysine and arginine residues, which were the recognition sites of trypsin. When trypsin interacted with the PS-FITC-peptide microspheres, the peptide-FITC rapidly decomposed into free small fragments in solution, resulting in a gradual decrease in the fluorescence of the PS spheres. By taking advantage of the fluorescence changes using confocal microscopy imaging and fluorescence spectrum intensity, it is easy to achieve the qualitative and quantitative detection of trypsin, with a highly sensitive detection limit as low as 0.5 ng mL−1 and high selectivity. Thus, the designed fluorescent PS microsphere probe would be very promising in various applications such as food safety inspection, personal healthcare and on-site environmental monitoring.
The fluorescent PS-PEG-peptide-FITC microsphere probe was designed for real-time, qualitative and quantitative monitoring of trypsin activity.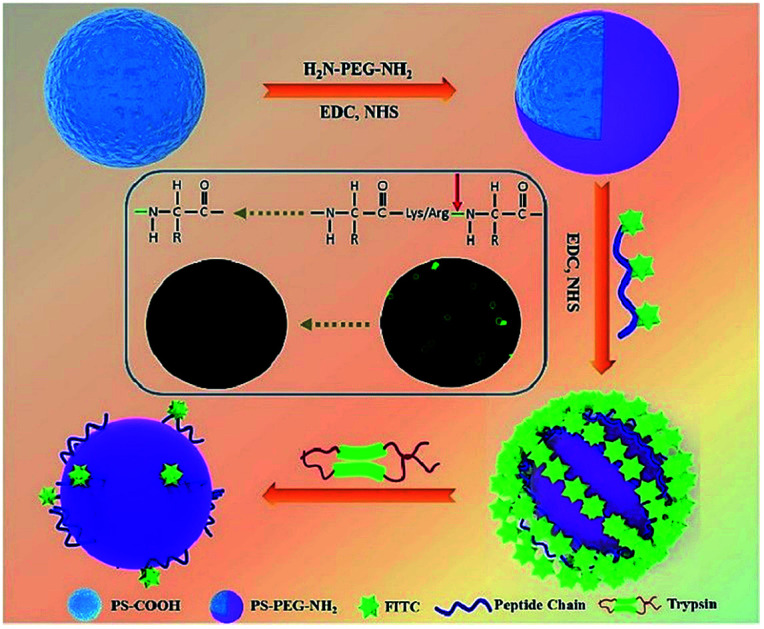
1. Introduction
Trypsin, engendered by the pancreas, is a proteolytic enzyme with considerable practical significance to pancreatic exocrine function.1,2 Compared to other proteolytic enzymes, trypsin possesses remarkable merits in fundamental research and practical applications. In biological systems, trypsin plays a critical role in targeting numerous important human recessive diseases such as pancreatitis and cystic fibrosis.3 In general, the serum trypsin concentration greatly differs between pancreatic patients and healthy individuals.4,5 Additionally, trypsin is universally applied in food chemistry to identify proteins.6,7 Therefore, the development of simple, selective and sensitive methods for the detection of trypsin is highly desirable.
Traditional methods for the determination of trypsin including enzyme-linked immunosorbent assay,8 gelatin-based film assay,9 and molecular imprinting technology10–12 are usually time-consuming and require expensive instruments.13,14 Nowadays, biosensors involving the fluorescent approach15–17 and electrochemical sensors are widely applied in the detection of trypsin due to their operational simplicity, extraordinary sensitivity and low-cost.2,18–23 Specifically, probe materials play a significant role in biosensors by improving the detection efficiency and sensitivity owing to their uniform size,24,25 biocompatibility,26,27 and water solubility.28 For instance, Zhuo et al. reported the detection of trypsin via a fluorescence method using DNA-stabilized silver nanocluster–peptide conjugates.22 However, conventional biosensors are often limited in detecting the activity and real-time changes in trypsin in certain systems, which is possibly due to the requirement of special labels and sophisticated instruments.5,29 Although some universal protease activity assay methods30–32 have been proposed, the detection process is conducted based on some indirect signal changes, such as electrical signal14 or fluorescent intensity. Additionally, direct activity characterization and real-time monitoring of trypsin activity still have not been implemented.33 Thus, achieving qualitative and quantitative detection for the activity of trypsin has great significance to investigate biological dynamic reaction processes.3,34 Confocal microscopy is a common tool for observing fluorescence images, which is usually applied in the field of biological imaging.35,36 Traditional fluorescence methods for the detection of trypsin are often conducted based on nanoparticles or their assemblies (size less than 200 nm), which make it impossible for acquiring fluorescence images.1,37,38
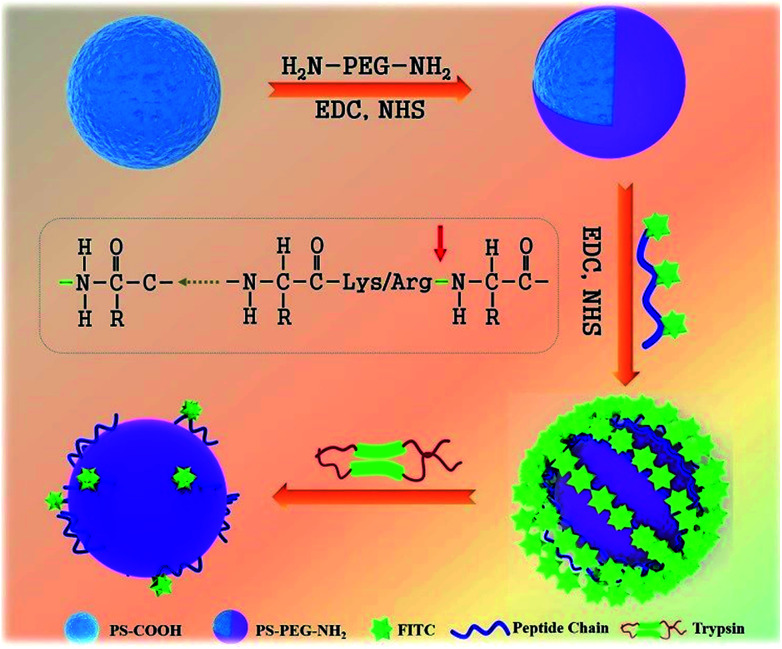
In our present study, we report a novel, rapid, and visible fluorescence sensing method to qualitatively and quantitatively detect the trypsin activity. A peptide chain with a fluorescent probe and special cleavage sites for trypsin was induced to monitor trypsin activity (Fig. 1). Firstly, commercial carboxylated polystyrene microspheres (PS-COOH) with a large size were modified with a protective PEG layer to avoid the nonspecific physical adsorption of peptide-FITC. Then, the peptide-FITC, which is rich in lysine and arginine residues, was grafted on the PS-PEG microspheres by chemical coupling. The interaction between peptide-FITC and trypsin could be observed by confocal microscopy and fluorescence spectroscopy, which make it possible to achieve the qualitative and quantitative detection of trypsin, respectively. Also, the influence of pH and shearing time on the detection of trypsin was systematically investigated. Most importantly, by developing a universal protease activity assay method, the trypsin activity is reflected intuitively in the fluorescence intensity of the fluorescent images and fluorescent spectra. In this case, the proposed fluorescent microsphere probe was applied for the real-time monitoring of trypsin activity.
Fig. 1. Schematic illustration of the PS-PEG-Pep-based trypsin determination biosensor.
2. Experimental
2.1. Materials and sample preparation
All chemicals were of analytical grade and used without further purification. Carboxylated polystyrene microspheres (PS-COOH, 10 μm, 5 wt%), bovine serum albumin (BSA) and trypsin were purchased from Aladdin Industrial Corporation. 1-Ethyl-3-(3-dimethylaminopropyl) carbodiimide (EDC, 98%) and N-hydroxysuccinimide (NHS, 98%) were purchased from Sigma-Aldrich Chemical Co. (St. Louis, MO, USA). Amine-PEG-amine (average MW 2000, 95%) was purchased from J&K Chemical Company. Phosphate buffer saline (PBS) was purchased from Sigma Chemical Company (St. Louis, MO). Fluorescein isothiocyanate isomer (FITC) was purchased from Thermo Fisher.
2.2. Synthesis of PEG modified PS microsphere (PS-PEG-NH2)
The surface functionalization of PS microspheres was conducted according to traditional “surface activation”34,43 with minor modifications. First, 0.5 mL of PS-COOH (1 g mL−1) was dispersed in 4.5 mL deionized water. Then, 226 μL 75 mM EDC and 15 mM NHS (13 μL) were added into the aforementioned solution sequentially between 10 s and 30 min. The resultant solution was centrifuged (7000 rpm, 10 min) to remove the residue. The obtained active PS-COOH solution was redispersed in 5 mL sodium phosphate buffer (10 mM, pH 8.0). Then, 1 mL NH2-PEG-NH2 PBS solution (10 mM) was added to the above solution, which was left to react overnight with mild stirring (400 rpm), followed by centrifugal washing three times to remove the excess NH2-PEG-NH2.
2.3. Synthesis of FITC modified peptide
The peptide solution (2 mg mL−1, 0.1 M sodium carbonate, pH 9.0) was firstly prepared. Fresh FITC was dissolved in DMSO at a concentration of 1 mg mL−1 in a darkened lab. Then, the FITC solution (50 to 100 μL) was slowly added to the protein solution with gentle stirring, and was left to react for at least 8 h at 4 °C in the dark. The reaction was quenched by the addition of ammonium chloride to a final concentration of 50 mM. Some protocols are also included at this point such as the addition of 0.1% xylene cylanol and 5% glycerol as a photon absorber and fluorescence stabilizer, respectively. The mixture is left to react for a further 2 h to stop the reaction by blocking the remaining isothiocyanate groups. The derivative is purified by gel filtration using PBS buffer or another suitable buffer for the particular protein being modified. To obtain complete separation, the column size should be 15 to 20 times the size of the applied sample.
2.4. Synthesis of peptide-modified PS-PEG (PS-PEG-Pep)
The procedure to obtain PS-PEG-Pep was the same as that for the preparation of PS-PEG-NH2. Firstly, 0.5 mL of peptide-FITC-COOH (3 mg mL−1) was diluted to 4.5 mL with deionized water. Then 75 mM EDC (226 μL) and 15 mM NHS (13 μL) were added to the aforementioned solution successively between 10 s and 30 min. The resultant solution was centrifuged (7000 rpm, 10 min) to remove the residue. The obtained active peptide-FITC-COOH solution was redispersed in 5 mL sodium phosphate buffer (10 mM, pH 8.0). Then, 1 mL PS-PEG-NH2 PBS solution (10 mM) was added to the above mixture to react for 2 h under mild stirring (400 rpm), followed by centrifugal washing three times to remove the excess PS-PEG-NH2.
2.5. Enzyme shearing experiment
1 mL PS-PEG-Pep (2 mg mL−1) solution was dissolved in 10 mL PBS solution (10 mM, pH 7.4). Trypsin solution with a certain concentration was prepared by dissolving trypsin power in PBS solution (10 mM, pH 7.4). A certain amount of trypsin solution was added to the prepared PS-PEG-Pep solution and stirred at 37 °C for 1 h. After centrifugation, the dispersion was characterized using confocal microscopy images. Additionally, a shearing experiment by changing the shearing pH and time was also conducted similar to the above steps.
Enzyme shearing experiments for the inactive enzyme and BSA were also conducted as references. The inactive enzyme was obtained by heating trypsin at 50 °C for 1 h. The testing conditions were kept the same as that for trypsin. After centrifugation, the dispersion was detected using confocal microscopy images.
2.6. Characterization
Transmission electron microscopy (TEM) was performed on a JEOL JEM-2100F instrument operating at 200 kV. Scanning electron microscopy (SEM) measurements were carried out on a JEOL JMS-6700F scanning microscope. Confocal microscopy images were acquired with a FluoView FV1000 Confocal Microscope (Olympus).
3. Results and discussion
3.1. Characterization of fluorescent microsphere probe
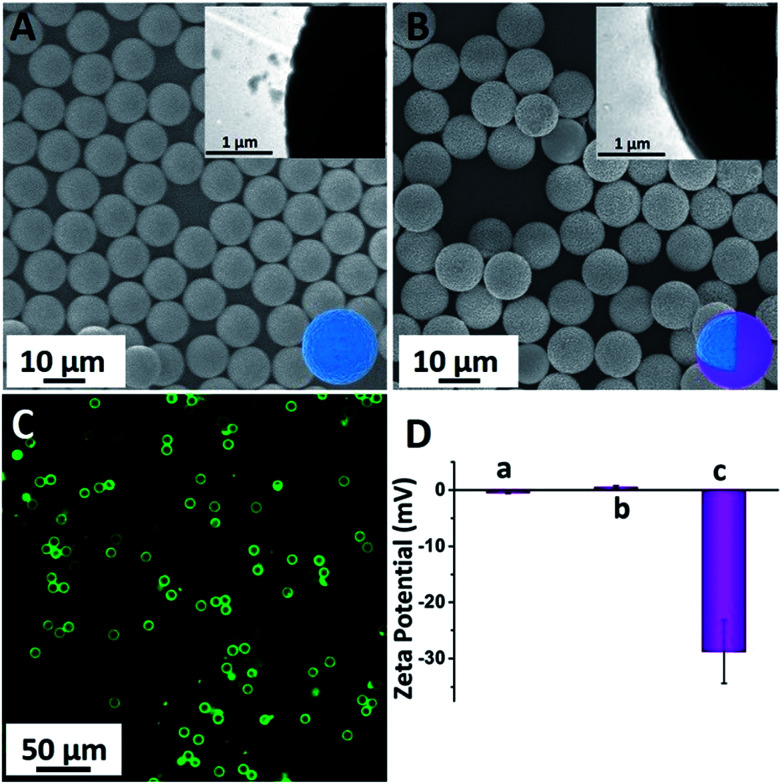
PS-COOH was commercially obtained and monodispersed with an average diameter of 10 μm (Fig. 2A). This large particle was chosen as the probe carrier because of two prominent advantages: (1) its large area provides possibility for loading more peptide-FITC and makes it more convenient for separation and (2) its large particle with average size of 10 μm makes it possible for visually monitoring the enzyme cleavage processes. As a protective shell and bridge between the PS microspheres and peptide-FITC, NH2-PEG-NH2 was grafted on the surface of the PS-COOH microspheres via an amide bond.39 Actually, the PEG coating was the dominant part for reducing nonspecific physical adsorption. As shown in Fig. 2A (inset), the rough and hydrophobic surface of PS was clearly visible due to its large size.40,41 The PEG shell effectively filled the grooves of the surface of the PS microspheres and further prevented the nonspecific adsorption of peptide-FITC. As shown in Fig. 2B and the inset, the surface became visibly smooth and the thickness of PEG was about 80 nm after PEG coating. As a result, the peptide-FITC could not invade the grooves on the surface of the PS spheres and the nonspecific physical adsorption was drastically reduced. In addition, PS-PEG-Pep-FITC was prepared using a similar amide bond method. As shown in Fig. 2C, the PS-PEG-Pep microspheres exhibited bright green fluorescence under a dark field, which directly confirmed that polypeptide was successfully grafted onto the PS-PEG microspheres. Importantly, there was almost no fluorescent residue in the background solution. Furthermore, the obvious potential changes of PS-COOH, PS-PEG-NH2 and PS-PEG-Pep-FITC-COOH are exhibited in Fig. 2D, which further confirmed the successful grafting of peptide-FITC on the PS-PEG microspheres.
Fig. 2. (A) SEM image of the commercial PS-COOH (the inset is the local enlarged image of PS-COOH), (B) SEM image of the commercial PS-PEG-NH2 (the inset is the local enlarged image of PS-PEG-NH2), (C) fluorescence image of PS-PEG-Pep under a dark field and (D) zeta potential of PS-COOH (a), PS-PEG-NH2 (b) and PS-PEG-Pep-COOH (c).
3.2. Effect of purification on fluorescent imaging
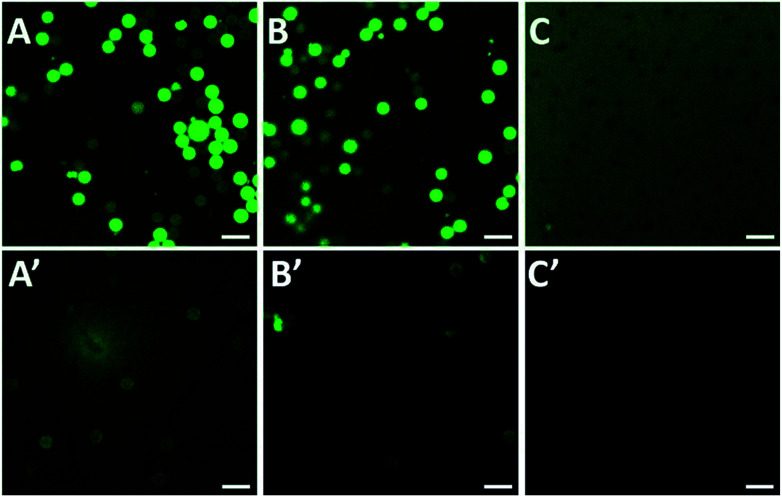
Herein, some control experiments were conducted to verify the effect of the washing conditions and PEG coating on activity detection. Firstly, PEG and peptide-FITC were physically mixed with PS (Fig. 3A, A′, B and B′) or PS-PEG (Fig. 3C and C′) as control experiments and then observed their corresponding fluorescence images. As shown in Fig. 3A and A′, it is clear that there is a high amount of FITC residue on the surface of the PS spheres and in the solution after washing with water and ethanol. After washing with water, ethanol and NaOH solution (0.1 M), the background fluorescence significantly decreased (Fig. 3B and B′). This is because the alkaline conditions make the carboxylated surface of FITC protonated, which helps the dissociated peptide-FITC to dissolve. However, there was still a large amount of FITC residue on the surface of the PS spheres, which makes them inaccurate for fluorescent detection (Fig. 3B′). Hence, it is difficult to clean the fluorophore on the surface of PS attached by physical adsorption. As shown in Fig. 3C and C′, the fluorescence intensity of the background solution was much higher than the PS-PEG microspheres. Besides, there was only a small amount of FITC residue after washing in the measured solution with PEG coating, which means that the excess peptide-FITC was drastically removed. These results implied that the alkaline washing conditions are more favorable to the system, while the PEG coating is beneficial to avoid non-specific adsorption, which is of great significance for the qualitative and quantitative detection of trypsin based on fluorescence changes.
Fig. 3. PS-COOH mixed with FITC-Pep before (A) and after (A′) washing with water and ethanol; PS-COOH mixed with FITC-Pep before (B) and after (B′) washing with water, ethanol and NaOH solution (0.1 M); PS-PEG mixed with FITC-Pep before (C) and after (C′) washing with water, ethanol and NaOH solution (0.1 M). Scale bar is 50 μm.
3.3. Effect of pH and reaction time
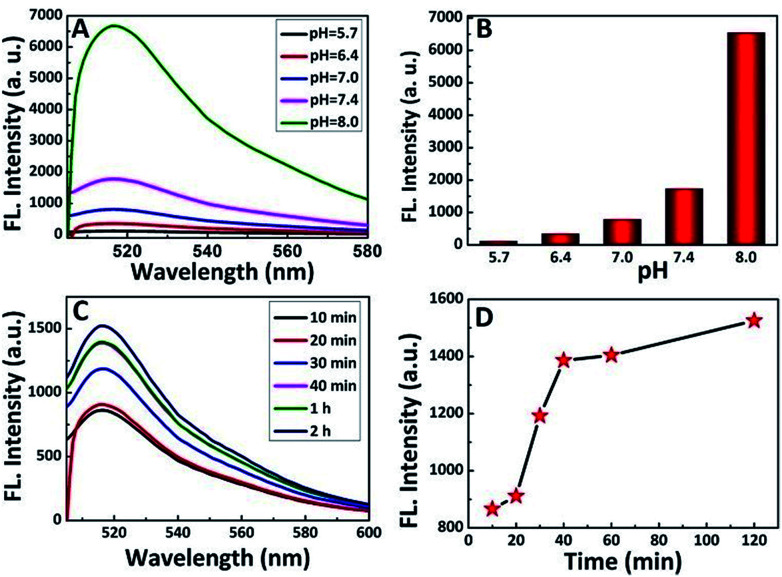
It has been well-documented that the pH environment and shearing time have great influence on the shearing reaction. Thus, to determine the influence and optimize the reaction condition, the shearing experiment was conducted under different pH values and a series of shearing times. After the shearing reaction, the luminescence of the supernatant solution was analyzed, and the results are shown in Fig. 4A and B. In an acidic environment, the fluorescence intensity of the PS-PEG-Pep supernatant (considering the large size of the PS spheres, all the fluorescent intensity data in this study were acquired from the PS-pep-FITC supernatant) after cleavage was relatively low compared to that in a high pH environment. Generally, the charge density of the peptide10 is the most important parameter that affects the pH environment, which leads to different electrostatic attractions or repulsions. With an increase in pH, the buried cysteine residues of the peptide are exposed, and show positive effect on the shearing reaction.42 This result implied that the increase in pH led to weakening of the interaction between Pep-FITC and PS-PEG, which is possibly because deprotonation caused Pep-FITC to have higher affinity for aqueous solution.43 This is in accordance with previous study,44,45 in which the fluorescent intensity of FITC acted as a signal for pH detection. However, it is well known that the fluorescent intensity of FITC can be increased at higher pH,46 especially around pH = 8. For simulating the biological environment47 and reducing the influence of fluorescence changes in FITC, a weakly alkaline environment (pH = 7.4) was applied in our system. Furthermore, the effect of shearing time was also investigated by tuning the shearing reaction at different time frame (Fig. 4C and D). The fluorescence intensity of the PS-PEG-Pep supernatant increased with an increase in shearing time. When the shearing time reached 1 h or above, smaller changes could be seen in the fluorescence intensity, which indicated that the cleavage was balanced at this point. Therefore, the shearing stability time was determined to be an hour.
Fig. 4. Fluorescence emission spectra (A) and histogram (B) of the fluorescence intensity of the supernatant of PS-PEG-Pep after cleavage by trypsin (2 mg mL−1, 1 h) under different pH environments; (C) fluorescence emission spectra of PS-PEG-Pep after cleavage by trypsin (2 mg mL−1, pH = 7.4) at different times and (D) relationship between the fluorescence intensity and cleavage time.
3.4. Measurement of trypsin activity
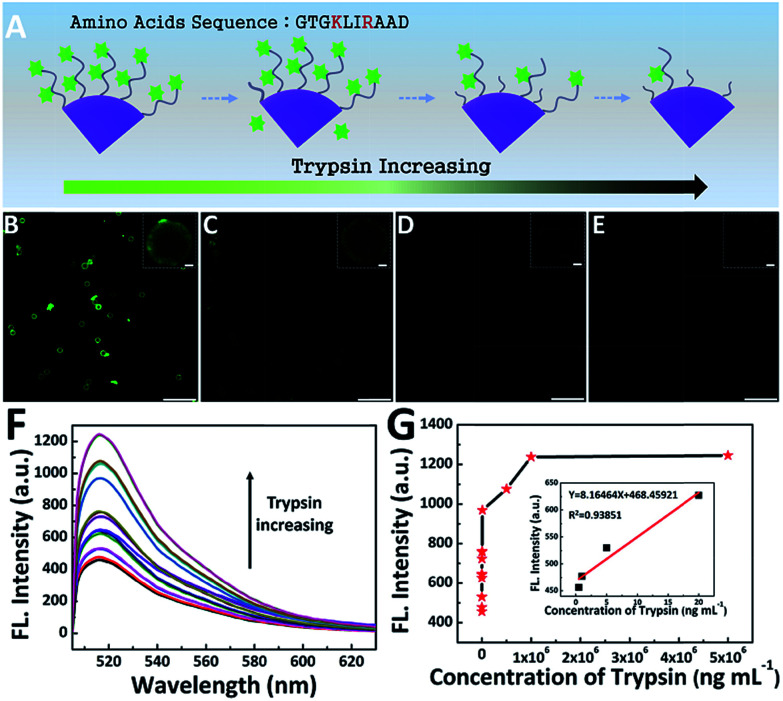
In order to detect the activity of trypsin, the peptide-FITC, which is rich in lysine and arginine residues, was used here to perform the modified universal protease activity assay method. Noting that the activity detection method made a great difference compared to the traditional protease activity assay, in which simple numerical value (fluorescent intensity32 and current signal5) changes are monitored. Due to its large size, fluorescent images could be also acquired to monitor the real-time activity of trypsin. The cleavage condition was mild and simple (Fig. 5). With an increase in the concentration of trypsin, the polypeptides were cut into segments accompanied with the detachment of their fluorescent pieces, which led to a decrease in fluorescent molecules (Fig. 5A). The fluorescence microscopy images of four representative trypsin concentrations were shown in Fig. 5B–E. The fluorescent microspheres were clearly visible before cleavage. It is worth emphasizing that the fluorescent intensity of the four fluorescence microscopy images showed a distinct trend of gradual decrease. Furthermore, only weak fluorescence was barely visible after cleavage by excess trypsin (2 mg mL−1, Fig. 5E).4,5,13 In this case, we induced the large particles to achieve quantitative monitoring within the operable range of the confocal microscope. In other words, this fluorescent microsphere probe makes it possible for the qualitative real-time monitoring of trypsin activity.
Fig. 5. (A) Schematic illustration of the amino acid sequence in the peptide and the change in PS-PEG-Pep during the cleavage procedure with an increasing concentration of trypsin; Fluorescence image of PS-PEG-Pep cleavage with different concentrations (B), 0.1 ng mL−1; (C) 100 ng mL−1; (D) 5 μg mL−1; and (E) 2 mg mL−1; (F) fluorescence emission spectra of peptide-modified PS-PEG after cleavage by trypsin with different concentrations and (G) calibration curves corresponding to the analysis of trypsin with different concentrations.
In addition to the rapid qualitative monitoring, this method is also suitable for sensitive quantitative detection. As shown in Fig. 5F and G, the fluorescence peak at around 522 nm was the characteristic band of FITC.48 The fluorescence intensity can be used to quantitatively detect the activity of trypsin. With an increase in the concentration of trypsin, the fluorescence intensity of the supernatant increased gradually. As shown in Fig. 5G, the detection limit is as low as 0.5 ng mL−1, which was lower than some reported methods.10,32,49 In addition, the fluorescence intensity of the supernatant exhibited a linear relationship with the concentration of trypsin in the range of 0.5–20 ng mL−1 (inset of Fig. 5G). Furthermore, when the concentration of trypsin was higher than 50 μg mL−1, the fluorescence intensity of the supernatant remained unchanged. This was because the amount of trypsin was in excess and most peptide-FITC was sheared, which is in accordance with previous reports.50
3.5. Selectivity of the fluorescent microsphere probe
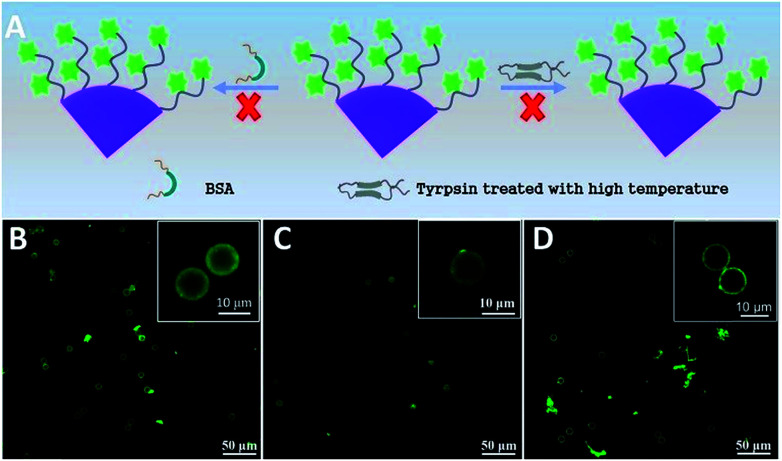
It is of great importance for biosensors to possess good selectivity. Herein, the selectivity of the fluorescent microsphere probe was verified using BSA and inactive trypsin to replace trypsin (Fig. 6). To make it inactive, trypsin was handled in advance in a high temperature environment (50 °C) for about 1 h. Inactive trypsin was added into the microsphere probe dispersion, and there was no obvious fluorescence intensity change before and after the reaction (Fig. 6B–D). The results illustrated that the inactive trypsin lost its active function and did not interact with peptide-FITC.51 BSA has no specificity to identify the sites of lysine or arginine amino acid residues. As a consequence, peptide-FITC was not sheared by BSA and the fluorescence intensity never changed. There was no obvious fluorescence intensity change before and after cleavage by BSA. These results are also an indirect explanation for the successful activity detection based on the fluorescent microsphere probe.
Fig. 6. (A) Schematic illustration of the cleavage procedure with BSA and trypsin treated with high temperature (50 °C); (B) fluorescence image of peptide-modified PS-PEG before (A) and after cleavage with BSA (C) and trypsin (D) treated with high temperature (50 °C).
4. Conclusions
In summary, a novel fluorescent microsphere probe was developed to qualitatively and quantitatively measure the activity of trypsin by monitoring the shearing reaction between peptide-FITC and trypsin. The PS-PEG spheres, which were designed to avoid nonspecific physical adsorption, were modified with peptide-FITC using the universal “surface activation” strategy. The fluorescent microsphere probe (PS-PEG-peptide-FITC) successfully achieved highly sensitive detection of the activity of trypsin. The detection limit was as low as 0.5 ng mL−1. By taking advantage of the large size of PS-PEG-peptide-FITC, the activity of trypsin could be rapidly and qualitatively detected within 10 min by confocal microscopy. Furthermore, the fluorescent microsphere probe showed high selectivity for active trypsin. Therefore, this PS-PEG-Pep-based biosensor provides a sensitive, rapid and simple strategy for the detection of active trypsin.
Conflicts of interest
There are no conflicts to declare.
Supplementary Material
Acknowledgments
We gratefully acknowledge the Natural Science Foundation of China (Grants 51473179, 51603219), the Bureau of Frontier Science and Education of Chinese Academy of Sciences (QYZDB-SSW-SLH036), Fujian Province-Chinese Academy of Sciences STS project (2017T31010024), Ningbo Science and Technology Bureau (2015C110031, 2017D10001), Youth Innovation Promotion Association of Chinese Academy of Science (2016268 and 2017337). Open Access funding provided by the Max Planck Society.
Notes and references
- Poon C. Y. Li Q. Zhang J. Li Z. Dong C. Lee A. W. Chan W. H. Li H. W. Anal. Chim. Acta. 2016;917:64–70. doi: 10.1016/j.aca.2016.02.032. [DOI] [PubMed] [Google Scholar]
- Serrano I. C. Stoica G. Adams A. M. Palomares E. Nanoscale. 2014;6:13623–13629. doi: 10.1039/C4NR03952A. [DOI] [PubMed] [Google Scholar]
- Dai H. Chen S. Li Y. Zeng B. Zhang S. Hong Z. Lin Y. Biosens. Bioelectron. 2017;92:687–694. doi: 10.1016/j.bios.2016.10.028. [DOI] [PubMed] [Google Scholar]
- Chuang C. H. Lin Y. C. Chen W. L. Chen Y. H. Chen Y. X. Chen C. M. Shiu H. W. Chang L. Y. Chen C. H. Chen C. H. Biosens. Bioelectron. 2016;78:213–220. doi: 10.1016/j.bios.2015.11.049. [DOI] [PubMed] [Google Scholar]
- Zhou S. Wang L. Chen X. Guan X. ACS Sens. 2016;1:607–613. doi: 10.1021/acssensors.6b00043. [DOI] [PMC free article] [PubMed] [Google Scholar]
- Soleimani M. Nadri S. Nat. Protoc. 2009;4:102–106. doi: 10.1038/nprot.2008.221. [DOI] [PubMed] [Google Scholar]
- Schuchert-Shi A. Hauser P. C. Anal. Biochem. 2009;387:202–207. doi: 10.1016/j.ab.2009.01.025. [DOI] [PubMed] [Google Scholar]
- Braatz J. A. Elias C. Finny J. G. Tran H. McCaman M. J. Immunol. Methods. 2015;417:131–133. doi: 10.1016/j.jim.2014.12.009. [DOI] [PubMed] [Google Scholar]
- Kersey A. D. Berkoff T. A. Morey W. W. Opt. Lett. 1993;18:1370–1372. doi: 10.1364/OL.18.001370. [DOI] [PubMed] [Google Scholar]
- Hayden O. Haderspock C. Krassnig S. Chen X. Dickert F. L. Analyst. 2006;131:1044–1050. doi: 10.1039/B608354B. [DOI] [PubMed] [Google Scholar]
- Zhang W. Kang J. Li P. Liu L. Wang H. Tang B. Chem. Commun. 2016;52:13991–13994. doi: 10.1039/C6CC08211D. [DOI] [PubMed] [Google Scholar]
- Zhang W. Liu W. Li P. Xiao H. Wang H. Tang B. Angew. Chem. 2014;53:12489–12493. doi: 10.1002/anie.201405634. [DOI] [PubMed] [Google Scholar]
- Wang G. L. Jin L. Y. Dong Y. M. Wu X. M. Li Z. J. Biosens. Bioelectron. 2015;64:523–529. doi: 10.1016/j.bios.2014.09.071. [DOI] [PubMed] [Google Scholar]
- Stoytcheva M. Zlatev R. Cosnier S. Arredondo M. Electrochim. Acta. 2012;76:43–47. doi: 10.1016/j.electacta.2012.04.140. [DOI] [Google Scholar]
- Zhang W. He X.-W. Yang Y.-Q. Li W.-Y. Zhang Y.-K. J. Mater. Chem. B. 2013;1:347–352. doi: 10.1039/C2TB00022A. [DOI] [PubMed] [Google Scholar]
- Zhao L. Wang T. Wu Q. Liu Y. Chen Z. Li X. ACS Appl. Mater. Interfaces. 2017;9:3400–3410. doi: 10.1021/acsami.6b14118. [DOI] [PubMed] [Google Scholar]
- Hu L. Han S. Parveen S. Yuan Y. Zhang L. Xu G. Biosens. Bioelectron. 2012;32:297–299. doi: 10.1016/j.bios.2011.12.007. [DOI] [PubMed] [Google Scholar]
- Gao X. Tang G. Li Y. Su X. Anal. Chim. Acta. 2012;743:131–136. doi: 10.1016/j.aca.2012.07.007. [DOI] [PubMed] [Google Scholar]
- Xu J. Haupt K. Tse Sum Bui B. ACS Appl. Mater. Interfaces. 2017;9:24476–24483. doi: 10.1021/acsami.7b05844. [DOI] [PubMed] [Google Scholar]
- Huang Y.-F. Huang C.-C. Chang H.-T. Langmuir. 2003;19:7498–7502. doi: 10.1021/la034541o. [DOI] [Google Scholar]
- Lemieux H. Blier P. U. J. Aquat. Food Prod. Technol. 2007;16:13–26. doi: 10.1300/J030v16n04_03. [DOI] [Google Scholar]
- Zhuo C. X. Wang L. H. Feng J. J. Zhang Y. D. Sensors. 2016;16:1477. doi: 10.3390/s16111477. [DOI] [PMC free article] [PubMed] [Google Scholar]
- Hu L. Han S. Parveen S. Yuan Y. Zhang L. Xu G. Biosens. Bioelectron. 2012;32:297–299. doi: 10.1016/j.bios.2011.12.007. [DOI] [PubMed] [Google Scholar]
- Dai L. Song L. Huang Y. Zhang L. Lu X. Zhang J. Chen T. Langmuir. 2017;33:5378–5384. doi: 10.1021/acs.langmuir.7b00097. [DOI] [PubMed] [Google Scholar]
- Huang Y. Dai L. Song L. Zhang L. Rong Y. Zhang J. Nie Z. Chen T. ACS Appl. Mater. Interfaces. 2016;8:27949–27955. doi: 10.1021/acsami.6b05258. [DOI] [PubMed] [Google Scholar]
- Huang Y. Ferhan A. R. Kim D. H. Nanoscale. 2013;5:7772–7775. doi: 10.1039/C3NR02718J. [DOI] [PubMed] [Google Scholar]
- Rong Y. Song L. Si P. Zhang L. Lu X. Zhang J. Nie Z. Huang Y. Chen T. Langmuir. 2017;33:13867–13873. doi: 10.1021/acs.langmuir.7b03538. [DOI] [PubMed] [Google Scholar]
- Song L. Zhang L. Huang Y. Chen L. Zhang G. Shen Z. Zhang J. Xiao Z. Chen T. Sci. Rep. 2017;7:3288. doi: 10.1038/s41598-017-03495-1. [DOI] [PMC free article] [PubMed] [Google Scholar]
- Shi F. Wang L. Li Y. Zhang Y. Su X. Sens. Actuators, B. 2018;255:2733–2741. doi: 10.1016/j.snb.2017.09.087. [DOI] [Google Scholar]
- Wang F. Gao J. Zhao J. Zhang W. Bai J. Jia H. Wang Y. RSC Adv. 2017;7:47983–47989. doi: 10.1039/C7RA08166A. [DOI] [Google Scholar]
- Cao Y. Yu J. Bo B. Shu Y. Li G. Biosens. Bioelectron. 2013;45:1–5. doi: 10.1016/j.bios.2012.12.061. [DOI] [PubMed] [Google Scholar]
- Wang C. Ouyang J. Wang Y. Y. Ye D. K. Xia X. H. Anal. Chem. 2014;86:3216–3221. doi: 10.1021/ac500196s. [DOI] [PubMed] [Google Scholar]
- Zhao X.-r. Chen Y.-l. Wang L. Wang W.-f. Chen X.-g. Anal. Methods. 2016;8:393–400. doi: 10.1039/C5AY02405F. [DOI] [Google Scholar]
- Proc J. L. Kuzyk M. A. Hardie D. B. Yang J. Smith D. S. Jackson A. M. Parker C. E. Borchers C. H. J. Proteome Res. 2010;9:5422–5437. doi: 10.1021/pr100656u. [DOI] [PMC free article] [PubMed] [Google Scholar]
- Zhang X. Yang P. Dai Y. Ma P. a. Li X. Cheng Z. Hou Z. Kang X. Li C. Lin J. Adv. Funct. Mater. 2013;23:4067–4078. doi: 10.1002/adfm.201300136. [DOI] [Google Scholar]
- Liu J. Detrembleur C. De Pauw-Gillet M. C. Mornet S. Jerome C. Duguet E. Small. 2015;11:2323–2332. doi: 10.1002/smll.201402145. [DOI] [PubMed] [Google Scholar]
- Yi Q. Liu Q. Gao F. Chen Q. Wang G. Sensors. 2014;14:10203–10212. doi: 10.3390/s140610203. [DOI] [PMC free article] [PubMed] [Google Scholar]
- Miao P. Liu T. Li X. Ning L. Yin J. Han K. Biosens. Bioelectron. 2013;49:20–24. doi: 10.1016/j.bios.2013.04.038. [DOI] [PubMed] [Google Scholar]
- Patel N. Davies M. C. Hartshorne M. Heaton R. J. Roberts C. J. Saul J. Tendler B. Williams P. M. Langmuir. 1997;13:6485–6490. doi: 10.1021/la970933h. [DOI] [Google Scholar]
- Lu Y. McLellan J. Xia Y. Langmuir. 2004;20:3464–3470. doi: 10.1021/la036245h. [DOI] [PubMed] [Google Scholar]
- Dokoutchaev A. James J. T. Koene S. C. Pathak S. Prakash G. K. S. Thompson M. E. Chem. Mater. 1999;11:2389–2399. doi: 10.1021/cm9900352. [DOI] [Google Scholar]
- Zaccheo B. A. Crooks R. M. Anal. Chem. 2011;83:1185–1188. doi: 10.1021/ac103115z. [DOI] [PubMed] [Google Scholar]
- Nakayama-Ratchford N. Bangsaruntip S. Sun X. Welsher K. Da H. J. Am. Chem. Soc. 2007;129:2448–2449. doi: 10.1021/ja068684j. [DOI] [PMC free article] [PubMed] [Google Scholar]
- Zhang Y. Gong S. W. Y. Jin L. Li S. M. Chen Z. P. Ma M. Gu N. Chin. Chem. Lett. 2009;20:969–972. doi: 10.1016/j.cclet.2009.03.038. [DOI] [Google Scholar]
- Widengren J. Terry B. Rigler R. Chem. Phys. 1999;249:259–271. doi: 10.1016/S0301-0104(99)00256-6. [DOI] [Google Scholar]
- Nakayama-Ratchford N. Bangsaruntip S. Sun X. Welsher K. Dai H. J. Am. Chem. Soc. 2007;129:2448–2449. doi: 10.1021/ja068684j. [DOI] [PMC free article] [PubMed] [Google Scholar]
- Liu J. M. Chen J. T. Yan X. P. Anal. Chem. 2013;85:3238–3245. doi: 10.1021/ac303603f. [DOI] [PubMed] [Google Scholar]
- Hakeem A. Zahid F. Duan R. Asif M. Zhang T. Zhang Z. Cheng Y. Lou X. Xia F. Nanoscale. 2016;8:5089–5097. doi: 10.1039/C5NR08753H. [DOI] [PubMed] [Google Scholar]
- Zhang M. Jang C. H. ChemPhysChem. 2014;15:2569–2574. doi: 10.1002/cphc.201402120. [DOI] [PubMed] [Google Scholar]
- Liu X. Li Y. Jia L. Chen S. Shen Y. RSC Adv. 2016;6:93551–93557. doi: 10.1039/C6RA19220C. [DOI] [Google Scholar]
- Sam S. Touahir L. Salvador Andresa J. Allongue P. Chazalviel J. N. Gouget-Laemmel A. C. Henry de Villeneuve C. Moraillon A. Ozanam F. Gabouze N. Djebbar S. Langmuir. 2010;26:809–814. doi: 10.1021/la902220a. [DOI] [PubMed] [Google Scholar]


