Abstract
Herein, we report a highly sensitive colorimetric sensor for the detection of heparin based on its anti-aggregation effect of the PDDA–gold nanoparticle colloidal system. PDDA-induced non-crosslinking aggregation of gold nanoparticles is firstly investigated and the phenomenon of heparin mediated color recovery is then observed, which can be used to indicate the concentration of heparin. This method is proved to be highly sensitive and selective. Moreover, it has been successfully applied to determine human blood serum samples, the results of which demonstrate great potential practical utility with simple operations.
We have developed a highly sensitive colorimetric sensor for the detection of heparin based on its anti-aggregation effect of the PDDA–gold nanoparticle colloidal system.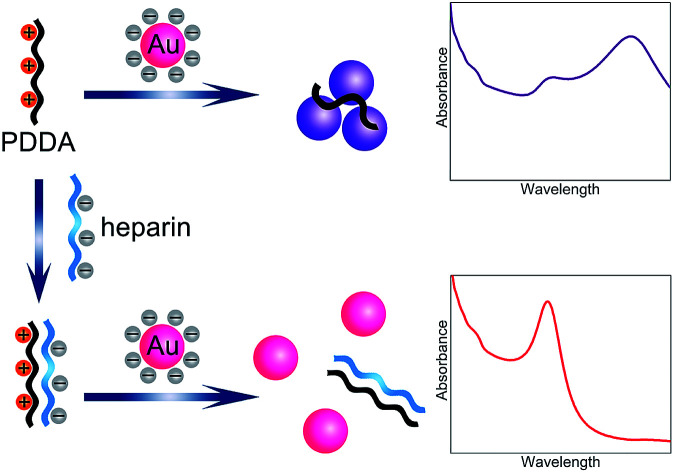
Introduction
Heparin is a linear polyanion with the highest charge density of known biomacromolecules.1 It consists of alternating units of 2-deoxy-2-sulfamido-α-d-glucopyranose and O-sulfated uronic acids. It is found that heparin could interact with thrombin inhibitors like antithrombin III (ATIII). The conformation is thus changed which leads to its activation by an increase in the flexibility of the reaction site loop.2 Finally, blood clotting is prevented.3,4 Therefore, heparin has been developed as a type of clinical anticoagulant drug, which has been widely used in medical therapies for decades.5 For instance, in hemodialysis and cardiopulmonary bypass, clots may be created with the contact between blood and artificial materials, thus, anticoagulant drugs should be injected to prevent possible clotting. However, the dose usage must be strictly controlled since overdose usage of heparin may lead to bleeding and underdose usage may not prevent clotting effectively. The most serious side-effects of heparin is heparin-induced thrombocytopenia (HIT), which may lead to the degradation of platelets by immunological reactions. Therefore, development of analytical tools to monitor heparin rapidly is an urgent need.6,7
Traditional heparin quantification methods include activated partial thromboplastin time (aPTT),8 anti-Xa assay,9 and thrombelastograph (TEG).10 However, there are severe limitations such as high cost, low sensitivity, and requirements of preanalytical and postanalytical variabilities. As a result, there is still a strong desire to develop more practical and fast methods for the detection of heparin.
In recent years, different recognition elements have been exploited for heparin binding including host–guest interaction,11 peptide,12 liposome,13 and even small molecules.14 Many different sensors have been developed based on techniques such as fluorescence,15,16 electrochemistry,17,18 colorimetry,19,20 surface-enhanced Raman scattering (SERS),21,22 and so on. Among these techniques, colorimetric sensors show numerous advantages due to several merits. First, the results are reliable and can be observed by the naked eye, which is quite facile; second, there are no requirements for any complicated instruments or skilled personnel; third, the detection duration is always short, which meets the need of point-of-care testing. Therefore, increasing interest has been focused on colorimetric sensing strategies for heparin assay. For example, Hu et al. took advantage of the peroxidase-like catalytic activity of gold nanoclusters for colorimetric detection of heparin, which was greatly accelerated by the target heparin at neutral pH.23 Qu et al. developed a colorimetric heparin sensor based on the aggregation of gold nanoparticles (AuNPs) induced by polymer nanoparticles.24 Fu et al. employed gold nanorods for label-free colorimetric detection of heparin based on the color quenching effect by graphene oxide.25
Results and discussion
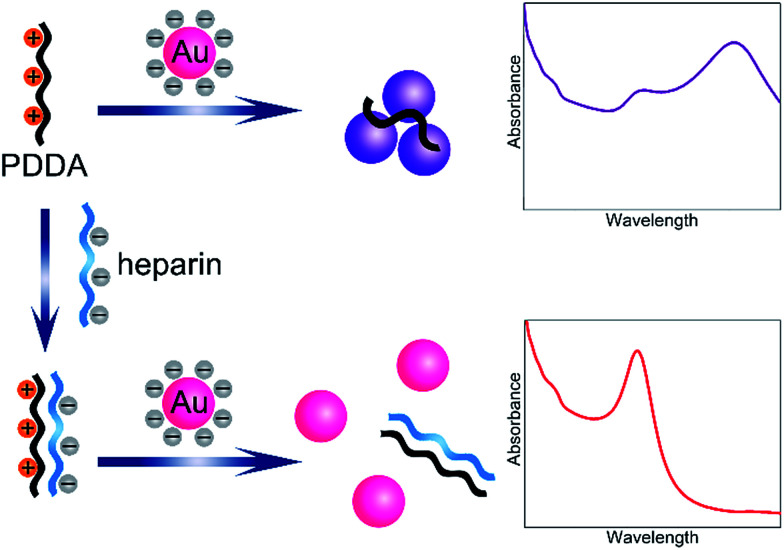
In the present study, a novel and simple colorimetric method is developed for sensitive detection of heparin. The detailed sensing mechanism is shown in Scheme 1. Generally, AuNPs are chosen as an excellent platform for colorimetric detection.26–28 The synthesized AuNPs in this work yield spherical nanoparticles with an average size of 13 nm and surface plasmon resonance (SPR) maximum around 520 nm. Since the AuNPs are capped with negatively charged citrate on the surface,29 which can be confirmed by the zeta potential report (Fig. S1†), the nanoparticles are well-dispersed in water. Nevertheless, in the presence of poly(diallyldimethylammonium chloride) (PDDA) with positive charges, electric neutralization occurs and AuNPs tend to aggregate. Since the localized SPR effect of AuNPs is strongly correlated with the distribution state,30 significant color changes can be easily distinguished by the naked eye or UV-vis absorption spectra. On the other hand, heparin bears high negative charge density, which can strongly bind PDDA via electrostatic interaction, forming a stable complex. Therefore, PDDA induced aggregation of AuNPs could be effectively inhibited by heparin. The recovery degrees of the solution color and UV-vis absorption spectrum are dependent on the concentration of heparin. A sensitive colorimetric sensor for heparin is thus established.
Scheme 1. Schematic illustration of the principle for colorimetric detection of heparin.
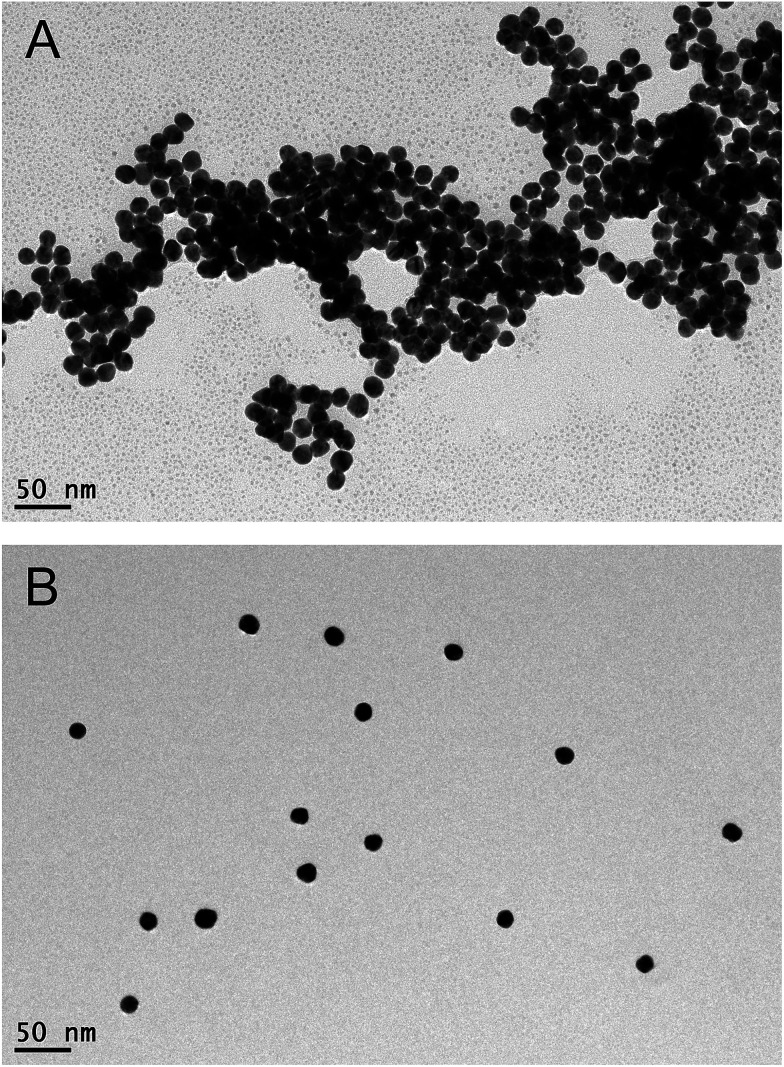
The sensing principle can be intuitively proved by the observation of the distribution states of AuNPs by transmission electron microscopy (TEM). As shown in Fig. 1A, after the introduction of the positively charged PDDA, significant aggregation of AuNPs is achieved due to the electric neutralization which destroys the protection effect of citrate. However, after formation of the PDDA/heparin complex, AuNPs remain stable and well-dispersed with negatively charged citrate on the surface (Fig. 1B).
Fig. 1. TEM images of PDDA induced non-crosslinking aggregation of AuNPs in the (A) absence and (B) presence of heparin.
The aggregation and dispersion states are then studied by UV-vis absorption spectra. After the addition of various concentrations of PDDA (0, 0.005, 0.01, 0.02, 0.03, 0.04, 0.05 μgmL−1), the plasmon peak at 520 nm decreases and a new peak at around 650 nm emerges (Fig. S2A†). The ratio of the peak at 650 nm to that at 520 nm (denoted as R650/520) could reveal the distribution state of AuNPs precisely. The relationship between R650/520 and the concentration of PDDA is then studied (Fig. S2B†). The fitting curve is a Boltzmann sigmoid with the equationy=A2+(A1− A2)/(1+exp(x − x0)/dx)(A1=0.2201, A2=1.3397, x0=0.01739, dx=0.00514, R2=0.9900)in which y stands for R650/520 and x is the concentration of PDDA (μg mL−1). With PDDA concentration of 0.01739 μg mL−1, the slope of the curve reaches a maximum value, indicating that the colloidal system is most sensitive to the changes of PDDA concentration at this critical point. Therefore, this concentration is used in the following experiments for heparin analysis.
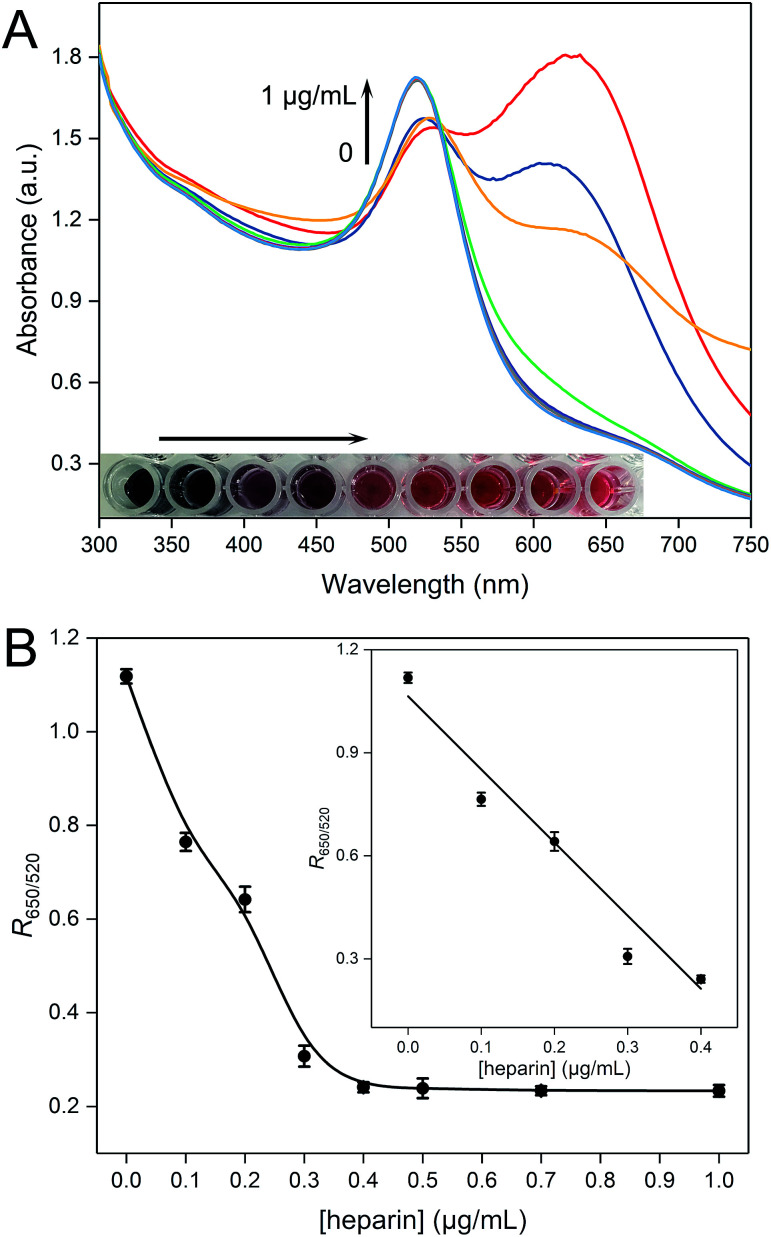
UV-vis absorption spectra are also recorded to reveal the plasmon peak variations of the PDDA–AuNP colloidal system for the detection of heparin. As depicted in Fig. 2A, with the increase of the concentration of heparin, the peak at around 650 nm drops gradually and the peak at 520 nm increases, indicating that the AuNPs tend to disperse in the presence of heparin. More direct evidence can be obtained by observing the solution colors (inset in Fig. 2A). In the absence of heparin, the PDDA–AuNP solution is purple blue, which gradually recovers to wine red with increasing amount of heparin. We have also studied the relationship between the parameter R650/520 and the concentration of heparin (Fig. 2B). A linear relationship is established in the range from 0 to 0.4 μg mL−1. The equation is as follows:y = 1.0644–2.1286x(n = 3, R2 = 0.9810)
Fig. 2. (A) UV-vis absorption spectra of AuNPs for the detection of heparin with the concentrations of 0, 0.1, 0.2, 0.3, 0.4, 0.5, 0.7, 1 μg mL−1. The top curve shows the UV-vis spectrum of bare AuNPs. The inset shows the corresponding solution colors (from left to right). (B) R650/520 of the PDDA–AuNP system versus the concentration of heparin. The inset shows the linear range. Error bars represent standard deviations of measurements (n = 3).
The limit of detection is calculated to be 0.02 μg mL−1, which is quite low. After comparison with previously developed sensors, the proposed method shows excellent analytical performances (Table S1†).
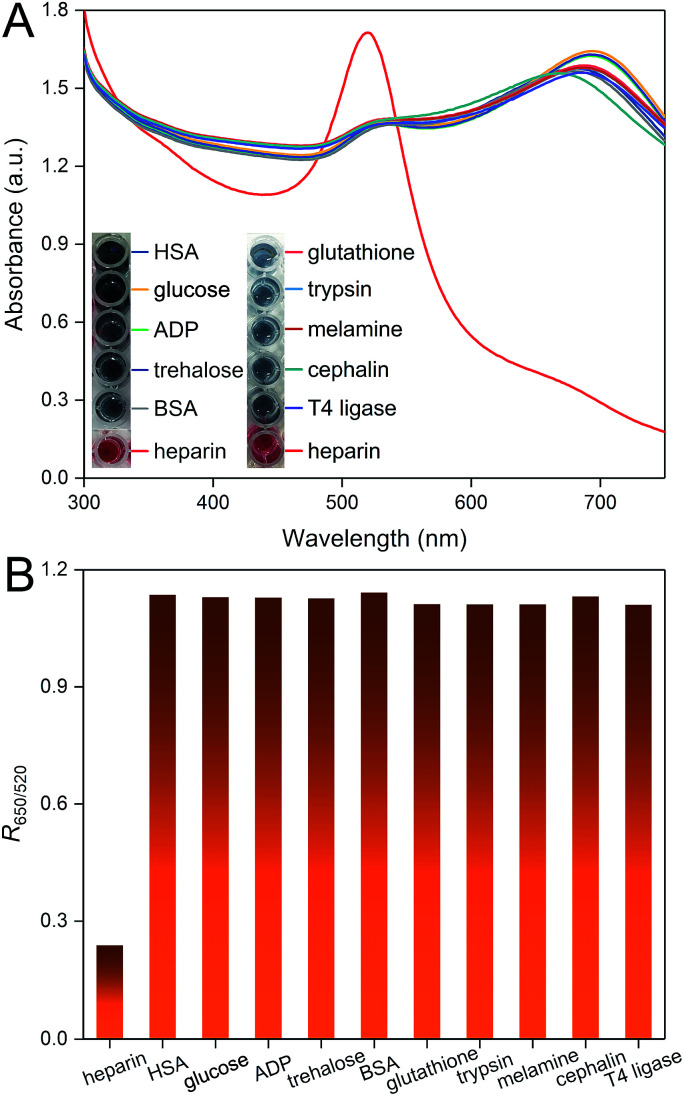
We have also studied the selectivity of this colorimetric sensor for the heparin assay by assessing the effects of a collection of possible interferents (HSA, glucose, ADP, trehalose, BSA, glutathione, trypsin, melamine, cephalin, T4 ligase). As shown in Fig. 3A, none of these molecules can interact with PDDA and result in further shift of the peaks. Only in the presence of heparin, remarkable variation of the UV-vis absorption spectrum is observed, which is due to the formation of a stable PDDA/heparin complex. The results can be further confirmed by the visibly observable color differences. We have also calculated the corresponding R650/520 values. The presence of heparin can be successfully distinguished from these molecules, which demonstrates the high selectivity of this method.
Fig. 3. (A) UV-vis absorption spectra of AuNPs for the detection of HSA, glucose, ADP, trehalose, BSA, glutathione, trypsin, melamine, cephalin, T4 ligase, and heparin. The inset shows the corresponding solution colors. (B) The calculated R650/520 for the detection of different biomolecules.
To examine the practicality of this heparin assay, we have employed a standard addition method to determine heparin concentration in human blood serum samples. Different amounts of heparin are firstly spiked in different serum samples. As shown in Table 1, the detected values agree well with the spiked amount of heparin, and the relative errors are not larger than 6%. These results verify the practical applicability of this method. Although the proposed sensor provides a quantitative estimation of heparin, it seems that it also provides a quick and convenient qualitative screening method between a larger number of real samples by naked eye observation, which may have great potential utility.
Colorimetric analysis of heparin in serum samples.
| Sample | Added (μgmL−1) | Detected (μgmL−1) | Relative error (%) |
|---|---|---|---|
| Serum 1 | 0.1 | 0.105±0.003 | 5.0 |
| 0.3 | 0.317±0.007 | 5.7 | |
| Serum 2 | 0.1 | 0.102±0.015 | 2.0 |
| 0.3 | 0.293±0.004 | 2.3 | |
| Serum 3 | 0.1 | 0.094±0.003 | 6.0 |
| 0.3 | 0.313±0.004 | 4.3 |
Conclusions
In summary, we have devised a novel colorimetric sensor for sensitive and selective detection of heparin. AuNPs show the tendency of aggregation and a red shift in UV-vis absorption spectra in the presence of PDDA. Heparin could bind PDDA, forming a stable complex, thus the aggregation of AuNPs is effectively inhibited. By analyzing the parameter R650/520, quantitative detection of heparin is achieved with the limit of detection as low as 0.02 μg mL−1. The method is cost-effective, fast and can be operated conveniently. In addition, it has been successfully applied in the analysis of human blood serum samples, which demonstrates the potential utility in the future.
Conflicts of interest
There are no conflicts to declare.
Supplementary Material
Acknowledgments
This work was supported by the National Natural Science Foundation of China (Grant no. 81801792, 81602864), the Natural Science Foundation of Jiangsu Province for Excellent Young Scholars (Grant no. BK20170087).
Electronic supplementary information (ESI) available: Details of experimental information, Fig. S1, S2 and Table S1. See DOI: 10.1039/c8na00162f
References
- Eskandarloo H. Godec M. Arshadi M. Padilla-Zakour O. I. Abbaspourrad A. Chem. Eng. J. 2018;348:399–408. doi: 10.1016/j.cej.2018.04.099. [DOI] [Google Scholar]
- Chuang Y. J. Swanson R. Raja S. M. Olson S. T. J. Biol. Chem. 2001;276:14961–14971. doi: 10.1074/jbc.M011550200. [DOI] [PubMed] [Google Scholar]
- Salter B. S. Weiner M. M. Trinh M. A. Heller J. Evans A. S. Adams D. H. Fischer G. W. J. Am. Coll. Cardiol. 2016;67:2519–2532. doi: 10.1016/j.jacc.2016.02.073. [DOI] [PubMed] [Google Scholar]
- Wei H. Cai H. Y. Wu J. W. Wei Z. Q. Zhang F. Huang X. Ma L. Feng L. L. Zhang R. X. Wang Y. J. Ragg H. Zheng Y. Zhou A. W. J. Biol. Chem. 2016;291:24900–24911. doi: 10.1074/jbc.M116.725895. [DOI] [PMC free article] [PubMed] [Google Scholar]
- Choay J. Lormeau J. C. Petitou M. Sinay P. Casu B. Oreste P. Torri G. Gatti G. Thromb. Res. 1980;18:573–578. doi: 10.1016/0049-3848(80)90356-4. [DOI] [PubMed] [Google Scholar]
- Sommers C. D. Keire D. A. Anal. Chem. 2011;83:7102–7108. doi: 10.1021/ac201412z. [DOI] [PubMed] [Google Scholar]
- Ding Y. B. Shi L. L. Wei H. Chem. Sci. 2015;6:6361–6366. doi: 10.1039/C5SC01675D. [DOI] [PMC free article] [PubMed] [Google Scholar]
- Song X. Wang K. Tang C. Q. Yang W. W. Zhao W. F. Zhao C. S. Biomacromolecules. 2018;19:1966–1978. doi: 10.1021/acs.biomac.7b01724. [DOI] [PubMed] [Google Scholar]
- Vandiver J. W. Vondracek T. G. Pharmacotherapy. 2012;32:546–558. doi: 10.1002/j.1875-9114.2011.01049.x. [DOI] [PubMed] [Google Scholar]
- Khan N. U. Wayne C. K. Barker J. Strang T. Eur. J. Anaesthesiol. 2010;27:624–627. doi: 10.1097/EJA.0b013e32833731bd. [DOI] [PubMed] [Google Scholar]
- Jagt R. B. C. Gomez-Biagi R. F. Nitz M. Angew. Chem., Int. Ed. 2009;48:1995–1997. doi: 10.1002/anie.200805238. [DOI] [PubMed] [Google Scholar]
- Meng F. Y. Liang W. G. Sun H. X. Wu L. G. Gong X. Miao P. ChemElectroChem. 2017;4:472–475. doi: 10.1002/celc.201600680. [DOI] [Google Scholar]
- Cho Y. S. Ahn K. H. J. Mater. Chem. B. 2013;1:1182–1189. doi: 10.1039/C2TB00410K. [DOI] [PubMed] [Google Scholar]
- Wang M. Zhang D. Q. Zhang G. X. Zhu D. B. Chem. Commun. 2008:4469–4471. doi: 10.1039/B808877B. [DOI] [PubMed] [Google Scholar]
- Jana P. Radhakrishna M. Khatua S. Kanvah S. Phys. Chem. Chem. Phys. 2018;20:13263–13270. doi: 10.1039/C7CP06300H. [DOI] [PubMed] [Google Scholar]
- Cheng Q. He Y. Ge Y. L. Zhou J. G. Song G. W. Microchim. Acta. 2018;185:332. doi: 10.1007/s00604-018-2864-9. [DOI] [PubMed] [Google Scholar]
- Amemiya S. Kim Y. Ishimatsu R. Kabagambe B. Anal. Bioanal. Chem. 2011;399:571–579. doi: 10.1007/s00216-010-4056-2. [DOI] [PubMed] [Google Scholar]
- Lester J. Chandler T. Gemene K. L. Anal. Chem. 2015;87:11537–11543. doi: 10.1021/acs.analchem.5b03347. [DOI] [PubMed] [Google Scholar]
- Li J. Cheng M. Li M. J. Analyst. 2017;142:3733–3739. doi: 10.1039/C7AN01253E. [DOI] [PubMed] [Google Scholar]
- You J. G. Liu Y. W. Lu C. Y. Tseng W. L. Yu C. J. Biosens. Bioelectron. 2017;92:442–448. doi: 10.1016/j.bios.2016.10.082. [DOI] [PubMed] [Google Scholar]
- Ji W. Zhang X. Zhao J. Z. Gao Y. Song W. Ozaki Y. Analyst. 2018;143:1899–1905. doi: 10.1039/C8AN00015H. [DOI] [PubMed] [Google Scholar]
- Zeng Y. Pei J. J. Wang L. H. Shen A. G. Hu J. M. Biosens. Bioelectron. 2015;66:55–61. doi: 10.1016/j.bios.2014.10.068. [DOI] [PubMed] [Google Scholar]
- Hu L. Liao H. Feng L. Wang M. Fu W. Anal. Chem. 2018;90:6247–6252. doi: 10.1021/acs.analchem.8b00885. [DOI] [PubMed] [Google Scholar]
- Qu F. Liu Y. Q. Lao H. L. Wang Y. P. You J. M. New J. Chem. 2017;41:10592–10597. doi: 10.1039/C7NJ02381B. [DOI] [Google Scholar]
- Fu X. L. Chen L. X. Li J. H. Lin M. You H. Y. Wang W. H. Biosens. Bioelectron. 2012;34:227–231. doi: 10.1016/j.bios.2012.02.008. [DOI] [PubMed] [Google Scholar]
- Jans H. Huo Q. Chem. Soc. Rev. 2012;41:2849–2866. doi: 10.1039/C1CS15280G. [DOI] [PubMed] [Google Scholar]
- Rawat K. A. Bhamore J. R. Singhal R. K. Kailasa S. K. Biosens. Bioelectron. 2017;88:71–77. doi: 10.1016/j.bios.2016.07.069. [DOI] [PubMed] [Google Scholar]
- Rawat K. A. Kailasa S. K. Sens. Actuators, B. 2016;222:780–789. doi: 10.1016/j.snb.2015.09.003. [DOI] [Google Scholar]
- Chen X. F. Guo Z. Z. Tang Y. G. Shen Y. Miao P. Anal. Chim. Acta. 2018;999:54–59. doi: 10.1016/j.aca.2017.10.039. [DOI] [PubMed] [Google Scholar]
- Ma X. Y. Guo Z. Z. Mao Z. Q. Tang Y. G. Miao P. Microchim. Acta. 2018;185:33. doi: 10.1007/s00604-017-2606-4. [DOI] [PubMed] [Google Scholar]
Associated Data
This section collects any data citations, data availability statements, or supplementary materials included in this article.


