

Abstract
Objective:
Adductor spasmodic dysphonia (AdSD) is a neurogenic voice disorder, affecting the intrinsic laryngeal muscle control. AdSD leads to involuntary laryngeal spasms and only reveals during connected speech. Laryngeal high-speed videoendoscopy (HSV) coupled with a flexible fiberoptic endoscope provides a unique opportunity to study voice production and visualize the vocal fold vibrations in AdSD during speech. The goal of this study is to automatically detect instances during which the image of the vocal folds is optically obstructed in HSV recordings obtained during connected speech.
Methods:
HSV data were recorded from vocally normal adults and patients with AdSD during reading of the “Rainbow Passage”, six CAPE-V sentences, and production of the vowel /i/. A convolutional neural network was developed and trained as a classifier to detect obstructed/unobstructed vocal folds in HSV frames. Manually labelled data were used for training, validating, and testing of the network. Moreover, a comprehensive robustness evaluation was conducted to compare the performance of the developed classifier and visual analysis of HSV data.
Results:
The developed convolutional neural network was able to automatically detect the vocal fold obstructions in HSV data in vocally normal participants and AdSD patients. The trained network was tested successfully and showed an overall classification accuracy of 94.18% on the testing dataset. The robustness evaluation showed an average overall accuracy of 94.81% on a massive number of HSV frames demonstrating the high robustness of the introduced technique while keeping a high level of accuracy.
Conclusions:
The proposed approach can be used for a cost-effective analysis of HSV data to study laryngeal maneuvers in patients with AdSD during connected speech. Additionally, this method will facilitate development of vocal fold vibratory measures for HSV frames with an unobstructed view of the vocal folds. Indicating parts of connected speech that provide an unobstructed view of the vocal folds can be used for developing optimal passages for precise HSV examination during connected speech and subject-specific clinical voice assessment protocols.
Keywords: Laryngeal Imaging, Connected Speech, High-Speed Videoendoscopy, Adductor Spasmodic Dysphonia, Vocal fold obstruction, Convolutional Neural Network
1. Introduction
Adductor spasmodic dysphonia (AdSD) is a neurogenic focal laryngeal dystonia, which affects the intrinsic laryngeal muscle control. It causes spasmodic overclosure of vocal folds, and as a result, excessive phonatory breaks and a strained/effortful voice quality [1, 2]. AdSD is characterized as a task-dependent disorder, where its severity relies on the demands of the vocal task [3]. AdSD is typically revealed in connected speech, not in sustained phonation [2, 3, 4]. That is, connected/contextual speech provokes more severe laryngeal spasms, higher strain, and more frequent breaks during voice production in comparison with sustained vowels. This could be due to the increased linguistic and motor complexity of running speech compared to sustained phonation [3].
Laryngeal imaging can be used to observe and aid in diagnosis of the impaired voice production function in AdSD during connected speech [5, 6, 7, 8, 9, 10]. Laryngeal high-speed videoendoscopy (HSV) is a promising imaging tool that can offer a high temporal resolution [11, 12, 13, 14]. HSV has been used in previous studies to understand the underlying voice production mechanisms and, particularly, study dysphonic voices [15, 17, 18, 19, 13]. Coupling an HSV system with a flexible nasolaryngoscope allows to visualize and analyze the detailed phonatory events and vocal fold vibrations in running speech [20, 21, 22, 23, 24, 25, 26, 27, 28, 48], phonation onsets and offsets [29, 30, 31, 32], and voice breaks [27]. The capability of HSV to capture not only periodic vibrations but also aperiodic vibrations, which are frequently concomitant in neurogenic voice disorders in running speech [11, 12], makes it a powerful tool to examine vocal function in AdSD. Currently, HSV is rarely used in clinics to assess and diagnose voice disorders. This is because HSV recording of a short speech sample or phonation can result in several thousand video frames and manually navigating through this large dataset would be a difficult and time-consuming process for clinicians [33, 34]. Moreover, if the goal is to study the vocal fold vibrations, not all frames in an HSV recording are of interest to the clinicians since the vocal folds may not be visible at all times. It is important to develop automated techniques for HSV analysis during connected speech to help extract only the HSV frames with an unobstructed view of the vocal folds. Furthermore, this information could be helpful in disorder quantification. One of the powerful tools for developing such automated methods is deep learning.
Deep learning is a supervised machine learning approach using deep neural networks that can learn features from known/labeled data (training data) and make predictions on new data, based on the learned features [35]. Deep learning has shown promising performance in a variety of diagnostic tasks from medical images [36]. There is an immense potential for using deep learning techniques to analyze laryngeal images [48]. Accordingly, several recent studies have applied deep learning on laryngoscopic videos to automatically select frames that display sufficient diagnostic information allowing clinicians to find abnormalities in a timely manner, yet these models were vulnerable to overfitting due to the limited size of the training dataset (i.e., only a few hundred images) [37, 38, 39]. Others used deep learning as a classifier to recognize laryngeal pathology (such as polyps, leukoplakia, vocal nodules, and cancer) based on thousands of laryngoscopic images as a larger training dataset [40, 41, 42]. However, none of the previous studies were conducted using HSV in connected speech for frame selection/classification, which is very important in studying voice disorders as they mostly reveal themselves in running speech. Additionally, in terms of the type of voice disorder, this literature did not investigate AdSD. HSV in connected speech imposes lower image quality than in sustained phonation and exhibits excessive laryngeal maneuvers across frames, which urges the need to develop even more efficient methods that can deal with these challenging conditions [34].
The present study aims to develop a deep learning technique to automatically classify frames from HSV recordings during connected speech in both vocally normal adults and patients with AdSD. To the best of our knowledge, this work is the first to implement a fully automated deep-learning framework to perform frame classification using HSV data and compare its performance against visual analysis. During connected speech, particularly in patients with AdSD, excessive laryngeal maneuvers exist, which can lead to frequent vocal fold obstructions in the video recordings. In this study, an obstructed view of the vocal folds in HSV frames was defined when one vocal fold was covered or more than 50% of both folds were obstructed by, for example, epiglottis, left/right arytenoid cartilages, laryngeal constriction, or false vocal fold/s. These obstructions could lead to difficulty in assessing the vocal folds vibration. The main objective of this work is to automatically determine the HSV frames during which there is an obstructed/unobstructed view of the vocal folds in running speech. Such information would be useful to characterize laryngeal tissue maneuvers in AdSD and designing voice assessment protocols using HSV in connected speech. Therefore, the primary goal of this paper is to introduce a tool that can automatically recognize how many and which laryngeal HSV frames display a clear view of the true vocal folds during a token of speech. Toward that goal, we developed a deep-learning method using convolutional neural networks (CNN) to specify the presence/absence of the vocal folds in each HSV frame. The capability of the developed deep-learning approach is demonstrated through holding a robustness evaluation by comparing the performance of the automated technique versus manual/visual analysis on a large number of HSV frames.
2. Materials and Methods
2.1. Participants and Data Collection
The data were collected from seven adults (35–76 years old) at Mayo Clinic in Arizona. The cohort included three vocally normal adults (2 female and 1 male) with no history of voice disorder and four with AdSD (4 female). The data collection was approved by the Institutional Review Board at Mayo Clinic. The data collection system included a Photron FASTCAM mini AX200 monochrome high-speed camera (Photron Inc., San Diego, CA), coupled with a flexible nasolaryngoscope. The data was captured at 4,000 frames per second (fps) with spatial resolution of 256 × 224 pixels. The chosen recording frame rate (4,000 fps) was previously shown to be clinically acceptable for voice assessment [21]. The data were obtained from participants during two productions of the vowel /i/ at habitual pitch and loudness, two with a soft glottal attack and two with a hard glottal attack, reading six CAPE-V sentences, and the Rainbow Passage. HSV recordings of each participant included 200,000–400,000 frames in total and was stored as mraw files (high-speed camera format) on a laptop.
2.2. Deep Learning Approach
2.2.1. Network Architecture
The deep-learning approach in this study was based on CNN, which is a well-known technique with a promising performance for image classification [43, 44]. This method can even outperform human visual analysis as shown in recent research in areas such as detecting skin and breast cancers, gastrointestinal diseases, and retinal diseases [45]. In this work, a fully convolutional network-based classifier was utilized based on the encoder part (the contracting path) of the U-Net architecture of Ronneberger et al. [46]. The proposed network architecture was designed and built using 64-bit MATLAB R2019b (MathWorks Inc., Natick, MA) as a powerful platform for CNN implementation.
Figure 1 illustrates the main architecture of the developed automated classifier, which was mainly designed through 10 layers of 3×3 unpadded convolutions. Each convolution was followed by batch normalization to accelerate the training of the neural network and alleviate the sensitivity of the network to its initialization. A nonlinearity term was then added by including a rectified linear unit (ReLU) to accelerate the computations and improve the network performance. The ReLU sets any numerical negative value in the convolution input by zero and keeps the same value for the remaining numbers. After each pair of two successive convolution-batch normalization and ReLU layers, a down sampling step was applied using a 2×2 max pooling with a strid of 2 where the number of feature maps was doubled. The dimensions of the feature maps corresponding to the different convolutional layers are illustrated in Figure 1 at each down sampling stage. The last layer was a sigmoid layer to classify whether the input frame contained the vocal fold/s or not (two classes: unobstructed vocal folds or obstructed vocal folds). The input of the network-based classifier was the HSV frames (256×224) and was classified as images with unobstructed or obstructed vocal fold view in the classifier output.
Figure 1:

A Schematic diagram for the automated deep learning approach, developed in this work. The HSV video frames serve as the input to the automated classifier. The detailed structure of the convolutional neural network is illustrated. The input frames are processed through several layers of 3×3 convolutions combined with rectified linear unit (ReLU) layers (in dark blue), followed by multiple 2×2 max pooling layers (in orange). The last layer includes a sigmoid layer (in green). The dimensions of the feature maps corresponding to the different convolutional layers are also included in the figure. The neural network classifies each frame into two classes as a classification output: either a frame with unobstructed vocal fold/s or a frame with obstructed vocal fold/s.
2.2.1. Network Training
A total of 11,800 HSV frames were manually selected and extracted from six HSV recordings of three normal participants and three patients – creating an image dataset by which the network was trained and validated. The manual selection of the HSV frames was important to provide a robust training and a thorough evaluation of the developed network. These chosen frames were manually labeled by a rater into two classes/groups: half of the frames (5,900) were labeled as unobstructed vocal fold frames showing the presence of vocal folds while the other 5,900 frames were labeled as obstructed vocal fold/s. For the first class (“Unobstructed Vocal Fold”), the frames were selected such that all different phonatory gestures and events that may occur during running speech were represented. For example, we selected frames during sustained vocal fold vibration, pre-phonatory adjustments, phonation onset/offset, no vocal fold vibration, and involuntary movements of vocal folds, particularly in AdSD patients, when spasms occurred.
For the second class (“Obstructed Vocal Fold”), we considered frames that displayed all various types of vocal fold obstructions. Generally, an obstruction was defined as whether the true vocal folds (not including the false folds and their vibrations) are visible enough to extract useful information about the vibratory measures and draw conclusions for assessment. Hence, two criteria were applied to recognize the image obstructions of true vocal folds: (1) a frame where at least no part of one of the true vocal folds was visible and/or (2) a frame with more than 50% of either or both of true folds covered/obstructed. Vocal fold obstruction occurred due to the following: epiglottis movements, which could completely cover the vocal fold/s, the movements of the left/right arytenoid cartilages, laryngeal constriction, false vocal folds movements, or a combination of any of these various obstruction types. Moreover, movements of the larynx during connected speech could shift the location of the vocal folds outside the view of the endoscope, which was considered under the obstructed class since the vocal folds were not visible.
The total of 11,800 frames were randomly divided into two independent datasets, where 10,620 frames (90%) formed a training dataset, and 1,180 frames (10%) were assigned for a validation dataset. The validation dataset was created in order to tune the hyperparameters of the network and avoid any overfitting that may occur during training. These hyperparameters were mainly used to control and adjust the learning and training process. An additional 2,250 HSV frames were manually extracted and labeled from the HSV recording of an AdSD participant who was not included in training of the network. Those labeled frames constituted a testing dataset, which was important to verify the generalization capability of the trained network on a set of new images. Data augmentation was applied to the training dataset to improve the flexibility of the trained network against the excessive laryngeal maneuvers in running speech, which alter the spatial location of the vocal folds across HSV frames. To do so, the training HSV frames were randomly translated along the vertical and horizontal directions, upscaled/downscaled, and rotated.
Adam optimizer, a stochastic gradient descent optimizer, was used for training the deep-learning network to minimize the loss of function during training [47]. We used an initial learning rate of .001, which represents the rate of updating/tuning the parameters of the network during training. The three hyperparameters of the solver, used in the training, were considered to control the learning process during training the network as follows. The decay rates were set as β1 =0.9 and β2 =0.999 for the first-order and second-order moments, which determined the amount of decay in the learning rate during training. The third parameter is Epsilon, which was set by 10−8; this small number was used to avoid any division by zero during training. The training was performed with a batch size of 16 (the number of images processed in each iteration of the training) for a maximum of 20 epochs (which is the maximum number of training iterations). Different networks were trained and the best performing network on the validation dataset was considered for testing. During the training, both training and validation datasets were shuffled before each epoch and prior to each network validation. An early stopping criterion was used during training based on monitoring the validation loss. Validation loss refers to the classification error found on the validation dataset when the network was tested against the validation images during training. The predicted outcome of the trained network returned one of two labels (either “Unobstructed Vocal Fold” or “Obstructed Vocal Fold”), which referred to the class that the input frame belonged to.
2.3. Robustness Evaluation
The trained deep neural network was tested in order to evaluate the generalizability of the trained network. Additionally, the robustness of the trained network was evaluated through the comparison of automated and visual classifications for the entire HSV recordings of two participants. A rater visually analyzed the recordings of a vocally normal participant (264,400 HSV frames) and a participant with AdSD (399,384 HSV frames). The rater utilized a playback software (PFV4 Photron FASTCAM Viewer, Photron USA, Inc., San Diego, CA) to analyze the HSV recordings. The playback speed of 30 frames per second was used to indicate the vocal fold obstruction across different frames. A frame was counted as obstructed when at least one of the vocal folds was not visible or less than 50% of the vocal fold/s were visible. The rater had the option to play forward and backward the HSV recording as many times as needed to precisely identify the time window for obstructions. The timestamps (frame numbers) between the beginning and ending of each obstruction was determined for the entire HSV data of the two participants.
The visual measurements from the rater were used to validate the automated deep-learning technique, developed in this study. A comparison was held between the manual analysis and the automated technique on each individual frame of the two HSV recordings. This comparison was an important step to rigorously and properly evaluate the performance of the introduced deep-learning scheme given that each of the HSV recording had more than 250,000 images.
2.4. Evaluation Metrics
We used the confusion matrix as a quantitative measurement to assess the performance of the trained network against the testing and validation frames. The confusion matrix demonstrated how accurate the trained deep neural network recognized the frames for each class (“Unobstructed Vocal Fold” class and “Obstructed Vocal Fold” class). From the confusion matrix, we used different metrics to evaluate the performance of the trained network on predicting each class in the testing/validation dataset: i.e., class sensitivity, specificity, precision, F1-score, and the overall testing accuracy of the network.
The sensitivity and specificity of the trained network are the measures of the network ability to correctly predict the output based on the class label of each frame. These measures were computed using the following equations:
| (1) |
| (2) |
TP (true positive) was the number of frames for which the trained network correctly predicted the positive class (frames with an unobstructed view). TN (true negative) was the number of frames for which the trained network correctly predicted the negative class (frames with an obstructed view). In contrast, FP (false positive) and FN (false negative) were the number of incorrectly classified frames as images with unobstructed and obstructed view, respectively.
The sensitivity and specificity scores were utilized to obtain the receiver operating characteristics curve. This curve is a plot between “sensitivity” versus “1 – specificity”. When a frame is fed into the network, the output of the network would be the probability (between 0–1) of the frame belonging to the two classes (the probability for this frame to either have obstructed or unobstructed view). Based on a threshold value, the network decides the classification of such frame. The receiver operating characteristics curve is generated by adjusting this threshold in an interval between 0 to 1; at each threshold, the sensitivity and specificity are computed. The computed values of specificity and sensitivity are plotted to generate the receiver operating characteristics curve. The area under the curve is calculated as an overall evaluation of the network performance and a measure of its accuracy.
The precision of correctly predicting each class was calculated from the following equation:
| (3) |
The F1-score (also called F score) was included in the analysis of the present work as another measure of accuracy to evaluate the performance of the trained network. F1-score was computed based on the precision and sensitivity scores of each class as shown in equation (4), where a high F1-score means that the trained network had low number of incorrect frame classifications for both classes.
| (4) |
The overall accuracy of the trained network when applied to the testing frames was determined using the following equation:
| (5) |
Besides using these quantitative measures to evaluate the developed network on the testing dataset, these metrics were also utilized for the robustness evaluation of this work. As such, a confusion matrix was generated to assess the performance of the developed automated technique against the visual analysis of the two HSV recordings. Based on the two generated confusion matrices, the discussed evaluation metrics were considered to assess the performance of classifying each frame in the two videos as obstructed or unobstructed.
3. Results
A sample of manually labeled frames from the training dataset is shown in Figure 2. The figure depicts the two different classes of frames considered during the training: “Unobstructed and Obstructed Vocal Fold”. Under the “Unobstructed Vocal Fold” class, frames from different phonatory events at various gestures in connected speech are depicted such as during vocal fold sustained vibration, phonation onsets/offsets, and no vibration. In contrast, the “Obstructed Vocal Fold” group displays different configurations of vocal fold obstructions that were observed during running speech. The figure presents partial/full obstructions due to epiglottis, arytenoid cartilages, laryngeal constriction, false vocal folds, or when vocal folds fall outside the view of endoscope.
Figure 2:

A sample of classified HSV images during connected using the manual analysis (visual classification). The two sets of three columns display the two different groups of frames: “Unobstructed Vocal Fold” showing the presence of the true vocal folds and “Obstructed Vocal Fold” demonstrating an obstructed view of vocal fold/s.
The results of applying the automated deep learning approach on the testing dataset is presented in Figure 3. A sample of random frames from the testing dataset is presented in the figure, which are classified and labeled by the developed automated approach. The figure depicts the classification outcome of the trained network for both “Unobstructed Vocal Fold” class (left side panels) and “Obstructed Vocal Fold” class (right side panels). For each class, different testing frames are shown displaying various unobstructed views of the vocal folds and different configurations of obstructed views of the vocal fold/s. Almost all the frames, included in the figure, show a correct classification of the developed tool. The figure includes only one misclassified frame in the “Obstructed Vocal Fold” class (the right side frame in the second row), which was supposed to be classified in the “Unobstructed Vocal Fold” class.
Figure 3:
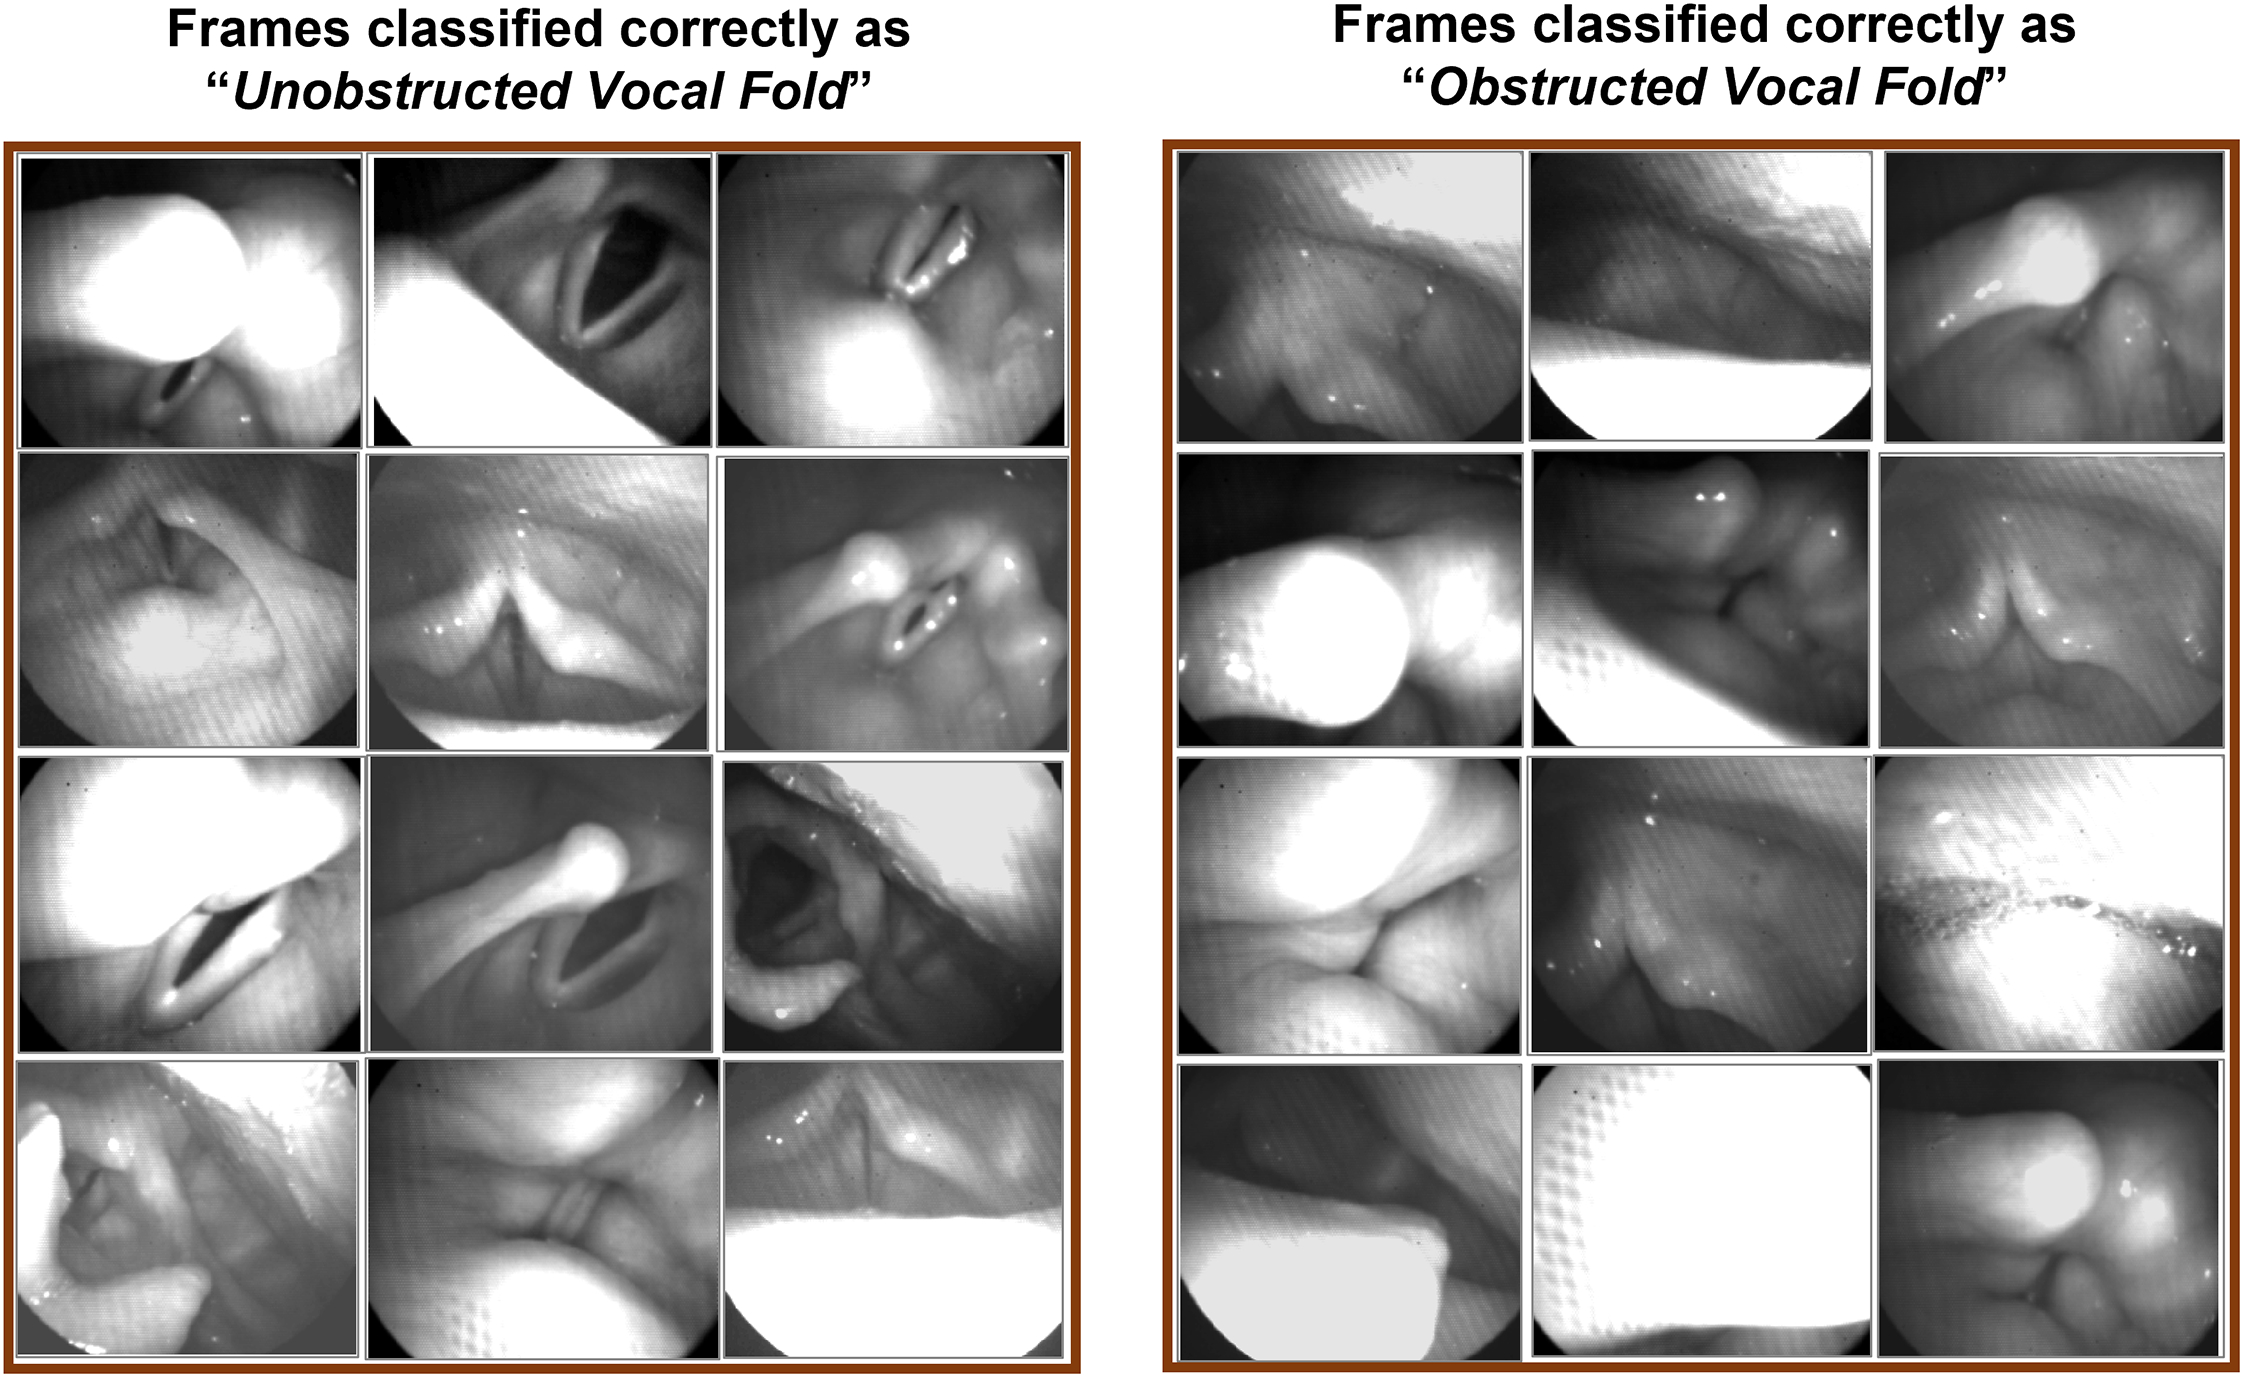
The classification results using the automated deep learning approach on the testing dataset. The two sets of three columns display the correctly classified frames of the testing dataset as “Unobstructed Vocal Fold” (left side panels) and “Obstructed Vocal Fold” (right side panels).
The performance of the developed CNN is demonstrated using confusion matrices when the trained network is applied to the validation and testing datasets as shown in Figure 4. The horizontal and vertical labels in the two matrices represent the predicted outcome of the classifier and the true visual observation classes, respectively. The cells show the number of correctly classified (in blue) and misclassified (in orange) frames in the “Unobstructed Vocal Fold” class and “Obstructed Vocal Fold” class, which are represented in the figure as “VF” and “No VF”, respectively. The associated accuracies of each classification are also represented in the green cells. As can be seen, the overall accuracies of detecting vocal fold/s in the validation and testing frames are 99.15% and 94.18% (shown inside the dark green cells). In both datasets, the network has a slightly higher accuracy in terms of recognizing the vocal folds in the frames than detecting an obstructed view of the vocal fold/s. This slight difference can be seen from the precision values of each class in the figure (in the two light green cells in the bottom row of the matrices): 99.66% versus 98.64% in the validating frames and 97.24% versus 91.11% in the testing frames, respectively. The two light green cells in the right columns of the matrices show the sensitivity and specificity of detecting vocal fold obstruction in the frames in percent, which are 99.66% and 98.66% for the validation dataset and 97.06% and 91.62% for the testing dataset, respectively. Furthermore, the F1-score in the validation dataset was 0.99 for both the Unobstructed and Obstructed Vocal Fold classes, while these scores marginally dropped to 0.94 in the testing dataset.
Figure 4:

Confusion matrices of the deep learning network, showing its performance on classification of the validation dataset (panel A) and the testing dataset (panel B). Blue and orange cells refer to the number of frames/images in each category, and the green cells represent the associated accuracy of each row and column – noting that the overall classifier’s accuracy is highlighted in the dark green cells. The horizontal labels represent the predicted outcome of the classifier on the “Unobstructed Vocal Fold” class (VF) and “Obstructed Vocal Fold” class (No VF). The vertical labels refer to the ground-truth labels observed by the rater for each class.
The receiver operating characteristics curve of the developed CNN is illustrated in Figure 5. The figure depicts the curve (in blue) when the network was implemented for the validation dataset (panel A) and testing dataset (panel B). The closer the curve is to the upper left corner, the higher the overall accuracy of the CNN. The diagonal red line represents points where Sensitivity=1-Specificity. Along with the curve, the value for the area under the curve (AUC) is included in the figure. As can be seen, both validation and testing curves show almost the same behavior. AUC of the validation and testing dataset curves are almost 1.00.
Figure 5:

The sensitivity-specificity curve (receiver operating characteristics curve), in blue, for the validation dataset (panel A) and the testing dataset (panel B). AUC refers to the area under the sensitivity-specificity curve. The diagonal red line represents points where Sensitivity=1-Specificity.
The robustness evaluation of the proposed automated classifier was done through comparison between the CNN performance and manual analysis classification using two complete HSV recordings for a vocally normal participant and a patient with AdSD. The results of the comparison are listed in Table 1 for 264,400 HSV images from the vocally normal participant and 399,384 images from the patient. In the vocally normal participant, the manual analysis reveals that 38,497 out of 264,400 frames (14.56%) with an obstructed view of vocal fold/s, and the automated analysis shows almost a similar number of frames, 39,009 (14.75%). Likewise, in the patient, the manual and automated analysis demonstrate close number of frames for the obstructed vocal fold/s: 96,571 versus 97,545 out of 399,384 frames (24.18% versus 24.42%), respectively. The difference in the detected number of frames with an obstructed vocal fold/s between the automated technique and the manual observation is 512 (0.19%) and 974 (0.25%) for the vocally normal and disordered participant, respectively.
Table 1.
Robustness evaluation: A comparison between the visual observation versus the automated technique in terms of number/percent of frames with obstructed view of vocal fold/s in the entire HSV recordings for a vocally normal participant and a patient with AdSD
| # HSV Frames | # Obstructed Frames | % Obstructed Frames | Difference (# Frames) | Difference (%) | |
|---|---|---|---|---|---|
| Normal participant | |||||
| Visual observation | 264,400 | 38,497 | 14.56 | 512 | 0.19 |
| Automated analysis | 39,009 | 14.75 | |||
| Patient with AdSD | |||||
| Visual observation | 399,384 | 96,571 | 24.18 | 974 | 0.25 |
| Automated analysis | 97,545 | 24.42 |
The two confusion matrices for the robustness evaluation are presented in Figure 6 for a detailed comparison of the proposed CNN against the manual analysis – using the same two HSV recordings in Table 1. The two matrices in Figure 6 have the same formatting and color code as in Figure 4. For the vocally normal participant in Figure 6 (panel A), the manual analysis shows 225,852 frames with an unobstructed view of the vocal fold/s and 38,548 frames with an obstructed vocal fold/s view; based on the manual analysis, the proposed CNN demonstrates correct classification of 221,955 (98.27%) and 35,112 frames (91.09%), respectively. In the HSV video for the patient (panel B), the automated method shows a successful identification of the unobstructed and obstructed vocal fold view in 287,055 out of 302,700 frames (94.83%) and 81,900 out of 96,684 frames (84.71%). Furthermore, the developed automated approach shows an overall accuracy of 97.23% and 92.38% for the entire HSV video of the vocally normal participant and the patient, respectively. The overall accuracy is measured as the network ability in recognizing both the presence and absence of the vocal fold/s in the HSV frames correctly.
Figure 6:
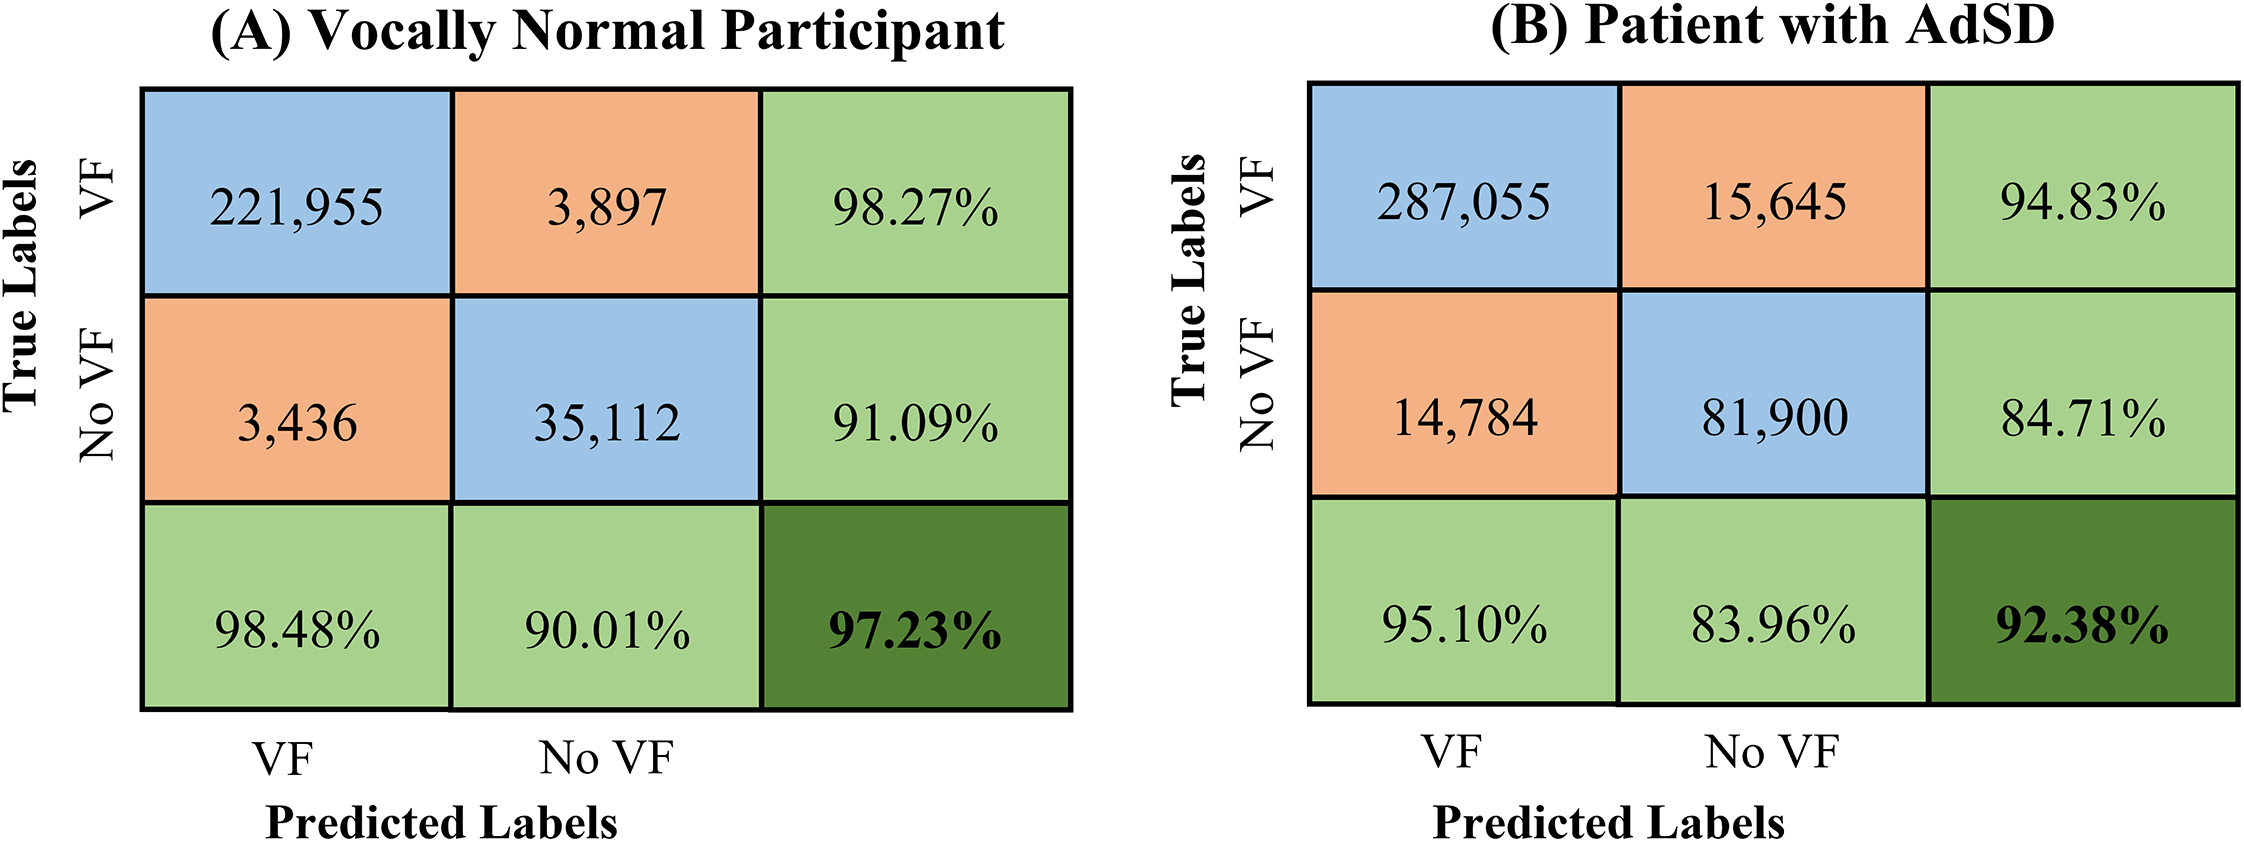
Confusion matrix of the developed deep learning network for classification of HSV recordings of a vocally normal participant (panel A) and a patient with AdSD (panel B). The blue and orange cells refer to the number of frames/images in each category, and the green cells represent the associated accuracy of each row and column – noting that the overall classifier accuracy is highlighted in the dark green cell. The horizontal labels represent the predicted outcome of the classifier on the “Unobstructed Vocal Fold” class (VF) and “Obstructed Vocal Fold” class (No VF). The vertical labels refer to the ground-truth labels, which are visually/manually observed for each class.
Similar to Figure 4, the evaluation metrics resulted from applying the proposed automated classifier on the two manually analyzed HSV videos for each class are represented as light green cells in Figure 6. In the normal participant recording, the automated technique has a sensitivity and specificity of 98.27% and 91.09% with respect to recognizing vocal fold/s obstruction in HSV frames whereas these values fall to 94.83% and 84.71% in the patient recording. The CNN precision scores are higher for the “Unobstructed Vocal Fold” class with 98.48% and 95.10% for the norm and disorder, respectively, compared to the “Obstructed Vocal Fold” class with 90.01% and 83.96%. A similar behavior was found with respect to F1-scores for both HSV videos – 0.98 and 0.95 for the “Unobstructed Vocal Fold” class and 0.91 and 0.84 for the “Obstructed Vocal Fold” class.
Figure 7 shows the resulted receiver operating characteristics curve of the introduced classifier (in blue) for the two HSV videos (for robustness evaluation) of the vocally normal participant (panel A) and the patient with AdSD (panel B). The figure shows the change in the network threshold of the binary classification with respect to sensitivity and specificity of the developed classifier in recognizing the vocal fold obstruction over the entire video frames. As can be seen, the classifier shows a better performance with larger area under the curve when analyzing the normal participant’s HSV sequence than that of the patient’s. This is clear when comparing the two corresponding AUC of videos – shown in the bottom right corner of the panels in Figure 7. The AUC for the vocally normal participant is 0.99 while it marginally drops to 0.96 for the AdSD patient.
Figure 7:
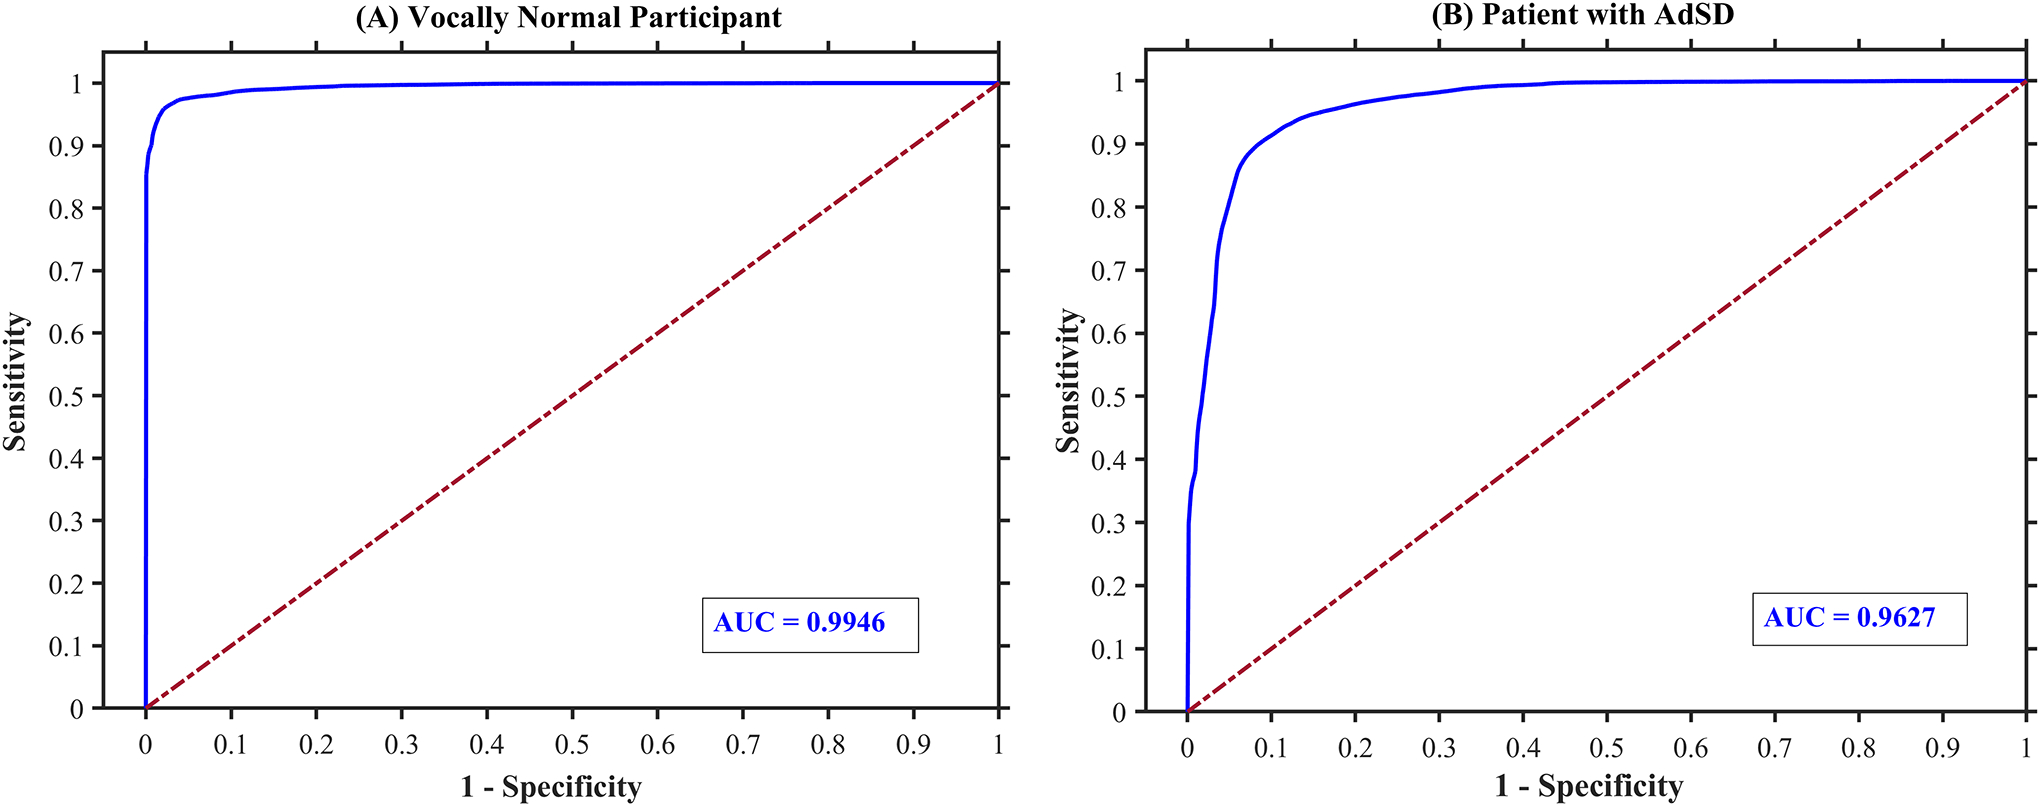
The sensitivity-specificity curve (receiver operating characteristics curve), in blue, of the developed deep learning network performance on binary classification of the entire two HSV videos of a vocally normal participant (panel A) and a patient with AdSD (panel B). AUC refers to the area under the sensitivity-specificity curve.
A detailed comparison between the automated technique against the visual/manual analysis is illustrated in Figure 8. The comparison is shown for each frame of the entire two HSV videos of the vocally normal participant (panel A) and the patient with AdSD (panel B). For each video sequence, the red and blue color represent the automated and manual method, respectively, for the instances during which vocal fold/s were visually obstructed. As can be seen in the figure, the results of the automated and visual detection display a similar pattern. Besides visual assessment, the accumulated overall accuracy (in solid black line), precision of detecting obstructed view of vocal fold/s (in dotted dark red line), and precision of detecting unobstructed view of vocal folds (in dashed green line) are also illustrated in the figure. The accuracies represent the performance of the developed classifier as a function of time for each HSV video. The accuracies were computed at accumulated time step of 1,000 frames over the entire length of the videos. That is, for each time step, the confusion matrix was generated to evaluate the performance of the automated technique versus the manual analysis on classifying the accumulated number of frames; these generated matrices were then used to compute the accumulated accuracies over the video sequence. As such, the values of the three accuracies at the end of each video (at the last frame) refer to the accuracies over the entire HSV video frames, which was shown in Figure 6. As can be seen in Figure 8, both the overall accuracy and the precision of recognizing unobstructed view of vocal folds have nearly similar behavior with high values across each video’s frames. In line with the previous results, the precision of detecting obstructed view of vocal fold/s demonstrates slightly lower values than that of the unobstructed class over the entire video frames; the two curves also show different trends as well.
Figure 8:

Comparison between automated (in blue) and manual (in red) analysis of the instances during which vocal fold/s are obstructed. The comparison shown for the entire two HSV videos of a vocally normal participant (panel A) and a patient with AdSD (panel B). The accumulated overall accuracy (in solid black line), precision of detecting obstructed view of vocal fold/s (in dotted brown line), and precision of detecting unobstructed view of vocal fold/s (in dashed green line) are also illustrated.
4. Discussion
In the present work, we successfully developed a deep learning technique as a classifier to automatically detect the vocal fold obstruction in HSV data, recorded during connected speech. The introduced automated framework was developed and implemented based on HSV recordings of vocally normal individuals and patients with AdSD. We created a robust training dataset through a sample of visually labeled HSV frames, displaying various obstructed and unobstructed vocal fold views. The deep neural network was built using CNN and was successfully trained and validated on the dataset to classify HSV frames into two classes: frames with or without vocal fold/s obstruction. The overall visual evaluation of the performance of the trained network showed high capability in recognizing the vocal fold obstruction in HSV video frames.
The results of implementing the trained CNN on a testing dataset, which was created from an HSV dataset on which the network was not trained, demonstrated high classification capability of the network in detecting different obstructions of the vocal fold/s with overall accuracy of 94.18%. This indicated how the presented automated approach was flexible and general toward classifying the vocal fold obstruction of new HSV data from different participants with a high sensitivity and specificity of 97.24% and 91.11%. The developed network also returned high F1-score of 0.94 when applied to the testing dataset. This high F1-score revealed the high precision of the developed framework towards classifying the different obstructed views of the vocal fold/s in the HSV frames.
A robustness evaluation was done to assess the performance of the trained CNN-based classifier by a thorough comparison between the results of the automated method against the manual analysis of the HSV recordings for two participants. The two videos were selected from two different individuals: one from a vocally normal person and another from a patient with AdSD. The comparison was conducted on the entire of the two HSV videos (consisting of 264,400 and 399,384 frames; over half a million HSV images in total). This massive number of images (663,784 frames) was manually classified by a rater to compare the developed CNN against visual observation of the rater. The results of the comparison revealed a promising performance of the automated classifier against the visual analysis. The percentage of the total number of frames in the two HSV videos that showed an obstructed view of the vocal fold/s was almost the same between the manual observation and the automated analysis – 14.56% versus 14.75% in the vocally normal individual’s HSV video and 24.18% versus 24.42% in the patient’s HSV video, respectively. As found in this study, the patient showed a higher number of frames with an obstructed view of the vocal fold/s, which can be explained by excessive laryngeal spasms in the AdSD patient. A more detailed comparison of the degree and type of obstructions between the norm and AdSD patients will be done in a future work.
The high robustness of the developed technique in classifying laryngeal HSV data against the enormous number of manually labeled frames is an apparent advantage over the previously introduced classifiers. This is because the previous deep learning models were tested against considerably limited sizes of images at around 720 [37, 38, 39] , 1,176 [41], and 5,234 laryngoscopic images [40], which were extremely smaller than the number of images we used for assessing our automated technique. The comparison between the manual and automated classification on each individual frame was further extended over the two HSV recordings by generating confusion matrices. Different metrics were used, based on the resulted confusion matrices, to provide a detailed evaluation of the developed CNN performance in this comparison: sensitivity, specificity, precision, F1-Score, and accuracy for detecting the obstructed/unobstructed view of the vocal fold/s in the HSV frames. Overall, the proposed deep learning approach demonstrated high robustness when applied to the two HSV videos against the visual observation with overall accuracies above 92%. The automated technique showed a better performance with higher accuracy when identifying the vocal fold/s in the frames than when recognizing an obstructed view of the vocal fold/s. The reason for this was that the vocal fold/s can be obstructed in different ways and configurations in connected speech – imposing a more challenging view for the automated approach. Furthermore, the developed network showed higher overall accuracy in the vocally normal participant’s recording (97.23%) than in the patient’s recording (92.38%). This is because, in running speech, patients with AdSD demonstrate an increase in laryngeal maneuvers and complex vocal fold obstructions than vocally normal persons, imposing more challenging conditions for the developed technique to maintain a high classification accuracy. These complex obstructions could be due to, for instance, epiglottis, left/right arytenoid cartilages, laryngeal constriction, false vocal folds, or any combination of these. In addition, the developed network had few challenges in detecting the frames with partial vocal fold obstructions. This is because, in the manual labeled data used for training, it was challenging for the rater to exactly determine partial vocal fold obstruction – such that if more than 50% of the vocal fold/s was obstructed, the frame would be classified as a frame with vocal fold obstruction.
This paper is the first work that developed and applied a fully automated deep learning approach in order to detect vocal fold obstructions in HSV data during connected speech. To the best of our knowledge, there are no other studies in literature that used a state-of-the-art deep learning technique as a classifier for frame selection on HSV recordings; instead, several studies implemented deep learning schemes to laryngoscopic images [40, 41]. The HSV data used in the present work in running speech exhibit lower image quality along with excessive laryngeal movements and significant changes in glottal posture, which impose considerable challenges upon applying the deep learning approaches compared to high-quality laryngoscopic images. In spite of these challenges, the developed approach was highly successful as a classifier in automatically selecting HSV frames based on the presence and absence of the vocal fold/s. The introduced technique achieved overall classification accuracy of 94.18% on the testing dataset, which is even a comparative accuracy against the accuracies found in literature using the better-quality/less challenging laryngoscopic images at 86–96% [40, 41]. This, therefore, demonstrates that the present deep leaning-based approach not only proved its high robustness in classifying HSV data against a huge number of manually labeled frames but also revealed a promising performance in HSV data with challenging image quality in connected speech.
Although the purpose of this study was to develop an automated technique for detecting vocal fold obstructions in HSV data with challenging conditions in running speech, the developed tool needs to be tested on a larger number of participants. The proposed method will be used in future on more subjects with and without voice disorders to further check its generalizability.
5. Conclusion
The developed deep-learning tool can accurately perform an automated frame selection task in HSV recordings, even with a challenging image quality, to recognize and classify HSV frames with clear view of vocal folds. Also, it can provide precise analysis to investigate laryngeal maneuvers in AdSD patients within running speech. Furthermore, the findings of the present work could assist in developing appropriate passages and speech texts with minimal obstructed view of the vocal fold/s for a more effective voice assessment in connected speech. In future work, we will apply the proposed methodology to a large number of participants to thoroughly compare the HSV obstruction data between norm and AdSD. By doing so, diagnostically relevant information could be extracted from HSV data during running speech in AdSD.
Acknowledgments:
We acknowledge the support from NIH/NIDCD, K01DC017751 “Studying the Laryngeal Mechanisms Underlying Dysphonia in Connected Speech” and Michigan State University Discretionary Funding Initiative.
Biographies
Vitae
Ahmed M. Yousef, MSc, is a PhD student in the Analysis of Voice and Hearing Laboratory (AVAH Lab) at the Department of Communicative Sciences and Disorders, Michigan State University. He received his B.Sc. and M.Sc. in 2013 and 2016, respectively, from the Mechanical Engineering Department at Alexandria University, Egypt. Ahmed aims to use his background in mechanical modeling and fluid dynamics to study and model voice biomechanics. He finds this work to be rewarding in being able to do research in an area that will have a positive impact in the quality of life of people with voice disorders.

Dimitar D. Deliyski, PhD, is Professor and Chairperson of the Department of Communicative Sciences and Disorders at Michigan State University. His research interests have focused on improving the clinical assessment of voice and speech disorders, refining the understanding of the mechanisms of voice production, creating new methods for computer imaging of the vocal folds and for acoustic analysis of voice and speech. He is the recipient of the 2017 Quintana Research Award bestowed by the Voice Foundation for his lifetime achievements in designing and utilizing technology and applying engineering principles to voice science.

Stephanie R.C. Zacharias, PhD, CCC-SLP is a licensed Speech-Language Pathologist and is currently a Research Scientist at Mayo Clinic, Arizona, in Dr. David Lott’s Head and Neck Regenerative Medicine Lab. Dr. Zacharias is concurrently building a Pediatric Voice Clinic at Phoenix Children’s Hospital. Clinical and Research interests include assessment, treatment, and voice outcomes in pediatric voice and use of high-speed videoendoscopy. She has published and presented nationally and internationally on various topics of pediatric voice and voice disorders.

Maryam Naghibolhosseini, PhD, is an Assistant Professor in the Department of Communicative Sciences and Disorders and the Director of the Analysis of Voice and Hearing Laboratory (AVAH Lab) at Michigan State University. Her research is focused on studying voice production, computational modeling of voice biomechanics, and voice quality measurement. She is applying advanced image processing, machine learning and statistical analysis techniques in her research. She was the recipient of the 2020 Early Career Contributions in Research (ECCR) Award of the American Speech-Language-Hearing Association (ASHA).

Footnotes
Declaration of Interest:
The authors declare that they have no conflict of interest.
Submission Declaration and Verification:
The work described has not been published previously. Portions of this work have been presented at the 50th Anniversary Symposium: Care of the Professional Voice, Philadelphia, PA, June 2–6, 2021. This manuscript is not under consideration for publication elsewhere, its publication is approved by all authors and tacitly or explicitly by the responsible authorities where the work was carried out, and if accepted, it will not be published elsewhere in the same form, in English or in any other language, including electronically without the written consent of the copyright-holder.
References
- [1].Chetri DK, Merati AL, Blumin JH, Sulica L, Damrose EJ and Tsai VW, “Reliability of the perceptual evaluation of adductor spasmodic dysphonia,” An Otol Rhinol Laryngol, vol. 117, pp. 159–165, 2008. [DOI] [PubMed] [Google Scholar]
- [2].Roy N, Gouse M, Mauszycki SC, Merrill RM and Smith ME, “Task specificity in adductor spasmodic dysphonia versus muscle tension dysphonia,” The Laryngoscope, vol. 115, no. 2, pp. 311–316, 2005. [DOI] [PubMed] [Google Scholar]
- [3].Roy N, Mazin A and Awan SN, “Automated acoustic analysis of task dependency in adductor spasmodic dysphonia versus muscle tension dysphonia,” The Laryngoscope, vol. 124, no. 3, pp. 718–724, 2014. [DOI] [PubMed] [Google Scholar]
- [4].Boutsen F, Cannito MP, Taylor M and Bender B, “Botox treatment in adductor spasmodic dysphonia: a meta-analysis,” J Sp Lang Hear Res, vol. 45, pp. 469–481, 2002. [DOI] [PubMed] [Google Scholar]
- [5].Morrison MD and Rammage LA, “Muscle misuse voice disorders: description and classification,” Acta oto-laryngologica, vol. 113, no. 3, pp. 428–434, 1993. [DOI] [PubMed] [Google Scholar]
- [6].Yiu E, Worrall L, Longland J and Mitchell C, “Analysing vocal quality of connected speech using Kay’s computerized speech lab: a preliminary finding,” Clin Linguist & Phon, vol. 14, no. 4, pp. 295–305, 2000. [Google Scholar]
- [7].Halberstam B, “Acoustic and perceptual parameters relating to connected speech are more reliable measures of hoarseness than parameters relating to sustained vowels,” ORL, vol. 66, no. 2, pp. 70–73, 2004. [DOI] [PubMed] [Google Scholar]
- [8].Maryn Y, Corthals P, Van Cauwenberge P, Roy N and De Bodt M, “Toward improved ecological validity in the acoustic measurement of overall voice quality: combining continuous speech and sustained vowels,” J Voice, vol. 24, no. 5, pp. 540–555, 2010. [DOI] [PubMed] [Google Scholar]
- [9].Lowell SY, “The acoustic assessment of voice in continuous speech,” SIG 3 Perspectives on Voice and Voice Disorders, vol. 22, no. 2, pp. 57–63, 2012. [Google Scholar]
- [10].Pietruszewska W, Just M, Morawska J, Malinowski J, Hoffman J, Racino A, Barańska M, Kowalczyk M and Niebudek-Bogusz E, “Comparative analysis of high-speed videolaryngoscopy images and sound data simultaneously acquired from rigid and flexible laryngoscope: a pilot study,” Scientific Reports, vol. 11, no. 1, pp. 1–14, 2021. [DOI] [PMC free article] [PubMed] [Google Scholar]
- [11].Patel R, Dailey S and Bless D, “Comparison of high-speed digital imaging with stroboscopy for laryngeal imaging of glottal disorders,” Ann. of Otol., Rhinol & Laryngol, vol. 117, no. 6, pp. 413–424, 2008. [DOI] [PubMed] [Google Scholar]
- [12].Zacharias SRC, Myer CM, Meinzen-Derr J, Kelchner L, Deliyski DD and de Alarcón A, “Comparison of videostroboscopy and high-speed videoendoscopy in evaluation of supraglottic phonation,” Ann. of Otol., Rhinol & Laryngol, vol. 125, no. 10, pp. 829–837, 2016. [DOI] [PubMed] [Google Scholar]
- [13].Deliyski DD, Laryngeal high-speed videoendoscopy, in: Laryngeal evaluation: Indirect laryngoscopy to high-speed digital imaging, New York: Thieme Medical Publishers, 2010, pp. 243–270. [Google Scholar]
- [14].Echternach M, Döllinger M, Sundberg J, Traser L and Richter B, “Vocal fold vibrations at high soprano fundamental frequencies,” The Journal of the Acoustical Society of America, vol. 133, no. 2, pp. EL82–EL87, 2013. [DOI] [PubMed] [Google Scholar]
- [15].Deliyski DD, “Clinical feasibility of high-speed videoendoscopy,” SIG3 Perspectives on Voice and Voice Disorders, vol. 17, no. 1, pp. 12–16, 2007. [Google Scholar]
- [17].Deliyski DD and Hillman RE, “State of the art laryngeal imaging: Research and clinical implications,” Current Opinion in Otolaryngology & Head and Neck Surgery, vol. 18, no. 3, pp. 147–152, 2010. [DOI] [PMC free article] [PubMed] [Google Scholar]
- [18].Deliyski DD, Petrushev PP, Bonilha HS, Gerlach TT, Martin-Harris B and Hillman RE, “Clinical imple mentation of laryngeal high-speed videoendoscopy: Challenges and evolution,” Folia Phoniatrica et Logopaedica, vol. 60, no. 1, pp. 33–44, 2008. [DOI] [PubMed] [Google Scholar]
- [19].Woo P, “Objective measures of stroboscopy and high speed video,” Advances in Oto-Rhino-Laryngology, vol. 85, pp. 25–44, 2020. [DOI] [PubMed] [Google Scholar]
- [20].Mehta DD, Deliyski DD, Quatieri TF and Hillman RE, “Automated measurement of vocal fold vibratory asymmetry from high-speed videoendoscopy recordings,” Journal of Speech, Language, and Hearing Research, vol. 54, no. 1, pp. 47–54, 2011. [DOI] [PMC free article] [PubMed] [Google Scholar]
- [21].Deliyski DD, Powell ME, Zacharias SR, Gerlach TT and de Alarcon A, “Experimental investigation on minimum frame rate requirements of high-speed videoendoscopy for clinical voice assessment,” Biomed. Signal. Process. and Control, vol. 17, pp. 51–59, 2015. [DOI] [PMC free article] [PubMed] [Google Scholar]
- [22].Zañartu M, Mehta DD, Ho JC, Wodicka GR and Hillman RE, “Observation and analysis of in vivo vocal fold tissue instabilities produced by nonlinear source-filter coupling: A case study,” Journal of the Acoustical Society of America, vol. 129, no. 1, pp. 326–339, 2011. [DOI] [PMC free article] [PubMed] [Google Scholar]
- [23].Mehta DD, Deliyski DD, Zeitels SM, Zañartu M and Hillman RE, Integration of transnasal fiberoptic high-speed videoendoscopy with time-synchronized recordings of vocal function, innormal & abnormal vocal folds Kinematics: High speed digital phonoscopy (HSDP), optical coherence tomography (OCT) & narrow band imaging, vol. 12, San Fransisco, CA: Pacific Voice & Speech Foundation, 2015, pp. 105–114. [Google Scholar]
- [24].Naghibolhosseini M, Deliyski DD, Zacharias SR, de Alarcon A and Orlikoff RF, “Temporal segmentation for laryngeal high-speed videoendoscopy in connected speech,” J Voice, vol. 32, no. 2, pp. 256.e1–256.e12, 2018. [DOI] [PMC free article] [PubMed] [Google Scholar]
- [25].Yousef AM, Deliyski DD, Zacharias SRC, de Alarcon A, Orlikoff RF and Naghibolhosseini M, “Spatial segmentation for laryngeal high-speed videoendoscopy in connected speech,” J Voice, [Epub Ahead of Print], 2020. [DOI] [PMC free article] [PubMed] [Google Scholar]
- [26].Yousef AM, Deliyski DD, Zacharias SR, de Alarcon A, Orlikoff RF and Naghibolhosseini M, “A Hybrid Machine-Learning-Based Method for Analytic Representation of the Vocal Fold Edges during Connected Speech,” Applied Sciences, vol. 11, no. 3, p. 1179, 2021. [DOI] [PMC free article] [PubMed] [Google Scholar]
- [27].Yousef AM, Deliyski DD, Zacharias SR, de Alarcon A, Orlikoff RF and Naghibolhosseini M, “Automated detection and segmentation of glottal area using deep-learning neural networks in high-speed videoendoscopy during connected speech,” in In 14th International Conference on Advances in Quantitative Laryngology, Voice and Speech Research (AQL), Bogota, Colombia, 2021. [Google Scholar]
- [28].Naghibolhosseini M, Deliyski DD, Zacharias SR, de Alarcon A and Orlikoff RF, “A method for analysis of the vocal fold vibrations in connected speech using laryngeal imaging,” in Manfredi C (Ed.) Proceedings of the 10th International Workshop on Models and Analysis of Vocal Emissions for Biomedical Applications MAVEBA, Firenze University Press, Firenze, Italy, 2017. [Google Scholar]
- [29].Naghibolhosseini M, Deliyski DD, Zacharias SRC, de Alarcon A and Orlikoff RF, “Studying vocal fold non-stationary behavior during connected speech using high-speed videoendoscopy,” The Journal of the Acoustical Society of America, vol. 144, no. 3, pp. 1766–1766, 2018. [Google Scholar]
- [30].Naghibolhosseini M, Heinz N, Brown C, Levesque F, Zacharias SRC and Deliyski DD, “Glottal attack time and glottal offset time comparison between vocally normal speakers and patients with adductor spasmodic dysphonia during connected speech,” in 50th Anniversary Symposium: Care of the Professional Voice, Philadelphia, PA, 2021. [Google Scholar]
- [31].Naghibolhosseini M, Deliyski DD, Zacharias SRC, de Alarcon A and Orlikoff RF, “Glottal attack time in connected speech,” in The 11th International Conference on Voice Physiology and Biomechanics ICVPB, East Lansing, MI, 2018. [Google Scholar]
- [32].Brown C, Naghibolhosseini M, Zacharias SRC and Deliyski DD, “Investigation of high-speed videoendoscopy during connected speech in norm and neurogenic voice disorder,” in Michigan Speech-Language-Hearing Association (MSHA) Annual Conference, East Lansing, MI, 2019. [Google Scholar]
- [33].Olthoff A, Woywod C and Kruse E, “Stroboscopy versus high-speed glottography: A comparative study,” The Laryngo scope, vol. 117, no. 6, pp. 1123–1126, 2007. [DOI] [PubMed] [Google Scholar]
- [34].Popolo PS, “Investigation of flexible high-speed video nasolaryngoscopy,” J Voice, vol. 32, no. 5, pp. 529–537, 2018. [DOI] [PubMed] [Google Scholar]
- [35].Hinton G, “Deep Learning — A Technology With the Potential to Transform Health Care,” Journal of the American Medical Association, vol. 320, no. 11, p. 1101, 2018. [DOI] [PubMed] [Google Scholar]
- [36].Esteva A, Robicquet A, Ramsundar B, Kuleshov V, DePristo M, Chou K, Cui C, Corrado G, S T and Dean J, “A guide to deep learning in healthcare,” Nature Medicine, vol. 25, no. 1, pp. 24–29, 2019. [DOI] [PubMed] [Google Scholar]
- [37].Moccia S, Vanone GO, De Momi E, Laborai A, Guastini L, Peretti G, Mattos LS, “Learning-based classification of informative laryngoscopic frames,” Comput Methods Programs Biomed, vol. 158, pp. 21–30, 2018. [DOI] [PubMed] [Google Scholar]
- [38].Patrini I, Ruperti M, Moccia S, Mattos LS, Frontoni E and De Momi E, “Transfer learning for informative-frame selection in laryngoscopic videos through learned features,” Med Biol Eng Comput, vol. 58, no. 6, pp. 1225–1238, 2020. [DOI] [PubMed] [Google Scholar]
- [39].Galdran A, Costa P and Campilho A, “Real-Time Informative Laryngoscopic Frame Classification with Pre-Trained Convolutional Neural Networks,” in In: 2019 IEEE 16th International Symposium on Biomedical Imaging (ISBI 2019), Venezia, Italy, 2019. [Google Scholar]
- [40].Ren J, Jing X, Wang J, Ren X, Xu Y, Yang Q, Ma L, Sun Y, Xu W, Yang N and Zou J, “Automatic Recognition of Laryngoscopic Images Using a Deep-Learning Technique,” The Laryngoscope, vol. 130, no. 11, pp. E686–E693, 2020. [DOI] [PubMed] [Google Scholar]
- [41].Xiong H, Lin P, Yu JG, Ye J, Xiao L, Tao Y, Jiang Z, Lin W, Liu M, Xu J and Hu W, “Computer-aided diagnosis of laryngeal cancer via deep learning based on laryngoscopic images,” EBioMedicine, vol. 48, pp. 92–99, 2019. [DOI] [PMC free article] [PubMed] [Google Scholar]
- [42].Cho WK, Yeong JL, Joo HA, Jeong IS, Choi Y, Nam SY, Kim SY and Choi S, “Diagnostic Accuracies of Laryngeal Diseases Using a Convolutional Neural Network‐Based Image Classification System,” The Laryngoscope, vol. 131, no. 11, pp. 2558–2566, 2021. [DOI] [PubMed] [Google Scholar]
- [43].Russakovsky O, Deng J, Krause J, Satheesh S, Ma S, Huang Z, Karpathy K, Khosla A, Bernstein M, Berg AC and Fei-Fei L, “ImageNet large scale visual recognition challenge,” Int J Comput Vis, vol. 115, pp. 211–252, 2015. [Google Scholar]
- [44].Hirasawa T, Aoyama K, Tanimoto T, Ishihara S, Shichijo S, Ozawa T, Ohnishi T, Fujishiro M, Matsuo K, Fujisaki J, Tada T and e. al., “Application of artificial intelligence using a convolutional neural network for detecting gastric cancer in endoscopic images,” Gastric Cancer, vol. 21, pp. 653–660, 2018. [DOI] [PubMed] [Google Scholar]
- [45].Yu L, Chen H, Dou Q, Qin J and Heng PA, “Integrating online and offline three-dimensional deep learning for automated polyp detection in colonoscopy videos,” IEEE J Biomed Health Inform, vol. 21, pp. 65–75, 2017. [DOI] [PubMed] [Google Scholar]
- [46].Ronneberger O, Fischer P and Brox T, “U-Net: Convolutional networks for biomedical image segmentation,” in Int. Conf. Med. Image Comp. Comp.-ass. Interv. (MICCAI), Munich, Germany, 2015. [Google Scholar]
- [47].Kingma DP and Ba J, Adam: A method for stochastic optimization, arXiv preprint arXiv: 1412.6980., 2014. [Google Scholar]
- [48].Yousef AM, Deliyski DD, Zacharias SRC, de Alarcon A, Orlikoff RF, Naghibolhosseini M A Deep Learning Approach for Quantifying Vocal Fold Dynamics during Connected Speech using Laryngeal High-Speed Videoendoscopy. J Speech Lang Hear Res. 2022. In press. [DOI] [PMC free article] [PubMed] [Google Scholar]