Abstract
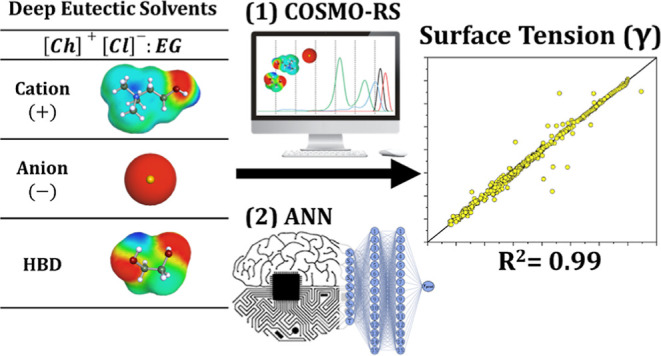
Studies on deep eutectic solvents (DESs), a new class of “green” solvents, are attracting increasing attention from researchers, as evidenced by the rapidly growing number of publications in the literature. One of the main advantages of DESs is that they are tailor-made solvents, and therefore, the number of potential DESs is extremely large. It is essential to have computational methods capable of predicting the physicochemical properties of DESs, which are needed in many industrial applications and research. Surface tension is one of the most important properties required in many applications. In this work, we report a relatively generalized artificial neural network (ANN) for predicting the surface tension of DESs. The database used can be considered comprehensive because it contains 1571 data points from 133 different DES mixtures in 520 compositions prepared from 18 ions and 63 hydrogen bond donors in a temperature range of 277–425 K. The ANN model uses molecular parameter inputs derived from the conductor-like screening model for real solvents (Sσ-profiles). The training and testing results show that the best performing ANN architecture consisted of two hidden layers with 15 neurons each (9–15–15–1). The proposed ANN was excellent in predicting the surface tension of DESs, as R2 values of 0.986 and 0.977 were obtained for training and testing, respectively, with an overall average absolute relative deviation of 2.20%. The proposed models represent an initiative to promote the development of robust models capable of predicting the properties of DESs based only on molecular parameters, leading to savings in investigation time and resources.
1. Introduction
The chemical industry is highly dependent on organic solvents, and most of these solvents are harmful, toxic, expensive, and generate waste residues, which can cause significant damage to health and safety and contribute to atmospheric pollution.1 Therefore, applying green chemistry and engineering concepts to more sustainable and environmentally friendly studies becomes necessary. Consequently, one of the 12 green chemistry concepts is that baleful solvents must be avoided, substituted with more sustainable alternatives, or used in limited quantities. Therefore, many researchers have focused their attention on developing greener solvents. These solvents must meet specific conditions to qualify as eco-efficient green media with characteristics such as biodegradability, recyclability, low price, accessibility, and nontoxicity.2
Due to the aforementioned reasons, research on ionic liquids (ILs) has accelerated and attracted considerable attention as a class of green solvents due to their unique physicochemical characteristics.3 ILs are salts in the liquid state, consisting mainly of organic cations with organic or inorganic anions with a low melting point (<373 K). Also, because of their lower vapor pressure, ILs are recyclable, making them more effective and environmentally friendly. However, the poor biodegradability and toxicity of some families of IL remain a challenge that obstructs their industrial application.4 Another problem with some ILs is their complex and expensive synthesis procedure.
To overcome the drawbacks of ILs, deep eutectic solvents (DESs) have been developed and are considered alternative green solvents to conventional organic solvents and ILs. Most DESs are generally inexpensive and simple to prepare from natural substances that are easily accessible.5 Abbott and his team reported in 2003 the first DES, where they considered a eutectic mixture composed of a quaternary salt (choline chloride) that functions as a hydrogen bond acceptor (HBA) and urea that functions as a hydrogen bond donor (HBD) in a molar ratio of (1:2).6 DESs can be defined as a mixture of two or more compounds with a melting point lower than the ideal mixture, where its eutectic point temperature deviates significantly from the ideal behavior. The depression is created by strong intermolecular force (H-bond) interactions between HBD and HBA and, in some cases, by other noncovalent interactions. DESs have been applied in the literature as an alternative to traditional solvents in many applications, such as catalysis, separation, biochemistry, electrochemistry, and nanotechnology. Therefore, understanding the physical properties of DESs in general and surface tension, in particular, is crucial to evaluating their feasibility in various applications.
Surface tension (γ) is defined as the tendency of the fluid to obtain the minimum possible surface area.7 Many experimental studies have reported on the surface tension of DESs.8 According to their findings, the main factors that affect the surface tension of DESs are their constituents, the composition of the mixtures, and the intermolecular interactions between HBAs and HBDs.8 For example, extremely viscous DESs (such as choline chloride-based ESs with polyols/sugars) have high surface tension.9 Nevertheless, obtaining experimental surface tension data for each DES is time-consuming and expensive because of the theoretically infinite combinations of HBA/HBDs and their molar ratios. Thus, the development of computational models to predict the surface tension of DESs is essential for their use in various applications.
Table 1 lists the predictive models available in the literature (to the best of our knowledge) for predicting the surface tension of DESs. Haghbakhsh et al.10 have developed three models utilizing a data set including 553 data points from 112 DES compositions. The first model utilizing corresponding states as inputs (Tc, Pc, Vc, and ω) demonstrated an average absolute relative deviation (AARD) of 8.80%. In their second paper, the authors developed another two models using group contribution and atomic contribution inputs, and their results showed that the group-contribution-based model performed the best with an AARD of 7.59%. Cea-Klapp et al.11 predicted the surface tension of DESs by combining the density gradient theory with the perturbed-chain statistical associating fluid theory (PC-SAFT + DGT). Their results showed that an AARD of 1.26% with a maximum variation of 8% was achieved for 34 DES compositions with 334 experimental data points. Also, because their method utilizes the PC-SAFT equation of state, the surface tension prediction trend for DESs with other co-solvent mixtures can also be qualitatively captured giving it an advantage over other approaches. Nonetheless, the method requires the density data in order to fit the PC-SAFT binary interaction parameters (kij) for each DES system. More recently, Khajeh12 developed two multiple linear regression (MLR) models with one model utilizing descriptors obtained from the Dragon Software and the other utilizing group contribution. The database utilized consisted of 126 DES compositions prepared from 781 experimental data points, and their results showed that the quantitative structure–property relationship (QSPR) model outperformed the group contribution model with AARD values of 3.67 and 5.16%, respectively.
Table 1. Comparison between the State-of-the-Art Models in the Literature for Predicting the Surface Tension of DESsa.
| year | number of DESs | data points | method | AARD % | refs |
|---|---|---|---|---|---|
| 2020 | 112 | 553 | CS | 8.80 | Haghbakhsh et al.10 |
| 2021 | 112 | 553 | GC, AC | 7.59, 7.80 | Haghbakhsh et al.13 |
| 2022 | 34 | 334 | PC-SAFT-DGT | 1.26 | Cea-Klapp et al.11 |
| 2022 | 126 | 781 | QSPR, GC | 3.67, 5.16 | Khajeh et al.12 |
| 2022 | 520 | 1571 | ANN | 2.20 | this work |
Abbreviations: CS: corresponding states, GC: group contribution, AC: atomic contribution, PC-SAFT-DGT: perturbed chain statistical associating fluid theory coupled with density gradient theory, QSPR: quantitative structure–property relationship, and ANN: artificial neural network.
Artificial neural networks (ANNs) have been developed as a powerful method for modeling complex processes. By applying experimental data throughout the learning phase, ANNs help determine the outputs of a system by finding patterns and interactions within a given data set.14 Numerous reports in the literature showed the high accuracy of molecular-based ANNs models for property prediction.15−17 For example, Bagh et al.16 evaluated the applicability of an ANN model to predict the electrical conductivities of 18 ammonium- and phosphonium-based DES and reported an AARD of 4.4%. Adeyemi et al.17 developed an ANN bagging model to predict the density of amine-based DES and reported an R2 value of 0.999 for nine DES. As for the surface tension property, to the best of our knowledge, no molecular-based machine learning (ML) model for predicting the surface tension of DESs has yet been reported. For the case of Ils, Atashrouz et al.18 predicted the surface tension of 59 ILs (801 data points) using an ANN model based on thermodynamic properties (lower boiling temperature, molar density, critical pressure, acentric factor, and critical compressibility factor). Their model achieved a remarkable performance with an AARD of 4.5%. Nonetheless, as with any modeling technique, ANN also suffer from several disadvantages such as their tendency to be overfitted, their high computational requirements, and their low interpretability that stems from their “black box” nature.19
Due to the critical role that surface tension plays in identifying the suitability of solvents, especially, in the operation and design of mass transfer processes such as extraction, absorption, and distillation,15 in this work, we develop the first ANN model that can predict the surface tension of DESs by simply correlating their molecular-level structure. The inputs of the ANN model are selected to be Sσ-profiles, which are molecular-based parameters that can easily be computed from COSMO-RS “conductor-like screening model for real solvents”. Sσ-profiles have previously been used in ML models such as MLR, support vector machines, genetic algorithms, and ANNs for their reliability in describing solvents and their mixtures.20 Also, to ensure that the developed ANN model is reliable and robust, the database used includes all the surface tension measurements of DESs published in the literature to the best of our knowledge up to the time of writing. Following model development, the ANN model was then externally validated and also tested through an applicability domain assessment. A schematic summary of the method used in this work is shown in Figure 1.
Figure 1.
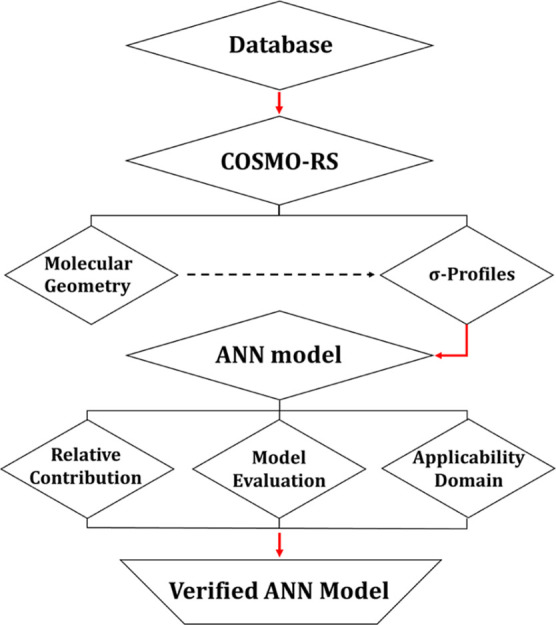
Summary of the methodology scheme used in this work.
2. Methods
2.1. Database
In this work, 1571 experimental data points on surface tension (γ/mN m–1) extracted from 133 different DES mixtures with 520 compositions prepared from 4 anions, 14 cations, and 63 HBDs were used to develop the ANN model. Table 2 lists the compositions and references of the DESs used. The data set covers a wide range of surface tension measurements (17.62–80.68 mN m–1) and temperatures (277–425 K) for binary and ternary DES compositions. Note that the data set does not account for the influence of pressure on the surface tension of DESs because pressure-dependent experimental data are not widely reported in the literature. Thus, the pressure has been fixed at 100 kPa for the data set. Additionally, because water is a critical factor that influences surface tension, the water content of all DESs was also considered in the mixture compositions. The experimental surface tension, DES compositions, temperatures, and corresponding references are given in full detail in Table S1 in the Supporting Information. Additionally, the surface tensions of all 520 DES compositions at 298 K are compiled and summarized in Table S2.
Table 2. List of Investigated DESs with Their temperature Range, Experimental Surface Tensions, Number of Data Points, and Corresponding Referencesa.
| # | abbreviation | T/K | γ/mN m–1 | n | refs |
|---|---|---|---|---|---|
| DES1 | [AcCh][Cl]:U | 313 | 65.10 | 1 | (21) |
| DES2 | [ATPP][Br]:DEG | 298–243 | 40.86–49.37 | 30 | (22) |
| DES3 | [ATPP][Br]:TEG | 298–243 | 40.11–48.25 | 30 | (23) |
| DES4 | [BA][Br]:Gly | 298 | 44.90 | 1 | (24) |
| DES5 | [BTP][Cl]:DEG | 293–353 | 32.71–66.68 | 7 | (25) |
| DES6 | [BTP][Cl]:EG | 298 | 66.93 | 1 | (26) |
| DES7 | [Ch][Cl]:1,2-ButOH | 293–311 | 31.10–34.70 | 40 | (27) |
| DES8 | [Ch][Cl]:1,3-ButOH | 293–311 | 31.90–40.10 | 40 | (27) |
| DES9 | [Ch][Cl]:1,4-ButOH | 293–311 | 45.30–47.60 | 50 | (27) |
| DES10 | [Ch][Cl]:2,3-ButOH | 293–311 | 32.30–35.60 | 40 | (27) |
| DES11 | [Ch][Cl]:BenA:H2O | 333–353 | 46.90–51.53 | 5 | (28) |
| DES12 | [Ch][Cl]:CA:H2O | 278–338 | 46.72–70.49 | 27 | (29, 30) |
| DES13 | [Ch][Cl]:CA | 313 | 60.35 | 1 | (31) |
| DES14 | [Ch][Cl]:DEG | 293–353 | 34.16–48.40 | 7 | (25) |
| DES15 | [Ch][Cl]:DGA | 303–343 | 58.30–67.69 | 5 | (32) |
| DES16 | [Ch][Cl]:EG:H2O | 278–338 | 54.15–56.90 | 25 | (33) |
| DES17 | [Ch][Cl]:EG | 277–298 | 45.70–51.40 | 64 | (27, 34) |
| DES18 | [Ch][Cl]:Fru | 298–358 | 59.00–75.00 | 28 | (35) |
| DES19 | [Ch][Cl]:Glu:H2O | 298–338 | 65.80–78.70 | 17 | (36) |
| DES20 | [Ch][Cl]:Glu | 293–358 | 68.60–75.00 | 18 | (37, 38) |
| DES21 | [Ch][Cl]:Gly:H2O | 313–333 | 42.55–56.12 | 2 | (30) |
| DES22 | [Ch][Cl]:Gly | 293–328 | 45.60–63.70 | 56 | (27) |
| DES23 | [Ch][Cl]:HexOH | 316–334 | 41.00–43.60 | 40 | (27) |
| DES24 | [Ch][Cl]:LacA:H2O | 313–333 | 32.02–42.42 | 2 | (30) |
| DES25 | [Ch][Cl]:LacA | 298–338 | 45.70–48.00 | 9 | (39) |
| DES26 | [Ch][Cl]:LevA:H2O | 298 | 39.35 | 1 | (40) |
| DES27 | [Ch][Cl]:Mal:H2O | 313–333 | 37.36–74.49 | 2 | (30) |
| DES28 | [Ch][Cl]:MalA:H2O | 323 | 57.10–68.20 | 4 | (41) |
| DES29 | [Ch][Cl]:MalA | 298–425 | 52.30–65.70 | 3 | (42) |
| DES30 | [Ch][Cl]:MEA | 298–358 | 44.40–49.60 | 28 | (43) |
| DES31 | [Ch][Cl]:Nin:H2O | 308–333 | 61.02–63.70 | 6 | (44) |
| DES32 | [Ch][Cl]:OA:H2O | 298 | 60.80 | 1 | (45) |
| DES33 | [Ch][Cl]:OA | 298 | 75.30 | 1 | (46) |
| DES34 | [Ch][Cl]:PAA:Act | 298 | 41.86 | 1 | (47) |
| DES35 | [Ch][Cl]:PEG200:Act | 298 | 22.55–45.56 | 9 | (48) |
| DES36 | [Ch][Cl]:PEG200:EtAc | 298 | 20.26–43.54 | 9 | (48) |
| DES37 | [Ch][Cl]:PEG200:Eth | 298 | 20.94–43.15 | 9 | (48) |
| DES38 | [Ch][Cl]:PEG200:FeCl3:Act | 298 | 22.54–39.97 | 9 | (48) |
| DES39 | [Ch][Cl]:PEG200:FeCl3:EtAc | 298 | 20.70–41.68 | 9 | (48) |
| DES40 | [Ch][Cl]:PEG200:FeCl3:Eth | 298 | 21.15–37.45 | 9 | (48) |
| DES41 | [Ch][Cl]:PEG200:FeCl3:H2O | 298 | 41.46–49.84 | 9 | (48) |
| DES42 | [Ch][Cl]:PEG200:FeCl3:IsoOH | 298 | 18.18–40.31 | 9 | (48) |
| DES43 | [Ch][Cl]:PEG200:H2O | 298 | 33.88–34.46 | 5 | (48) |
| DES44 | [Ch][Cl]:PEG200:H2O | 298 | 45.83–49.21 | 9 | (48) |
| DES45 | [Ch][Cl]:PEG200:IsoOH | 298 | 19.19–40.05 | 9 | (48) |
| DES46 | [Ch][Cl]:PEG200 | 298–353 | 35.97–55.03 | 28 | (49) |
| DES47 | [Ch][Cl]:PEG200:FeCl4 | 298–338 | 31.32–35.59 | 5 | (48) |
| DES48 | [Ch][Cl]:PEG400 | 298–338 | 43.12–45.62 | 5 | (48) |
| DES49 | [Ch][Cl]:PenOH | 298 | 47.50 | 1 | (45) |
| DES50 | [Ch][Cl]:Ph | 298 | 35.46 | 1 | (40) |
| DES51 | [Ch][Cl]:TFA:H2O | 313 | 35.90 | 1 | (21) |
| DES52 | [Ch][Cl]:U:H2O | 307–337 | 52.84–74.43 | 16 | (50) |
| DES53 | [Ch][Cl]:U:H2O | 293–425 | 38.70–57.20 | 8 | (51) |
| DES54 | [Ch][Cl]:Xyl:H2O | 278–338 | 70.36–80.68 | 25 | (29) |
| DES55 | [DEEA][Cl]:DEG | 293–353 | 33.67–64.95 | 7 | (25) |
| DES56 | [EA][Br]:Gly | 298 | 57.60 | 1 | (24) |
| DES57 | [EA][Cl]:Ace | 313 | 46.30 | 1 | (21) |
| DES58 | [EA][Cl]:TFA | 313 | 30.10 | 1 | (21) |
| DES59 | [EA][Cl]:U | 313 | 52.90 | 1 | (21) |
| DES60 | [MPPyr][N(SO2CF3)2]:EG | 298 | 38.00–38.40 | 3 | (34) |
| DES61 | [MTP][Br]:DEG | 293–353 | 29.92–62.74 | 7 | (25) |
| DES62 | [MTP][Br]:EG | 298–328 | 44.64–51.29 | 14 | (15, 38) |
| DES63 | [MTP][Br]:Gly | 298–328 | 55.95–59.35 | 7 | (38) |
| DES64 | [MTP][Br]:MDEA | 298–353 | 39.19–43.06 | 21 | (23) |
| DES65 | [MTP][Br]:MEA | 298–358 | 44.00–55.30 | 28 | (43) |
| DES66 | [MTP][Br]:TEG | 298–328 | 47.03–49.85 | 7 | (15) |
| DES67 | [N-DEEA][Cl]:EG | 298–328 | 44.57–51.29 | 14 | (15, 38) |
| DES68 | [N-DEEA][Cl]:Gly | 298–328 | 55.16–59.35 | 14 | (38) |
| DES69 | [N-DEEA][Cl]:TFA | 298–328 | 37.51–40.27 | 7 | (15) |
| DES70 | [PA][Br]:Gly | 298 | 51.70 | 1 | (24) |
| DES71 | [TBA][Br]:AA | 298 | 34.50 | 1 | (52) |
| DES72 | [TBA][Br]:DEG | 298–353 | 32.23–53.50 | 7 | (25) |
| DES73 | [TBA][Br]:EG | 298 | 53.31 | 1 | (26) |
| DES74 | [TBA][Br]:FA | 298 | 37.20 | 1 | (52) |
| DES75 | [TBA][Br]:MalA | 298 | 38.20 | 1 | (52) |
| DES76 | [TBA][Br]:MEA | 298–358 | 33.20–36.10 | 28 | (43) |
| DES77 | [TBA][Br]:OA | 298 | 42.70 | 1 | (52) |
| DES78 | [TBA][Br]:PA | 298 | 32.40 | 1 | (52) |
| DES79 | [TBA][Cl]:Arg | 313–353 | 35.80–40.40 | 15 | (53) |
| DES80 | [TBA][Cl]:AspA | 313–353 | 33.90–43.40 | 15 | (53) |
| DES81 | [TBA][Cl]:GluA | 313–353 | 31.20–39.10 | 15 | (53) |
| DES82 | [TBA][Cl]:Met | 313 | 41.80 | 1 | (53) |
| DES83 | [TBA][HSO4]:BA | 333–353 | 38.98–42.60 | 5 | (28) |
| DES84 | [TBA][ HSO4]:DGA | 303–343 | 42.82–43.89 | 5 | (32) |
| DES85 | [TBA][ HSO4]:Nin | 308–333 | 38.18–43.23 | 6 | (44) |
| DES86 | [TEA][Br]:BA | 333–353 | 42.11–52.59 | 10 | (28) |
| DES87 | [TPA][Br]:EG | 303–353 | 41.91–46.99 | 18 | (54) |
| DES88 | [TPA][Br]:Gly | 303–353 | 45.77–53.15 | 18 | (54) |
| DES89 | [TPA][Br]:TEG | 303–353 | 42.07–46.55 | 18 | (54) |
| DES90 | Bet:CA | 293–333 | 42.90–46.30 | 5 | (8) |
| DES91 | Glu:Pae:H2O | 288–338 | 62.30–71.30 | 21 | (36) |
| DES92 | Mat:Pae | 303–343 | 37.88–43.36 | 27 | (55) |
| DES93 | Men:CaA | 298 | 27.50–29.04 | 4 | (56) |
| DES94 | Men:CapA | 298 | 29.41 | 1 | (56) |
| DES95 | Men:OcA | 298 | 28.04 | 1 | (57) |
| DES96 | Men:OcA | 298–333 | 18.98–26.67 | 40 | (58) |
| DES97 | PDA:1,4-ButOH | 293–318 | 38.98–46.79 | 114 | (59) |
| DES98 | PEG200:LacA:Act | 298 | 23.73–43.41 | 9 | (48) |
| DES99 | PEG200:LacA:EtAc | 298 | 19.93–39.88 | 9 | (48) |
| DES100 | PEG200:LacA:Eth | 298 | 20.98–42.11 | 9 | (48) |
| DES101 | PEG200:LacA:H2O | 298 | 44.46–48.40 | 9 | (48) |
| DES102 | PEG200:LacA:IsoOH | 298 | 18.23–39.61 | 9 | (48) |
| DES103 | PEG200:NMA | 298–338 | 42.30–45.17 | 5 | (48) |
| DES104 | PEG200:NMA:Act | 298 | 20.53–40.95 | 18 | (48) |
| DES105 | PEG200:NMA:EtAc | 298 | 19.66–39.34 | 18 | (48) |
| DES106 | PEG200:NMA:Eth | 298 | 19.66–40.09 | 18 | (48) |
| DES107 | PEG200:NMA:H2O | 298 | 39.85–47.40 | 18 | (48) |
| DES108 | PEG200:NMA:IsoOH | 298 | 17.62–38.60 | 18 | (48) |
| DES109 | PEG200:NMA | 298–338 | 38.02–44.17 | 10 | (48) |
| DES110 | PEG200:ThU:Act | 298 | 22.22–44.16 | 9 | (48) |
| DES111 | PEG200:ThU:EtAc | 298 | 20.33–40.52 | 9 | (48) |
| DES112 | PEG200:ThU:Eth | 298 | 21.21–41.65 | 9 | (48) |
| DES113 | PEG200:ThU:H2O | 298 | 45.06–49.98 | 9 | (48) |
| DES114 | PEG200:ThU:IsoOH | 298 | 18.81–39.64 | 9 | (48) |
| DES115 | PEG200:ThU | 298–338 | 41.79–45.08 | 5 | (48) |
| DES116 | PEG400:ThU:Act | 298 | 23.02–44.04 | 9 | (48) |
| DES117 | PEG400:ThU:EtAc | 298 | 21.46–42.84 | 9 | (48) |
| DES118 | PEG400:ThU:Eth | 298 | 19.43–43.68 | 9 | (48) |
| DES119 | PEG400:ThU:H2O | 298 | 36.15–42.12 | 9 | (48) |
| DES120 | PEG400:ThU:IsoOH | 298 | 18.13–42.12 | 9 | (48) |
| DES121 | PEG400:bor | 298–338 | 40.70–42.22 | 5 | (48) |
| DES122 | Thy:CaA | 298 | 31.75 | 1 | (56) |
| DES123 | Thy:Cam | 298 | 28.43 | 1 | (57) |
| DES124 | Thy:CapA | 298 | 30.35 | 1 | (56) |
| DES125 | Thy:FuA | 298 | 29.09 | 1 | (57) |
| DES126 | TMG:GlyA | 298 | 32.30 | 1 | (60) |
| DES127 | TMG:ManA | 298 | 55.92 | 1 | (60) |
| DES128 | TMG:PAA | 298 | 64.50 | 1 | (60) |
| DES129 | TMG:Ace | 298 | 40.74 | 1 | (60) |
| DES130 | ZnCl2:EG | 293–307 | 49.04–53.00 | 6 | (61) |
| DES131 | ZnCl2:HexOH | 293–305 | 53.59–57.90 | 5 | (61) |
| DES132 | ZnCl2:U | 297–303 | 45.71–49.44 | 6 | (61) |
| DES133 | ZnCl2:U | 296–303 | 68.80–73.12 | 4 | (61) |
All data points were reported at approximately 100 kPa.
All DESs constituents involved are summarized as follows: (a) anions (bromide [Br], chloride [Cl], hydrogen sulfate [HSO4], and bis(trifluoromethylsulfonyl)imide [N(SO2CF3)2]); (b) cations (acetylcholine [AcCh], allyltriphenylphosphonium [ATPP], benzyltriphenylphosphonium [BTP], butylammonium [BA], choline [Ch], N,N-diethylenethanolammonium [DEEA], ethylammonium [EA], n-methyl-n-propylpyrrolidinium [MPPyr], methyltriphenylphosphium [MTP], N,N-diethylethanolammonium [N-DEEA], propylammonium [PA], tetrabutylammonium [TBA], tetraethylammonium [TEA], and tetrapropylammonium [TPA]; (c) HBDs (1,2-butanediol [1,2-ButOH], 1,3-butanediol [1,3 ButOH], 1,4-butanediol [1,4-ButOH], 2,3-butanediol [2,3-ButOH], acetic acid [AA], acetamide [Ace], acetone [Act], arginine [Arg], aspartic acid [AspA], benzilic acid [BenA], betaine [Bet], borneol [bor], citric acid [CA], capric acid [CaA], camphor [Cam], caprylic acid [CapA], diethylene glycol [DEG], diglycolic acid [DGA], ethylene glycol [EG], ethyl acetate [EtAc], ethanol [Eth], formic acid [FA], iron(III) chloride [FeCl3], fructose [Fru], 2-furoic acid [FuA], glucose [Glu], glutamic acid [GluA], glycerol [Gly], glycolic acid [GlyA], water [H2O], 1,6-hexanediol [HexOH], isopropanol [IsoOH], lactic acid [LacA], levulinic acid [LevA], maltose [Mal], malonic acid [MalA], d-(+)-mandelic acid [ManA], matrine [Mat], n-methyl diethanolamine [MDEA], monoethanolamide [MEA], dl-menthol [Men], methionine [Met], ninhydrin [Nin], N-methyl acetamide [NMA], oxalic acid [OA], octanoic acid [OcA], propionic acid [PA], phenylacetic acid [PAA], paeonol [Pae], 1,3-propanediamine [PDA], polyethylene glycol 200 [PEG200], polyethylene glycol 400 [PEG400], 1,5-pentanediol [PenOH], phenol [Ph], triethylene glycol [TEG], 2,2,2-trifluoroacetamide [TFA], thiourea [ThU], thymol [Thy], trimethyl glycine [TMG], urea [U], xylitol [Xyl], and finally zinc chloride [ZnCl2].
2.2. Development of the σ-Profiles
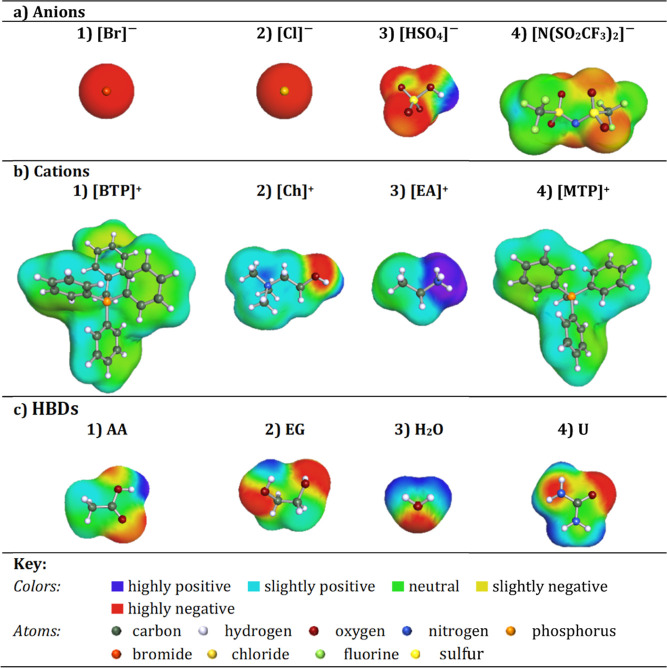
The COSMO-RS theory predicts thermodynamic properties by creating a virtual conductor around each molecule, where the surface area and density charge of each formed surface segment are then calculated, and based on that the σ-profile is determined.62 To perform the COSMO-RS calculations, building the 3D molecular structures is the first step in optimizing the ground state geometry of the molecule. In this work, the calculation of molecular energy and geometric optimization was carried out for each molecule using the def-TZVP basis “triple-ζ valence polarized” and the generalized gradient approximation BP86 “Becke-Perdew 86”.20 Geometrical optimizations were carried out using Turbomole software (TmoleX version 4.5.1). The density convergence threshold for the self-consistent field was set at 10–6 hartree.20 The files obtained for each molecule were then exported as “COSMO” files and imported into COSMOThermX 2022. Examples of the 3D structures of the modeled anions, cations, and HBD molecules using COSMOThermX are presented in Figure 2. The molecular polarity is graphically represented by the colors blue and red, where blue is the positive “hydrogen-donating” polarity surface, while red represents the negative “hydrogen-accepting” surface. The green areas characterize neutral or “nonpolar” molecular surfaces.
Figure 2.
Examples of the developed COSMO structures in this work of four representative (a) anions, (b) cations, and (c) HBDs.
2.3. Calculation of the Sσ-profile Descriptors
Using the generated molecular surfaces shown in Figure 2, the polarity distributions (σ-profiles) of the anion, cation, and HBDs were calculated. The σ-profile of a molecule is a probability distribution that quantifies the relative probability of a molecular surface segment having a certain screening charge density.63 The curves in σ-profile also indicate the concentration of a particular atom in the molecule.64 As a result, the integrated area under the σ-profile curve may be used to obtain a description of the surface of a molecule, which is designated as Sσ-profiles. The Sσ-profiles molecular parameter is an a priori quantum chemistry parameter that characterizes the concentration and type of atoms within a certain σ-range. For more information on the Sσ-profiles molecular descriptor, the reader is directed to the work of Torrecilla et al.64
It should be noted that the accuracy of the developed models can be substantially increased if the σ-profiles were partitioned into 51 regions of 0.001 e/Å2 widths as it would allow for a more detailed description of the molecule,65 however, that would also lead to the development of a very complex model as a result of having 51 inputs. Therefore, a comprise should be made between the complexity and the accuracy of the developed model. Several research groups in the literature utilized Sσ-profiles in 6 regions,66 8 regions,67 and 10 regions.68 In our previous work, we have tested several Sσ-profiles discretizations in 4, 6, 8, 10, and 12 regions for the prediction of the pH of DESs using MLR and ANN approaches, and our results showed that an 8-level discretization of the Sσ-profile was the best compromise between accuracy and the number of fitting parameters inputs. Additionally, the 8-level discretization was found to be sufficient to effectively represent the polarization influence of all functional groups constituting the solvent’s structure.20 This discretization also provides a clear representation of the 3 main categorical regions; (1) the HBA region, (2) the nonpolar region, and (3) the HBD region, with each region being further divided into [S1, S2, and S3], [S4 and S5], and [S6, S7, and S8], respectively. For example, the HBD region can be considered as the addition of three regions, where the chemical information of strong HBD groups is compiled within [S1], standard HBD groups are compiled within [S2], and weak HBD groups are compiled within [S3].
Therefore, in this work, an 8-level discretization of the Sσ-profiles was also utilized. First, the COSMO files (Figure 2) were loaded into the BIOVIA COSMOtherm software (version 2022) to calculate the σ-profiles of all the 81 constituents (anions, cations, and HBD molecules), and then they were imported into Excel. Then, the Sσ-profile of each constituent was then calculated by entering the σ-profile data into MATLAB and computing the integral under the curves in each of the 8 distinct regions using the trapz() function. Thereafter, the Sσ-profiles of the modeled DESs are then defined as the molar weighted average of the constituents, which is the conventional method utilized in the literature.20 The equation is expressed as follows
| 1 |
where xHBA and xHBD are the mole fractions of the HBA (anion + cation) and the HBD, respectively, while Si is the descriptor in the region i from 1 to 8 (e/Å2). Table S3 lists the calculated Sσ-profile descriptors for the 81 DES constituents investigated in this work.
2.4. Artificial Neural Network
The ANN model, inspired by the biological neuron anatomy, is composed of a network of mathematical functions called “neuron nodes” that relate the various components and layers of the network together. Neurons are directly connected through links that go through an activation function. The activated and deactivated neuron nodes are collected to create the necessary output response.19 The primary feature of this pattern is to analyze the data and find patterns and interactions within the data sets.19 ANNs have been widely used to address various engineering challenges and are well known for their high accuracy and robustness in solving complex problems. ANNs may effectively replace statistical analysis techniques such as autocorrelation, multivariable regression, trigonometric, and linear regression.69 In this work, the hidden neurons within the neural network (Hn,p and HHn,p) are defined as follows17
| 2 |
| 3 |
where tanh is the activation function that binds the neuron values to a range between −1 and 1 (−1 denotes a deactivated neuron while 1 denotes an activated neuron), W represents the weight coefficient of the connection between the input of the layer and the hidden neuron, b represents the intercept bias of the hidden neuron, the subscript m represents the number of the weight coefficient, the subscript n represents the number of the neuron, the subscript p represents the hidden layers (1 or 2), and Hn,1 and HHn,2 denote the neurons in hidden layer 1 and hidden layer 2, respectively. The final surface tension output (γ) of the ANN is expressed as follows
| 4 |
In this study, the 8 Sσ-profiles descriptors and the temperature
in K were selected as the network’s inputs, while the surface
tension of the DESs was chosen as the output. The neural network toolbox
of the John’s Macintosh Project statistical software (JMP SAS
15) was used to design the fully connected multilayer perceptron ANN
models, where 25% of the training data set was used for internal cross-validation
(271 data points). The training algorithm used was the Broyden–Fletcher–Goldfarb–Shanno
(BFGS) algorithm. The network’s learning rate was fixed at
0.1, the number of tours was set to 100,000, and a squared penalty
method  was used for optimization. Input normalization
was not used, and the ANN layers were fully connected without using
node drop-out. All other options in the JMP SAS 15 software were kept
as default.
2.5. Applicability Domain
The applicability domain (AD) is a critical concept in ML, as it enables evaluating the uncertainty in a molecule’s prediction based on its similarity to the compounds used in training.70 AD has been widely used in ML models to detect structural outliers and define the range of molecules for which the prediction may be considered accurate. Different techniques have been used to determine the AD, although the most prevalent is the leverage approach in which the model is tested based on the leverage value (hi) for each chemical.70
For example, lower hi values (hi < h*) imply more similarity to the training set. In contrast, hi values higher than the critical leverage value (hi > h*) represent molecules that are “different” from the molecules in the training set, and their prediction may be perceived as less reliable owing to the high degree of extrapolation. The leverage value is defined as follows70
| 5 |
where vi is a matrix with dimensions of 1 × d* containing the input parameters, d* denotes the number of inputs in the ANN model, which is 9 in this work, V is a p × d* matrix where p denotes the number of experimental data points in training, and the superscript “T” indicates the transpose of the matrices.70 The crucial leverage value (h*) is determined using the formula below70
| 6 |
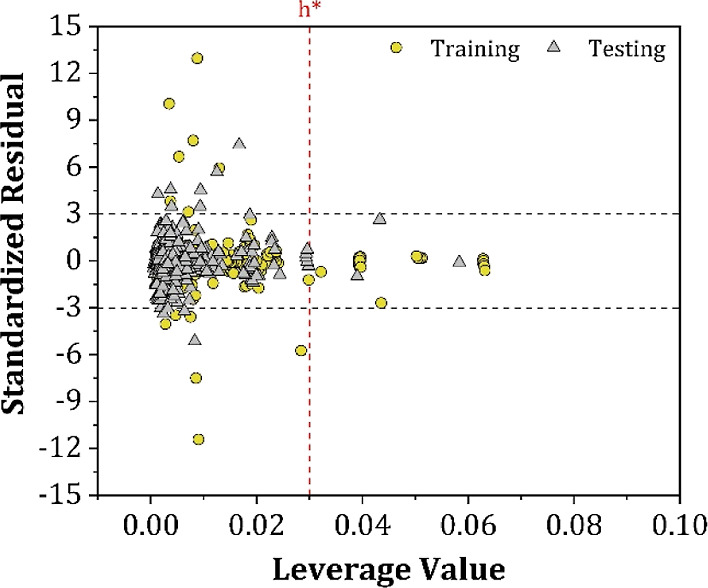
The William plot illustrates a model’s domain of applicability by plotting the standardized residuals (SDR) versus the leverage values (hi) of each data point. The SDR boundaries in the William plot are between −3 < SDR < +3 and 0 < hi < h*. The SDRs are determined using the following formula20
 |
7 |
where γpred and γexp represent the predicted and the experimental surface tensions, respectively.
3. Results and Discussion
3.1. σ-Profiles
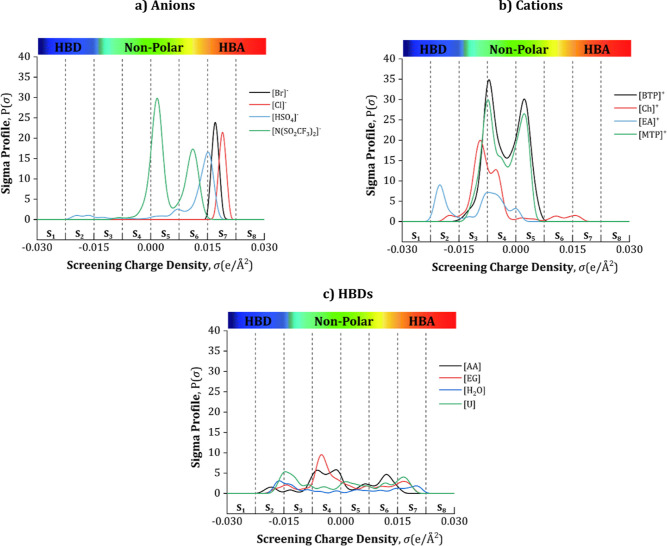
The σ-profile of a molecule is a probability distribution that quantifies the relative probability of a molecular surface segment having a certain screening charge density. The σ-profile can be divided into three areas: (1) the HBA area σ > 0.001 e/Å2; (2) the nonpolar area −0.001 < σ < 0.001 e/Å2; and (3) the HBD area σ < −0.001 e/Å2.20 To determine the input parameters for the ANN model (Sσ-profiles), the σ-profiles of the DES constituents were divided into eight areas and then by calculating the integral area under the curves. The Sσ-profiles can then be classified into five classes depending on their charges: (1) the strong donor region [S1 and S2], the weak donor region [S3], the nonpolar region [S4 and S5], the weak acceptor region [S6], and the strong acceptor region [S7 and S8]. From the 81 modeled DES constituents in this work, the σ-profiles of four anions, four cations, and four HBDs are shown in Figure 3 as representative examples, while the rest of the Sσ-profile are listed in Table S3. The charge distribution is coded in colors: red denotes the HBA area, blue denotes the HBD area, and green denotes the nonpolar region.
Figure 3.
Examples of the developed σ-profile in this work of four representative (a) anions, (b) cations, and (c) HBDs.
As shown in Figure 3a, most anion peaks are located on the right-hand side of the curves, indicating the nonpolar [S4 and S5], and HBA areas [S6, S7, and S8]. Additionally, it can be seen that the negative charges of the chlorine and bromine ions provide [Cl]–and [Br]− a much stronger screening charge density peak than other anions in the S7 region. In Figure 3b, the peaks of the cations are noticeable on the left-hand side, covering a large area in the nonpolar [S4 and S5] and HBD [S1, S2, and S3] regions. It can be seen that [Ch]+ and [EA]+ show the highest peaks in the [S2] region, indicating their high positive polarities, while [BTP]+ and [MTP]+ show peaks in the weak donor region [S3], this is due to the charge stabilization of the neighboring CH and CH2 groups nearby their cationic cores, which explains the large peaks in the nonpolar [S4] region. Moving on to Figure 3c, the σ-profiles of AA, EG, H2O, and U are illustrated as wide profiles. The observed peaks are between −0.0015 < σ < 0.0015 e/Å2, which means that they can exhibit weak HBA and HBD abilities. For example, the left peaks of EG are due to the partial negative charge on the oxygen lone pair of electrons, and the right peaks are due to the positively charged hydrogen. The peak located around 0 e/Å2 is due to the nonpolar CH2 surfaces of EG.
3.2. Artificial Neural Network
3.2.1. First Hidden Layer
Conducting experimental validation of the model’s predicted values is always necessary. Therefore, to test the performance of the ANN model in predicting the surface tension of DESs, the data of the 133 DES mixtures were separated into two subsets: a training set including 80% of the DESs and a testing set including the remaining 20%. The testing subset was selected using the “ordered response” method,71 where the surface tension values of all DES at 298 K were sorted from lowest to highest, and then, one of five DESs was selected for the external testing subset. The advantage of using this method is that it ensures a meaningful and diverse selection of training and testing subsets.71 The data division is shown in Table 3.
Table 3. Statistical Parameters for the Developed ANN Model.
| training | |
|---|---|
| number of DESs | 93 |
| data points of DES | 1084 |
| DESs considered | DESs 4, 6–13, 15, 17, 19, 21, 23–28, 30–38, 48–52, 54, 56, 58–59, 62–71, 73–79, 81–82, 84–87, 89–97, 99–101, 105–106, 108, 112–117, and 121–133 |
| testing | |
|---|---|
| number of DESs | 40 |
| data points of DES | 487 |
| DESs considered | DESs 1–3, 5, 14, 16, 18, 20, 22, 29, 39–47, 53–57, 60–61, 72, 80, 83, 88, 98, 102–104, 107, 109–111, 115, and 118–120 |
The performance of an ANN model is highly dependent on the number of neurons in the hidden layer, which substantially influences the accuracy and complexity of the developed model.19 A small number of neurons may cause the model to be underfitted and thus to have low performance on training and testing data. On the other hand, having a high number of neurons will cause the model to be overfitted, thus having high performance on training data but low performance on external testing data. However, note that there is no direct technique for selecting the most appropriate architecture (number of neurons and number of hidden layers), and thus, the most common method applied in the literature is often through trial and error. In this section, several network architectures with a single hidden layer are tested with 5, 10, 15, 20, 25, 30, 35, 40, 45, and 50 neurons, and the results are shown in Figure 4. It can be seen from the figure that the ANN model with 25 neurons achieved the lowest root-mean-square error (RMSE) in predicting the surface tension of the testing set with an RMSE value of 3.69 mN/m.
Figure 4.
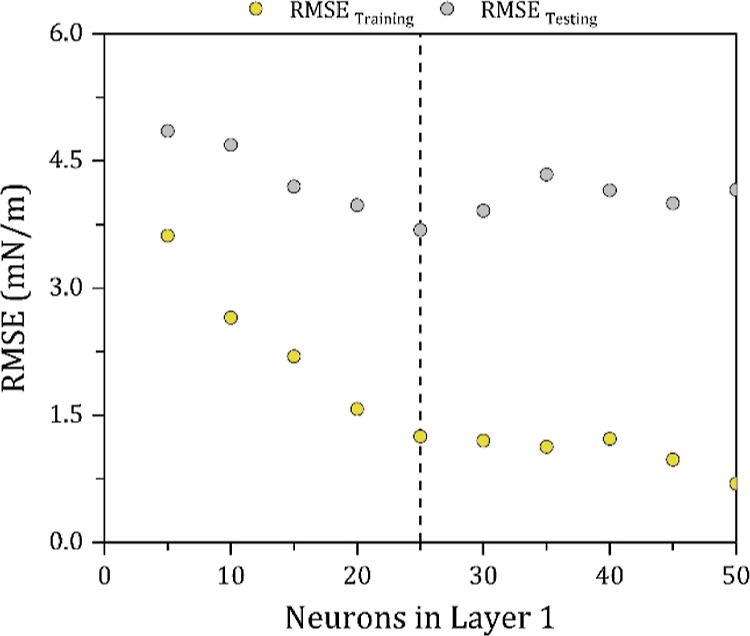
Effect of the number of hidden neurons on the model’s RMSE.
3.2.2. Second Hidden Layer
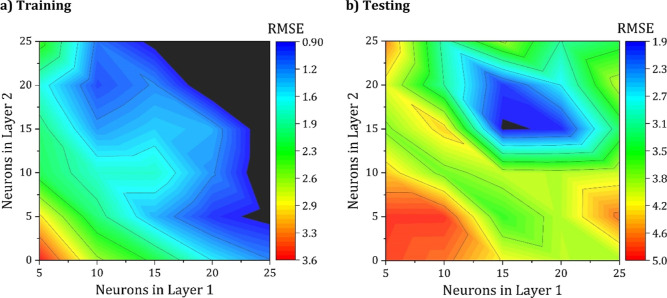
To study the effect of adding a second hidden layer, the number of neurons in the first hidden layer and the second hidden layer was varied between 10 and 50, with 5–5 as a minimum and 25–25 as the maximum. Figure 5 shows the values of the training and testing sets for the RMSE.
Figure 5.
Contour plot of the effect of the number of neurons in layers 1 and 2 on the RMSE for (a) training and (b) testing.
It can be seen from Figure 5 that the ANN architecture with 15–15 neurons achieved the lowest RMSE in predicting the surface tension of the testing set with an RMSE value of approximately 1.87 mN/m, which is substantially lower than that of the optimal 1-hidden layer model with 25 neurons model that achieved an RMSE of 3.69. Therefore, it was concluded that the optimal architecture in predicting the given data set is 9–15–15–1, which is schematically presented in Figure 6. The slope weight coefficients and biases of each neuron for the developed model are available in Table S4.
Figure 6.
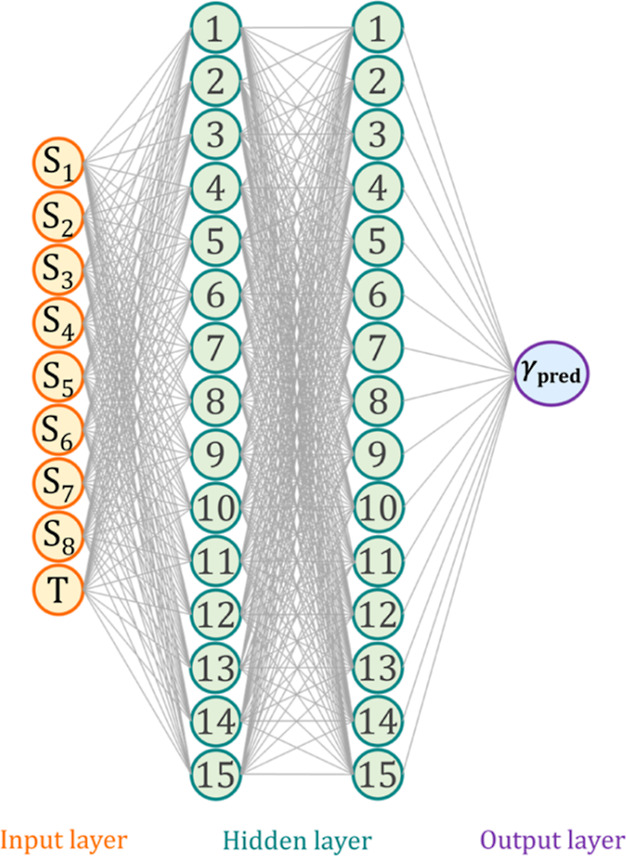
Schematic diagram of the best performing ANN model with a 9–15–15–1 configuration.
3.2.3. Input Importance
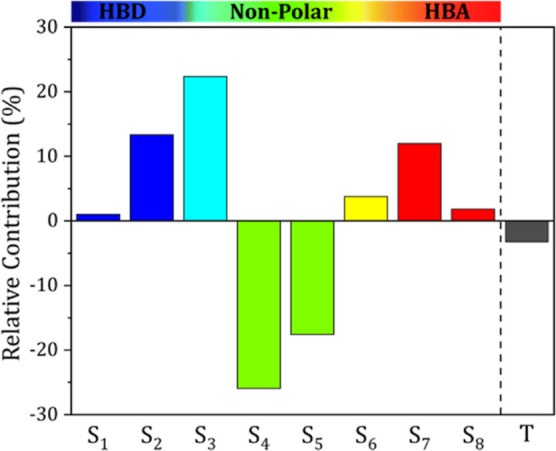
To verify the importance of the 8 Sσ-profiles descriptors, the temperature, and their effect on the surface tension, a relative contribution analysis was performed using the “predictor screening” function in the JMP SAS software. The influence of each input on the surface tension is indicated by the sign, where a positive sign indicates that increasing this input variable increases the surface tension, while a negative sign indicates that increasing this input variable causes the surface tension to decrease. Figure 7 presents the relative contribution of the 8 Sσ-profiles descriptors and the temperature to the surface tension of the DESs.
Figure 7.
Relative contributions of the input parameters for the developed ANN model.
It can be seen from the figure that the most important descriptors are S2, S3, S4, S5, and S7 as they have the largest contributions, while S1, S6, and S8 have much lower contributions. It can also be seen that the non-neutral surfaces pertaining to the HBD [S1, S2, and S3] and the HBA [S6, S7, and S8] regions tend to increase the surface tension of the DES, while the neutral surfaces [S4 and S5] have a negative effect on the surface tension. As for the effect of temperature, it can be seen that an increase in temperature tends to decrease the surface tension of the DESs. This result is in accordance with other studies reported in the literature.28,48,49,55,58,59 This could be attributed to the accompanying increase in kinetic energy between the molecules, which in turn weakens the DES intermolecular interactions.
3.3. Model Evaluation
3.3.1. Training and Testing of the ANN Model
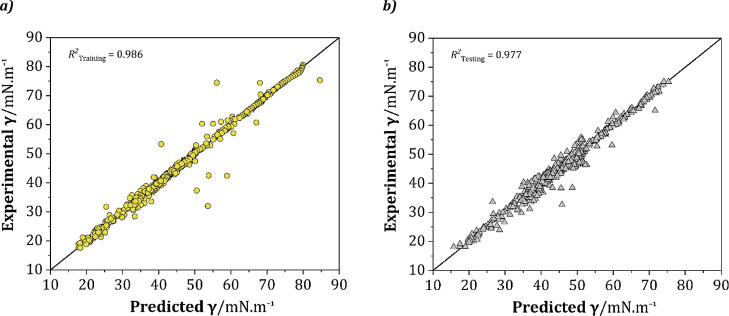
Figure 8 illustrates a comparison of the experimental and predicted surface tension values in both training and testing. Additionally, the model’s statistical parameters, including RMSE, regression coefficient (R2), average standard deviation (SDavg), and AARD are listed in Table 4.
Figure 8.
Parity graph of experimental and predicted surface tension values of the ANN model in (a) training and (b) testing.
Table 4. Statistical Parameters for the Developed ANN Model.
| training | |
|---|---|
| Rtraining2 | 0.986 |
| Rscramble2 | 0.058 |
| RMSE (γ/mN m–1) | 1.464 |
| SDavg (γ/mN m–1) | ±0.385 |
| AARD | 1.43% |
| ADcoverage | 96.9% |
| testing | |
|---|---|
| Rtesting2 | 0.977 |
| Rscramble2 | 0.073 |
| RMSE (γ/mN m–1) | 1.873 |
| SDavg (γ/mN m–1) | ±0.869 |
| AARD | 3.04% |
| ADcoverage | 96.6% |
As shown in Figure 8a, the training set predictions are largely similar to those for the experimental set, with an R2 value of 0.986. In the case of the testing subset shown in Figure 8b, it can be seen that the predictions still have a narrow range scattering around the diagonal line with an R2 of 0.977, indicating that the predictions for the external DESs have an acceptable error. The R2 and AARD for the total data set (including training and testing) are 0.983 and 2.20%, respectively, which can be considered reliable and satisfactory. The other statistical parameters for both the training and the testing subsets are listed in Table 4. To further check that the ANN is not correlated by chance, the y-scrambling method70 has been used, where the experimental data were modified by randomly reordering the surface tension values, and then a new 9–15–15–1 model was developed for the randomly sorted response. As can be seen in Table 4, low values of the y-scrambling regression coefficient (Rscramble2) indicate that the ANN is not correlated by chance.
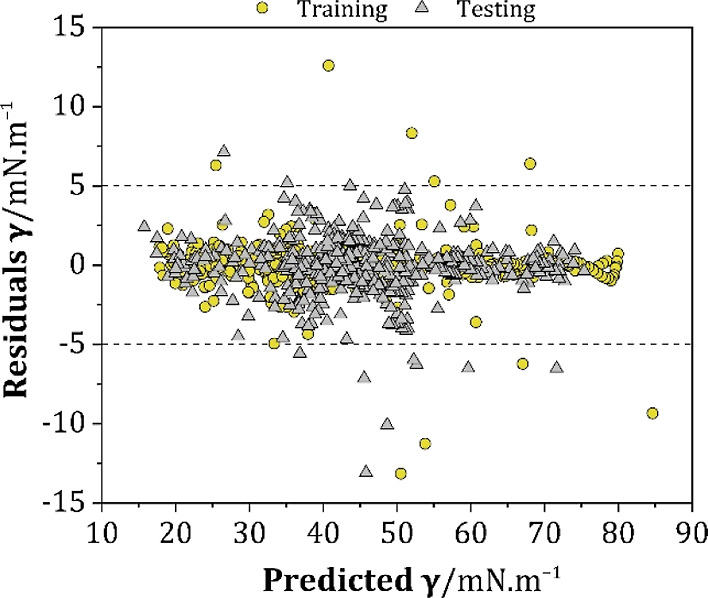
The residual plot was used to analyze the model accuracy for further model evaluation. Figure 9 shows the remarkable performance of the proposed model in predicting the surface tension of DESs, where the majority of the residuals were in a range of ±5 mN m–1, with an overall SDavg of ±0.627. Based on these findings, it can be concluded that the developed ANN model can adequately predict the surface tension of DESs with an acceptable error.
Figure 9.
The residual deviation between the experimental and predicted surface tension values.
3.3.2. Applicability Domain
An essential feature of any model is to predict the modeled property of external DESs reliably, and thus an accurate evaluation of a model’s true predictive capability is crucial. To verify the applicability of external DESs, the AD of an ANN model can be tested using both the leverage (hi) and SDRs method. The Williams plot for each data point is shown in Figure 10, where the AD limits are as follows: 0 < hi < h* = 0.03 for the x-axis and −3 < SDR < +3 for the y-axis.70
Figure 10.
William plot for the surface tension of the total set of DESs.
As can be observed, almost all DESs in the external testing set of the ANN model were within the AD limits, as the ADcoverage in the testing was determined to be 96.6% of all data points. However, the predictions of a few DESs in training and testing at various exception temperatures were considered response and structural outliers because they had a leverage value higher than h*, or SDRs greater than three limits. However, these outliers only account for less than 4% of the total data points. Overall, the results of the AD evaluation suggest that the developed ANN demonstrates ample robustness and generalizability due to its large AD and structural coverage, which is a consequence of the 520 DES compositions included in the development of the ANN.
4. Conclusions
The demand for computational methods capable of predicting the physicochemical properties of solvents for screening purposes is rapidly increasing, particularly given the theatrically infinite nature of designer solvents, such as DESs. This work presents an ANN model for predicting the surface tension of DESs. To ensure that the developed ANN is reliable and robust, a database was used that, to the best of our knowledge, contains all surface tension measurements of DESs reported in the literature. The data set includes 1571 points from 133 different DES mixtures with 520 different compositions and temperatures prepared from 4 anions, 14 cations, and 63 HBDs. The ANN uses molecular-based parameters as inputs, easily obtained from COSMO-RS (Sσ-profiles), and does not require the input of experimental data into the model. Based on the external testing results, the optimal ANN architecture was determined to be two hidden layers with 15 neurons in each layer (9–15–15–1 configuration). The ANN model demonstrated high performance in both training and testing, with an AARD of 1.43% in training and 3.04% in testing. The ANN model also demonstrated a wide domain of applicability covering a large range of DES molecular structures. In summary, the statistical performance of the model indicates that the surface tension predictions can be considered reliable and can be used to estimate the surface tension of DESs in the absence of experimental data.
Acknowledgments
This work was supported by the Korea Environment Industry & Technology Institute (KEITI) through Subsurface Environment Management (SEM) Projects, funded by the Korea Ministry of Environment (MOE) (no. 2020002480007), Ferhat Abbas University under Laboratoire de Biopharmacie Et Pharmacotechnie (LPBT) and Laboratoire de Physico-Chimie des Hauts Polymères (LPCHP), and by Khalifa University of Science and Technology (under grant number CIRA-2019-028). The authors are grateful for the support of the researchers supporting project number (RSP-2021/113), King Saud University, Riyadh, Saudi Arabia.
Supporting Information Available
The Supporting Information is available free of charge at https://pubs.acs.org/doi/10.1021/acsomega.2c03458.
1571 experimental surface tension data of the DESs; surface tension of the 520 DES compositions at 298 K and 100 kPa; calculated molecular descriptors for the 81 modeled anions, cations, and HBDs; and ANN weights and biases for the links between the neurons in the first hidden layer, the second hidden layer, and the output layer (PDF)
Author Contributions
○ Shared first authorship between T.L. and A.B.
The authors declare no competing financial interest.
Supplementary Material
References
- Chandran K.; Kait C. F.; Wilfred C. D.; Zaid H. F. M. A Review on Deep Eutectic Solvents: Physiochemical Properties and Its Application as an Absorbent for Sulfur Dioxide. J. Mol. Liq. 2021, 338, 117021. 10.1016/j.molliq.2021.117021. [DOI] [Google Scholar]
- Anastas P.; Eghbali N. Green Chemistry: Principles and Practice. Chem. Soc. Rev. 2010, 39, 301–312. 10.1039/b918763b. [DOI] [PubMed] [Google Scholar]
- Smith E. L.; Abbott A. P.; Ryder K. S. Deep Eutectic Solvents (DESs) and Their Applications. Chem. Rev. 2014, 114, 11060–11082. American Chemical Society November 10.1021/cr300162p. [DOI] [PubMed] [Google Scholar]
- Tang B.; Zhang H.; Row K. H. Application of Deep Eutectic Solvents in the Extraction and Separation of Target Compounds from Various Samples. J. Sep. Sci. 2015, 38, 1053–1064. 10.1002/jssc.201401347. [DOI] [PubMed] [Google Scholar]
- Francisco M.; van den Bruinhorst A.; Kroon M. C. Low-Transition-Temperature Mixtures (LTTMs): A New Generation of Designer Solvents. Angew. Chem., Int. Ed. 2013, 52, 3074–3085. 10.1002/anie.201207548. [DOI] [PubMed] [Google Scholar]
- Abbott A. P.; Capper G.; Davies D. L.; Rasheed R. K.; Tambyrajah V. Novel Solvent Properties of Choline Chloride/Urea Mixtures. Chem. Commun. 2003, 1, 70–71. 10.1039/b210714g. [DOI] [PubMed] [Google Scholar]
- Andrade J. D.; Smith L. M.; Gregonis D. E.. The Contact Angle and Interface Energetics. Surface and Interfacial Aspects of Biomedical Polymers; Springer, 1985. [Google Scholar]
- Chen Y.; Chen W.; Fu L.; Yang Y.; Wang Y.; Hu X.; Wang F.; Mu T. Surface Tension of 50 Deep Eutectic Solvents: Effect of Hydrogen-Bonding Donors, Hydrogen-Bonding Acceptors, Other Solvents, and Temperature. Ind. Eng. Chem. Res. 2019, 58, 12741–12750. 10.1021/acs.iecr.9b00867. [DOI] [Google Scholar]
- García G.; Aparicio S.; Ullah R.; Atilhan M. Deep Eutectic Solvents: Physicochemical Properties and Gas Separation Applications. Energy and Fuels 2015, 29, 2616–2644. [Google Scholar]
- Haghbakhsh R.; Taherzadeh M.; Duarte A. R. C.; Raeissi S. A General Model for the Surface Tensions of Deep Eutectic Solvents. J. Mol. Liq. 2020, 307, 112972. 10.1016/j.molliq.2020.112972. [DOI] [Google Scholar]
- Cea-Klapp E.; Gajardo-Parra N.; Aravena P.; Quinteros-Lama H.; Held C.; Canales R. I.; Garrido J. M. Interfacial Properties of Deep Eutectic Solvents by Density Gradient Theory. Ind. Eng. Chem. Res. 2022, 61, 2580–2591. 10.1021/acs.iecr.1c03817. [DOI] [Google Scholar]
- Khajeh A. Applying Molecular Approaches to the Estimation of Surface Tension of Deep Eutectic Solvents. J. Solution Chem. 2022, 51, 448–464. 10.1007/s10953-022-01156-0. [DOI] [Google Scholar]
- Haghbakhsh R.; Raeissi S.; Duarte A. R. C. Group Contribution and Atomic Contribution Models for the Prediction of Various Physical Properties of Deep Eutectic Solvents. Sci. Rep. 2021, 11, 6684–19. 10.1038/s41598-021-85824-z. [DOI] [PMC free article] [PubMed] [Google Scholar]
- Khandelwal M.; Singh T. N. Prediction of Blast-Induced Ground Vibration Using Artificial Neural Network. Int. J. Rock Mech. Min. Sci. 2009, 46, 1214–1222. 10.1016/j.ijrmms.2009.03.004. [DOI] [Google Scholar]
- Shahbaz K.; Mjalli F. S.; Hashim M. A.; AlNashef I. M. Prediction of the Surface Tension of Deep Eutectic Solvents. Fluid Phase Equilib. 2012, 319, 48–54. 10.1016/j.fluid.2012.01.025. [DOI] [Google Scholar]
- Bagh F. S. G.; Shahbaz K.; Mjalli F. S.; AlNashef I. M.; Hashim M. A. Electrical Conductivity of Ammonium and Phosphonium Based Deep Eutectic Solvents: Measurements and Artificial Intelligence-Based Prediction. Fluid Phase Equilib. 2013, 356, 30–37. 10.1016/j.fluid.2013.07.012. [DOI] [Google Scholar]
- Adeyemi I.; Abu-Zahra M. R. M.; AlNashef I. M. Physicochemical Properties of Alkanolamine-Choline Chloride Deep Eutectic Solvents: Measurements, Group Contribution and Artificial Intelligence Prediction Techniques. J. Mol. Liq. 2018, 256, 581–590. 10.1016/j.molliq.2018.02.085. [DOI] [Google Scholar]
- Atashrouz S.; Amini E.; Pazuki G. Modeling of Surface Tension for Ionic Liquids Using Group Method of Data Handling. Ionics (Kiel). 2015, 21, 1595–1603. 10.1007/s11581-014-1347-1. [DOI] [Google Scholar]
- Shahbaz K.; Baroutian S.; Mjalli F. S.; Hashim M. A.; AlNashef I. M. Densities of Ammonium and Phosphonium Based Deep Eutectic Solvents: Prediction Using Artificial Intelligence and Group Contribution Techniques. Thermochim. Acta 2012, 527, 59–66. 10.1016/j.tca.2011.10.010. [DOI] [Google Scholar]
- Lemaoui T.; Abu Hatab F.; Darwish A. S.; Attoui A.; Hammoudi N. E. H.; Almustafa G.; Benaicha M.; Benguerba Y.; Alnashef I. M. Molecular-Based Guide to Predict the PH of Eutectic Solvents: Promoting an Efficient Design Approach for New Green Solvents. ACS Sustainable Chem. Eng. 2021, 9, 5783–5808. 10.1021/acssuschemeng.0c07367. [DOI] [Google Scholar]
- Abbott A. P.; Capper G.; Gray S. Design of Improved Deep Eutectic Solvents Using Hole Theory. ChemPhysChem 2006, 7, 803–806. 10.1002/cphc.200500489. [DOI] [PubMed] [Google Scholar]
- Ghaedi H.; Ayoub M.; Sufian S.; Shariff A. M.; Lal B. The Study on Temperature Dependence of Viscosity and Surface Tension of Several Phosphonium-Based Deep Eutectic Solvents. J. Mol. Liq. 2017, 241, 500. 10.1016/j.molliq.2017.06.024. [DOI] [Google Scholar]
- Ghaedi H.; Zhao M.; Clough P. T.; Anthony E. J.; Fennell P. S. High CO2 Absorption in New Amine Based-Transition-Temperature Mixtures (Deep Eutectic Analogues) and Reporting Thermal Stability, Viscosity and Surface Tension: Response Surface Methodology (RSM). J. Mol. Liq. 2020, 316, 113863. 10.1016/j.molliq.2020.113863. [DOI] [Google Scholar]
- Chen Z.; Ludwig M.; Warr G. G.; Atkin R. Effect of Cation Alkyl Chain Length on Surface Forces and Physical Properties in Deep Eutectic Solvents. J. Colloid Interface Sci. 2017, 494, 373–379. 10.1016/j.jcis.2017.01.109. [DOI] [PubMed] [Google Scholar]
- Ibrahim R. K.; Hayyan M.; Alsaadi M. A.; Ibrahim S.; Hayyan A.; Hashim M. A. Diethylene Glycol Based Deep Eutectic Solvents and Their Physical Properties. Stud. Univ. Babes-Bolyai, Chem. 2017, 62, 433–450. 10.24193/subbchem.2017.4.37. [DOI] [Google Scholar]
- Ibrahim R. K.; Hayyan M.; AlSaadi M. A.; Ibrahim S.; Hayyan A.; Hashim M. A. Physical Properties of Ethylene Glycol-Based Deep Eutectic Solvents. J. Mol. Liq. 2019, 276, 794–800. 10.1016/j.molliq.2018.12.032. [DOI] [Google Scholar]
- Christopher R.; Mchem H.. Physical Properties of Alcohol Based Deep Eutectic Solvents. PhD Thesis, University of Leicester, 2008. [Google Scholar]
- Omar K. A.; Sadeghi R. Novel Benzilic Acid-Based Deep-Eutectic-Solvents: Preparation and Physicochemical Properties Determination. Fluid Phase Equilib. 2020, 522, 112752. 10.1016/j.fluid.2020.112752. [DOI] [Google Scholar]
- López N.; Delso I.; Matute D.; Lafuente C.; Artal M. Characterization of Xylitol or Citric Acid:Choline Chloride:Water Mixtures: Structure, Thermophysical Properties, and Quercetin Solubility. Food Chem 2020, 306, 125610. 10.1016/j.foodchem.2019.125610. [DOI] [PubMed] [Google Scholar]
- Chanioti S.; Tzia C. Extraction of Phenolic Compounds from Olive Pomace by Using Natural Deep Eutectic Solvents and Innovative Extraction Techniques. Innovative Food Sci. Emerging Technol. 2018, 48, 228–239. 10.1016/j.ifset.2018.07.001. [DOI] [Google Scholar]
- Chanioti S.; Constantina T.. Application of Natural Deep Eutectic Solvents for Extraction of Polyphenolics from Olive Oil By-Products Using Microwaves. 2016.
- Omar K. A.; Sadeghi R. Novel Diglycolic Acid-Based Deep Eutectic Solvents and Their Applications as a Rust Remover. J. Mol. Liq. 2020, 312, 113380. 10.1016/j.molliq.2020.113380. [DOI] [Google Scholar]
- Lapeña D.; Lomba L.; Artal M.; Lafuente C.; Giner B. Thermophysical Characterization of the Deep Eutectic Solvent Choline Chloride:Ethylene Glycol and One of Its Mixtures with Water. Fluid Phase Equilib. 2019, 492, 1–9. 10.1016/j.fluid.2019.03.018. [DOI] [Google Scholar]
- Klein J. M.; Squire H.; Dean W.; Gurkan B. E. From Salt in Solution to Solely Ions: Solvation of Methyl Viologen in Deep Eutectic Solvents and Ionic Liquids. J. Phys. Chem. B 2020, 124, 6348–6357. 10.1021/acs.jpcb.0c03296. [DOI] [PubMed] [Google Scholar]
- Hayyan A.; Mjalli F. S.; AlNashef I. M.; Al-Wahaibi T.; Al-Wahaibi Y. M.; Hashim M. A. Fruit Sugar-Based Deep Eutectic Solvents and Their Physical Properties. Thermochim. Acta 2012, 541, 70–75. 10.1016/j.tca.2012.04.030. [DOI] [Google Scholar]
- Bergua F.; Delso I.; Muñoz-Embid J.; Lafuente C.; Artal M. Structure and Properties of Two Glucose-Based Deep Eutectic Systems. Food Chem. 2021, 336, 127717. 10.1016/j.foodchem.2020.127717. [DOI] [PubMed] [Google Scholar]
- Hayyan A.; Mjalli F. S.; AlNashef I. M.; Al-Wahaibi Y. M.; Al-Wahaibi T.; Hashim M. A. Glucose-Based Deep Eutectic Solvents: Physical Properties. J. Mol. Liq. 2013, 178, 137–141. 10.1016/j.molliq.2012.11.025. [DOI] [Google Scholar]
- Mjalli F. S.; Vakili-Nezhaad G.; Shahbaz K.; AlNashef I. M. Application of the Eötvos and Guggenheim Empirical Rules for Predicting the Density and Surface Tension of Ionic Liquids Analogues. Thermochim. Acta 2014, 575, 40–44. 10.1016/j.tca.2013.10.017. [DOI] [Google Scholar]
- Francisco M.; van den Bruinhorst A.; Zubeir L. F.; Peters C. J.; Kroon M. C. A New Low Transition Temperature Mixture (LTTM) Formed by Choline Chloride+lactic Acid: Characterization as Solvent for CO2 Capture. Fluid Phase Equilib. 2013, 340, 77–84. 10.1016/j.fluid.2012.12.001. [DOI] [Google Scholar]
- Gajardo-Parra N. F.; Lubben M. J.; Winnert J. M.; Leiva Á.; Brennecke J. F.; Canales R. I. Physicochemical properties of choline chloride-based deep eutectic solvents and excess properties of their pseudo-binary mixtures with 1-butanol. J. Chem. Thermodyn. 2019, 133, 272–284. 10.1016/j.jct.2019.02.010. [DOI] [Google Scholar]
- Sanchez-Fernandez A.; Hammond O. S.; Jackson A. J.; Arnold T.; Doutch J.; Edler K. J. Surfactant-Solvent Interaction Effects on the Micellization of Cationic Surfactants in a Carboxylic Acid-Based Deep Eutectic Solvent. Langmuir 2017, 33, 14304–14314. 10.1021/acs.langmuir.7b03254. [DOI] [PubMed] [Google Scholar]
- D’Agostino C.; Harris R. C.; Abbott A. P.; Gladden L. F.; Mantle M. D. Molecular Motion and Ion Diffusion in Choline Chloride Based Deep Eutectic Solvents Studied by 1H Pulsed Field Gradient NMR Spectroscopy. Phys. Chem. Chem. Phys. 2011, 13, 21383–91. 10.1039/c1cp22554e. [DOI] [PubMed] [Google Scholar]
- Mjalli F. S.; Murshid G.; Al-Zakwani S.; Hayyan A. Monoethanolamine-Based Deep Eutectic Solvents, Their Synthesis and Characterization. Fluid Phase Equilib. 2017, 448, 30–40. 10.1016/j.fluid.2017.03.008. [DOI] [Google Scholar]
- Omar K. A.; Sadeghi R. Novel Ninhydrin-Based Deep Eutectic Solvents for Amino Acid Detection. J. Mol. Liq. 2020, 303, 112644. 10.1016/j.molliq.2020.112644. [DOI] [Google Scholar]
- Abbott A. P.; Al-Murshedi A. Y. M.; Alshammari O. A. O.; Harris R. C.; Kareem J. H.; Qader I. B.; Ryder K. Thermodynamics of Phase Transfer for Polar Molecules from Alkanes to Deep Eutectic Solvents. Fluid Phase Equilib. 2017, 448, 99–104. 10.1016/j.fluid.2017.05.008. [DOI] [Google Scholar]
- Abbott A. P.; Ahmed E. I.; Harris R. C.; Ryder K. S. Evaluating Water Miscible Deep Eutectic Solvents (DESs) and Ionic Liquids as Potential Lubricants. Green Chem. 2014, 16, 4156–4161. 10.1039/c4gc00952e. [DOI] [Google Scholar]
- Abbott A. P.; Boothby D.; Capper G.; Davies D. L.; Rasheed R. K. Deep Eutectic Solvents Formed between Choline Chloride and Carboxylic Acids: Versatile Alternatives to Ionic Liquids. J. Am. Chem. Soc. 2004, 126, 9142–9147. 10.1021/ja048266j. [DOI] [PubMed] [Google Scholar]
- Chen Y.; Fu L.; Liu Z.; Dai F.; Dong Z.; Li D.; Liu H.; Zhao D.; Lou Y. Surface Tension and Surface Thermodynamic Properties of PEG-Based Deep Eutectic Solvents. J. Mol. Liq. 2020, 318, 114042. 10.1016/j.molliq.2020.114042. [DOI] [Google Scholar]
- Hayyan A.; Hadj-Kali M. K.; Salleh M. Z. M.; Hashim M. A.; Rubaidi S. R.; Hayyan M.; Zulkifli M. Y.; Rashid S. N.; Mirghani M. E. S.; Ali E.; Basirun W. J. Characterization of Tetraethylene Glycol-Based Deep Eutectic Solvents and Their Potential Application for Dissolving Unsaturated Fatty Acids. J. Mol. Liq. 2020, 312, 113284. 10.1016/j.molliq.2020.113284. [DOI] [Google Scholar]
- Ji X.; Xie Y.; Zhang Y.; Lu X.. CO2 Capture/Separation Using Choline Chloride-Based Ionic Liquids. 13th International Conference on Properties and. Phase Equilibria for Products and Process Design, 2013; pp 1–13.
- Doherty B.; Acevedo O. B. OPLS Force Field for Choline Chloride-Based Deep Eutectic Solvents. J. Phys. Chem. B 2018, 122, 9982. 10.1021/acs.jpcb.8b06647. [DOI] [PubMed] [Google Scholar]
- Li J. J.; Xiao H.; Tang X. D.; Zhou M. Green Carboxylic Acid-Based Deep Eutectic Solvents as Solvents for Extractive Desulfurization. Energy and Fuels 2016, 30, 5411–5418. 10.1021/acs.energyfuels.6b00471. [DOI] [Google Scholar]
- Mjalli F. S. Novel Amino Acids Based Ionic Liquids Analogues: Acidic and Basic Amino Acids. J. Taiwan Inst. Chem. Eng. 2016, 61, 64–74. 10.1016/j.jtice.2015.12.020. [DOI] [Google Scholar]
- Jibril B.; Mjalli F.; Naser J.; Gano Z. New Tetrapropylammonium Bromide-Based Deep Eutectic Solvents: Synthesis and Characterizations. J. Mol. Liq. 2014, 199, 462–469. 10.1016/j.molliq.2014.08.004. [DOI] [Google Scholar]
- Wu J.; Yin T. Novel Paeonol-Matrine Deep Eutectic Solvent: Physicochemical Properties and Cytotoxicity. J. Mol. Liq. 2022, 348, 118068. 10.1016/j.molliq.2021.118068. [DOI] [Google Scholar]
- Abdallah M. M.; Müller S.; González de Castilla A. G. de; Gurikov P.; Matias A. A.; Bronze M. do R.; Fernández N. Physicochemical Characterization and Simulation of the Eutectic Solvent Systems. Molecules 2021, 26, 1801–1816. 10.3390/molecules26061801. [DOI] [PMC free article] [PubMed] [Google Scholar]
- Zeng C.; Liu Y.; Ding Z.; Xia H.; Guo S. Physicochemical Properties and Antibacterial Activity of Hydrophobic Deep Eutectic Solvent-in-Water Nanoemulsion. J. Mol. Liq. 2021, 338, 116950. 10.1016/j.molliq.2021.116950. [DOI] [Google Scholar]
- Nunes R. J.; Saramago B.; Marrucho I. M. Surface Tension of Dl -Menthol:Octanoic Acid Eutectic Mixtures. J. Chem. Eng. Data 2019, 64, 4915–4923. 10.1021/acs.jced.9b00424. [DOI] [Google Scholar]
- Liu K.; Li B.; Zhang R.; Zhang Y.; Zhang J. Density, Viscosity, Surface Tension, Spectroscopic Properties and Computational Chemistry of the 1, 4-Butanediol + 1, 3-Propanediamine-Based Deep Eutectic Solvent. J. Iran. Chem. Soc. 2021, 19, 1203. 10.1007/s13738-021-02371-0. [DOI] [Google Scholar]
- Cardellini F.; Tiecco M.; Germani R.; Cardinali G.; Corte L.; Roscini L.; Spreti N. Novel Zwitterionic Deep Eutectic Solvents from Trimethylglycine and Carboxylic Acids: Characterization of Their Properties and Their Toxicity. RSC Adv. 2014, 4, 55990–56002. 10.1039/c4ra10628h. [DOI] [Google Scholar]
- Abbott A. P.; Barron J. C.; Ryder K. S.; Wilson D. Eutectic-Based Ionic Liquids with Metal-Containing Anions and Cations. Chem.—Eur. J. 2007, 13, 6495–6501. 10.1002/chem.200601738. [DOI] [PubMed] [Google Scholar]
- Klamt A. The COSMO and COSMO-RS solvation models: COSMO and COSMO-RS. Wiley Interdiscip. Rev. Comput. Mol. Sci. 2017, 8, e1338 10.1002/wcms.1338. [DOI] [Google Scholar]
- Lemaoui T.; Darwish A. S.; Attoui A.; Abu Hatab F.; Hammoudi N. E. H.; Benguerba Y.; Vega L. F.; Alnashef I. M. Predicting the Density and Viscosity of Hydrophobic Eutectic Solvents: Towards the Development of Sustainable Solvents. Green Chem. 2020, 22, 8511–8530. 10.1039/d0gc03077e. [DOI] [Google Scholar]
- Torrecilla J. S.; Palomar J.; Lemus J.; Rodríguez F. A Quantum-Chemical-Based Guide to Analyze/Quantify the Cytotoxicity of Ionic Liquids. Green Chem. 2010, 12, 123–134. 10.1039/b919806g. [DOI] [Google Scholar]
- Abranches D. O.; Zhang Y.; Maginn E. J.; Colón Y. J. Sigma Profiles in Deep Learning: Towards a Universal Molecular Descriptor. Chem. Commun. 2022, 58, 5630–5633. 10.1039/d2cc01549h. [DOI] [PubMed] [Google Scholar]
- Wang J.; Song Z.; Chen L.; Xu T.; Deng L.; Qi Z. Prediction of CO2 Solubility in Deep Eutectic Solvents Using Random Forest Model Based on COSMO-RS-Derived Descriptors. Green Chem. Eng. 2021, 2, 431–440. 10.1016/j.gce.2021.08.002. [DOI] [Google Scholar]
- Sosa A.; Ortega J.; Fernández L.; Palomar J. Development of a Method to Model the Mixing Energy of Solutions Using COSMO Molecular Descriptors Linked with a Semi-Empirical Model Using a Combined ANN-QSPR Methodology. Chem. Eng. Sci. 2020, 224, 115764. 10.1016/j.ces.2020.115764. [DOI] [Google Scholar]
- Palomar J.; Torrecilla J.; Lemus J.; Ferro V. R.; Rodrıguez F. A COSMO-RS Based Guide to Analyze/Quantify the Polarity of Ionic Liquids and Their Mixtures with Organic Cosolvents. Phys. Chem. Chem. Phys. 2010, 12, 1991. 10.1039/b920651p. [DOI] [PubMed] [Google Scholar]
- Monjezi M.; Dehghani H. Evaluation of Effect of Blasting Pattern Parameters on Back Break Using Neural Networks. Int. J. Rock Mech. Min. Sci. 2008, 45, 1446–1453. 10.1016/j.ijrmms.2008.02.007. [DOI] [Google Scholar]
- Tropsha A.; Gramatica P.; Gombar V. K. The Importance of Being Earnest: Validation Is the Absolute Essential for Successful Application and Interpretation of QSPR Models. QSAR Comb. Sci. 2003, 22, 69–77. 10.1002/qsar.200390007. [DOI] [Google Scholar]
- Gramatica P.; Cassani S.; Sangion A. Aquatic Ecotoxicity of Personal Care Products: QSAR Models and Ranking for Prioritization and Safer Alternatives’ Design. Green Chem. 2016, 18, 4393–4406. 10.1039/c5gc02818c. [DOI] [Google Scholar]
Associated Data
This section collects any data citations, data availability statements, or supplementary materials included in this article.


