. 2022 Sep 2;11:e75908. doi: 10.7554/eLife.75908

Figure 3. Transcriptomic data and [U-13C]glucose labelling reveal that stromal cell metabolism is shifted towards higher glycolysis and ROS upon co-culture with AML cells.

(A) Top 25 GSEA hallmark gene sets ranked by expression in MS-5 cells only vs co-culture with SKM-1 cells, analysed using the collection of hallmark gene sets from Molecular Signature Database with a false discovery rate threshold at 5%. p-Values for each pathway are presented as –log(10)p-value. (B) GSEA enrichment score plots of glycolysis and ROS generated using Sleuth 0.30.0 R statistical package. (C) Fold change values of detected gene transcripts (TPMs) related to glycolysis and pyruvate metabolism. FC values are represented as log2FC, red values indicate upregulation and blue values indicate downregulation in MS-5 cells in co-culture. (D) Label incorporation from [U-13C]glucose into extracellular metabolites in AML and MS-5 cells cultured alone or in co-culture after 24 hr. Bars represent the mean of n=3 independent experiments and error bars represent standard deviations. (E), Label incorporation from [U-13C]glucose into intracellular acetate, alanine and lactate in MS-5 cells cultured alone or in co-culture after 24 hr. Bars represent the mean of n=3 independent experiments and error bars represent standard deviations. p-Values are represented by n.s. for not significant * for p-value <0.05, ** for p-value <0.01 and *** for p-value <0.001.

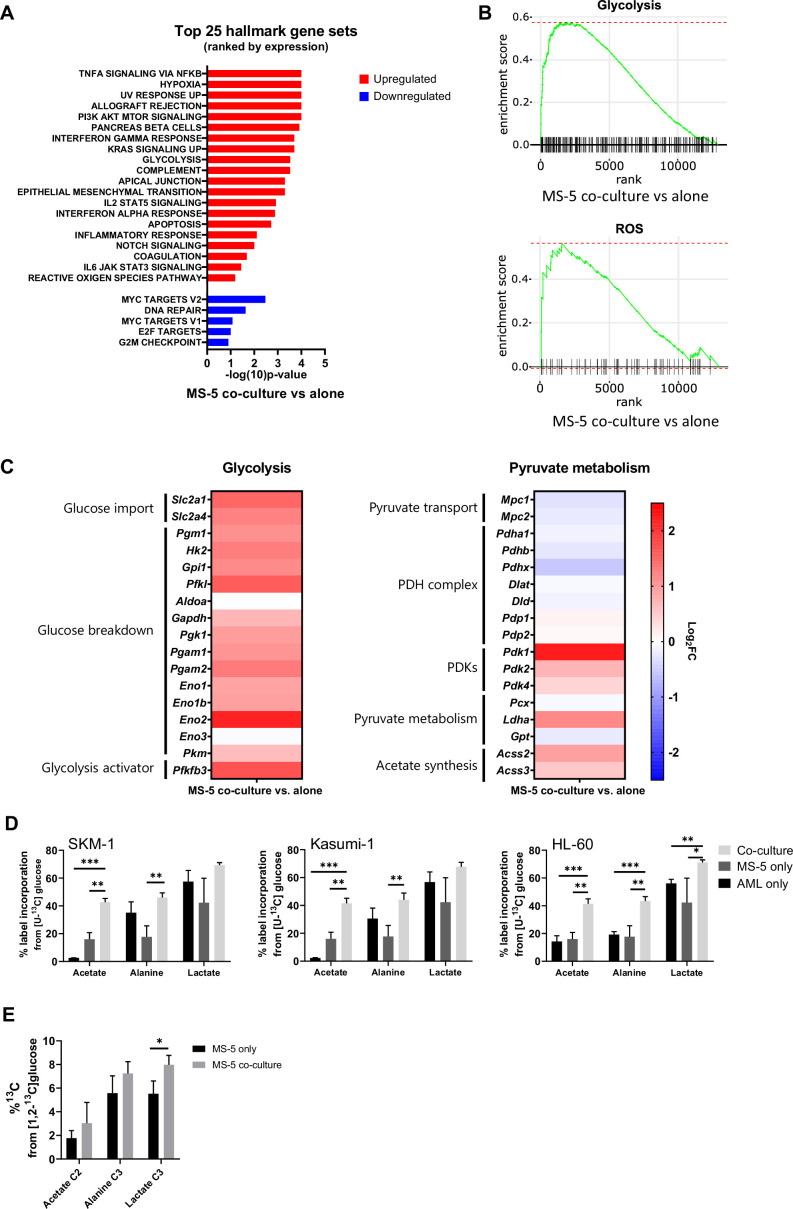
Figure 3—source data 1. Data and stats for panels included in Figure 3.

Figure 3.

Figure 3—figure supplement 1. PCA component analysis, heat map of differentially expressed genes and qPCR for MS-5 cells cultured alone and in co-culture with SKM-1 cells.

Figure 3—figure supplement 1.

(A) PCA plot showing the clustering of individual samples of MS-5 cells cultured alone (MO) and MS-5 cells in co-culture (MC). The x and y axis values represent the variation between the sample groups. Generated using Sleuth 0.30.0 R statistical package. (B) Heat map of differentially expressed genes in MS-5 only (red) vs MS-5 co-culture (blue) calculated using the Wald statistical test, correcting for multiple testing comparison employing the Benjamini-Hochberg method using a false discovery rate threshold of 1% (q-value <0.01). Generated using Sleuth 0.30.0 R statistical package. (C) Quantitative PCR mRNA expression values for RNA sequencing validation of MS-5 cells cultured alone and in co-culture with SKM-1 cells. The gene set chosen was Hk2, Pdhx, Pdk1, and Pdk2. mRNA quantification was normalized to B2m house-keeping gene. Bars represent the mean and error bars represent the SEM of three independent experiments (n=3). An unpaired Student’s t-test was applied for each gene and p-values are represented by * for p-value <0.05, ** for p-value <0.01 and *** for p-value <0.001.
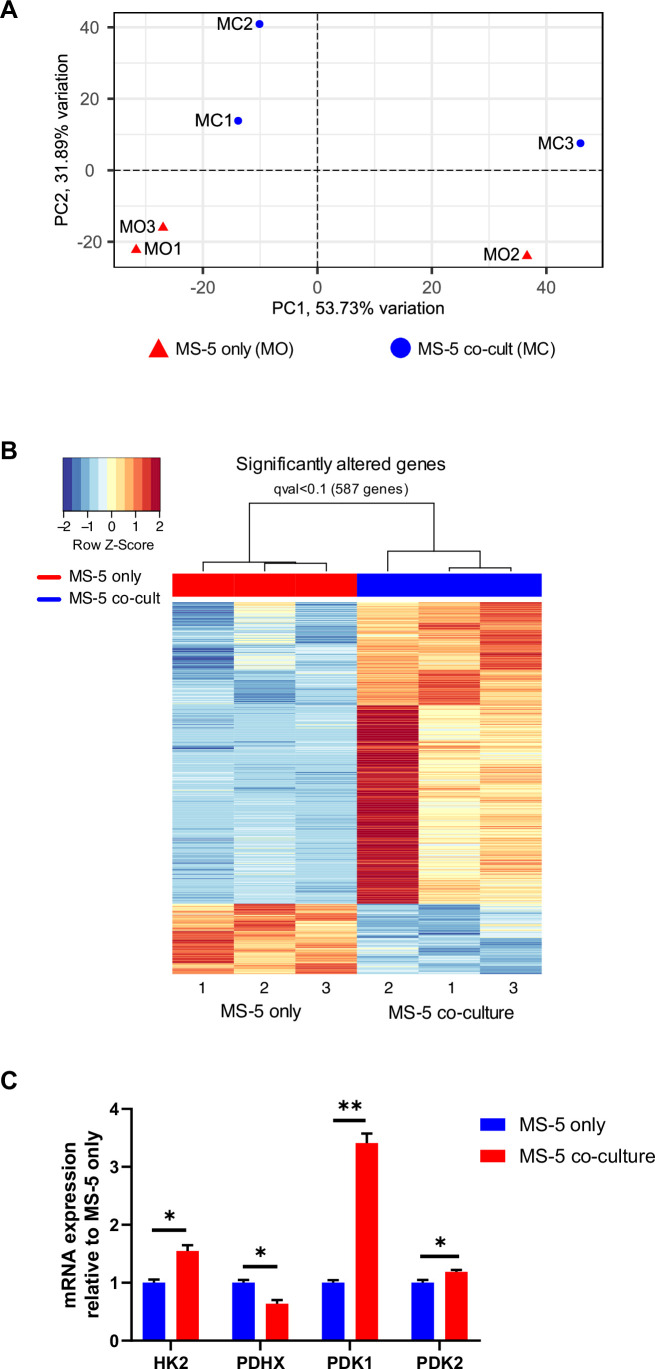
Figure 3—figure supplement 1—source data 1. mRNA expression in MS-5 cells cocultured with SKM-1 cells relative to MS-5 alone.