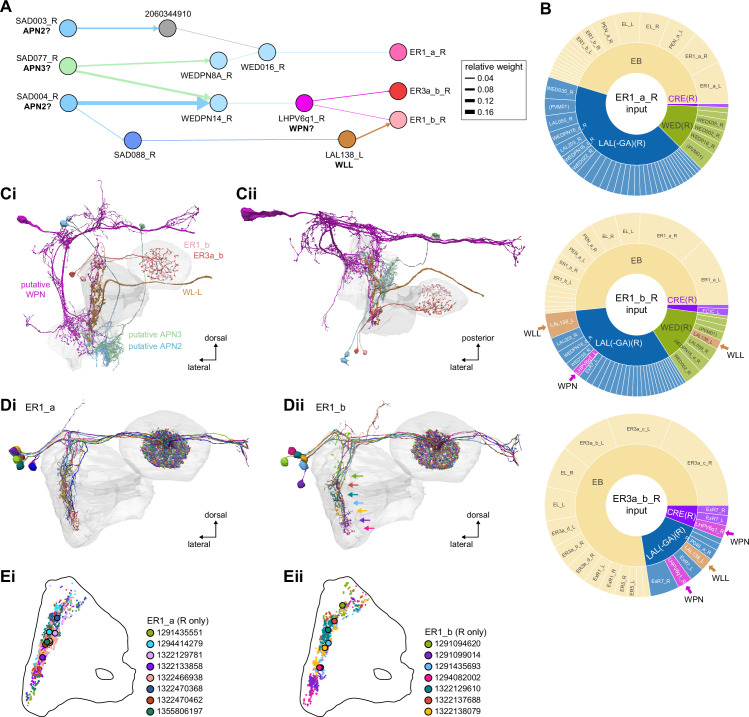
Figure 9. Mechanosensory input to the ellipsoid body (EB).
(A) Connectivity graph of paths from putative APN2 and APN3 to ER neurons. Only pathways with a minimal total weight of 1E-05 and a maximum length of 5 were considered. APN: AMMC projection neuron; WPN: wedge projection neuron; WLL: wedge-LAL-LAL neuron. (B) Hierarchical pie charts showing the fraction of inputs from various neuron types separated by input region for ER1_a (left), ER1_b (center), and ER3a_b (right) neurons. The fractions represent the average per type (computed only for neurons from the right hemisphere). Arrows highlight inputs from WPN (LHPV6q1) and WL-L (LAL138). (C) Morphological renderings of putative APN2 (SAD003, SAD004), APN3 (SAD077), WPN (LHPV6q1), and WL-L (LAL138) neurons as well as ER1_b and ER3a_b. (Ci). Frontal view. (Cii). Top view. (D) Morphological renderings of ER1_a (Di) and ER1_b (Dii). Only neurons with cell bodies in the right hemisphere are shown. Individual neurons are colored differently. (E) Projections of synapse locations of the neurons shown in (D). Synapses are colored by neuron identity (see legend). Larger, black-outlined dots mark the mean synapse position (center of mass) of each neuron. Synapses of individual ER1_b neurons separate along the dorsal-ventral axis (Eii), whereas synapses of ER1_a neurons are more spatially mixed (Ei).


