Abstract
The O/W emulsion method has been widely used for the production of poly (lactide-co-glycolide) (PLGA) microparticles. Recently, a template method has been used to make homogeneous microparticles with predefined size and shape, and shown to be useful in encapsulating different types of active compounds. However, differences between the template method and emulsion method have not been examined. In the current study, PLGA microparticles were prepared by the two methods using glycyrrhetinic acid (GA) as a model drug. The properties of obtained microparticles were characterized and compared on drug distribution, in vitro release, and degradation. An encapsulation efficiency of over 70% and a mean particle size of about 40 μm were found for both methods. DSC thermograms and XRPD diffractograms indicated that GA was highly dispersed or in the amorphous state in the matrix of microparticles. The emulsion method produced microparticles of a broad size distribution with a core–shell type structure and many drug-rich domains inside each microparticle. Its drug release and matrix degradation was slow before Day 50 and then accelerated. In contrast, the template method formed microparticles with narrow size distribution and drug distribution without apparent drug-rich domains. The template microparticles with a loading efficiency of 85% exhibited a zero-order release profile for 3 months after the initial burst release of 26.7%, and a steady surface erosion process as well. The same microparticles made by two different methods showed two distinguished drug release profiles. The two different methods can be supplementary with each other in optimization of drug formulation for achieving predetermined drug release patterns.
Keywords: PLGA microparticles, Hydrogel template method, O/W emulsion method, Glycyrrhetinic acid
1. Introduction
Oil-in-water (O/W) emulsion method has been widely used in encapsulation of active pharmaceutical ingredients into microparticles (Ye et al., 2010). This method generally forms microparticles with a spherical shape and a broad size distribution, which may cause a lack of good reproducibility (Bock et al., 2011). Since morphology has been demonstrated to be an important factor for in vitro and in vivo performance of microparticles (Tsai et al., 2013), new techniques have been developed for better control of particle size and size distribution. Acharya et al. (2010a) have described a new microfabrication technique, known as the polymer (or hydrogel) template method, for preparation of microparticles. This approach provides precise control of particle size and shape with a narrow size distribution, and also higher encapsulation capacity and efficiency for drug loading, in comparison with the conventional emulsion-based methods. The effects of particle size, drug properties, and poly (lactide-co-glycolide) (PLGA) types on drug release from microparticles prepared by the template method were described (Lu et al., 2014), but the differences in drug release properties between microparticles prepared by the hydrogel template method and an emulsion method have not been examined.
As one of the polymers used in clinical products approved by the U.S. Food and Drug Administration (FDA), PLGA has become one of the most widely used biodegradable and biocompatible materials in microparticle production (Pandita et al., 2015). Previous studies have shown that PLGA molecular weight and monomer composition have influence on microparticle characteristics (Jain, 2000), especially on the drug release pattern and degradation property (Anderson and Shive, 2012). But the impact of microparticle fabrication techniques on the process of PLGA hydrolysis has seldom been reported. The main objective of the present study is to evaluate the effects of fabrication techniques, i.e., an emulsion method and the template method, on microparticle properties. Glycyrrhetinic acid (GA), a drug for chronic hepatitis (Wang et al., 2012), was used as the model compound in this study. GA-PLGA microparticles were prepared and characterized for their morphology, drug distribution, in vitro release and degradation profiles.
2. Materials and methods
2.1. Materials
PLGA (lactide:glycolide ratio of 50:50; 90 kDa) was purchased from Shandong Institute of Medical Instruments (Jinan, China). Glycyrrhetinic acid (GA) of 99% purity was supplied by Jingzhu Biological Technology Co., Ltd. (Nanjing, China). Coumarin 6 was from Sigma–Aldrich Co. (St. Louis, MO, USA). Poly (vinyl alcohol) (PVA-1788, 44.05 kDa) was provided by Aladdin Reagent Co. (Shanghai, China). Dichloromethane (DCM), dioxane and methanol were of HPLC grade from Fisher Co. (USA). All other reagents were analytical grade, and double distilled water was used throughout the experiment.
2.2. Preparation of drug-loaded microparticles
2.2.1. O/W emulsion method
An O/W emulsion method was used for preparation of GA-loaded PLGA (GA-PLGA) microparticles (Elkharraz et al., 2011). In a typical procedure, 90 mg GA and 210 mg PLGA were dissolved in 2 mL mixtures of dichloromethane and dioxane (2:1, v/v) by vortexing. The obtained GA-PLGA solution was then injected into 40 mL 1% (w/v) PVA solution and homogenized at 8000 rpm for 1 min using an Ultra TurraxT18 homogenizer (IKA, Germany) to form O/W emulsion. The initial emulsion was subsequently dispersed into 800 mL 0.5% PVA solution and kept stirring at 40 °C for 3 h to remove the organic solvents. Finally, microparticles were collected after centrifugation at 4000 rpm for 3 min, washed with water for 3 times and freeze-dried for 24 h by FD-1C freezing dryer (Beijing, China).
2.2.2. Hydrogel template method
PVA templates were prepared by a previously published method (Acharya et al., 2010a,b) and contained circular wells (50 μm in diameter and 50 μm in depth). A volume of 300 μL GA-PLGA solution described above was swiped back and forth on the template and evenly filled into the wells. The templates were left at room temperature for 24 h to evaporate the organic solvents. The dried templates were then dissolved in water, followed by filtration through a 75 μm sieve and centrifugation at 4000 rpm for 3 min to collect microparticles. The obtained microparticles were washed with water and freeze-dried.
2.3. Characterization of GA-PLGA microparticles
2.3.1. Shape and morphology
The surface morphology and inner structure of GA-PLGA microparticles were studied by a JEOL JSM-7500P (Tokyo, Japan) scanning electron microscope (SEM). Briefly, samples were affixed on aluminum studs and coated with platinum using a sputter coater under vacuum (0.1 mmHg) at a current intensity of 20 mA. The cross-sections of microparticles were prepared according to the previously published method (Xiao et al., 2013). Briefly, samples were dispersed in an aqueous solution of 30% gelatin and 5% glycerin and kept at 37 °C for 2 h. The suspension was drawn into a 1 mL syringe and stored at −80 °C for 8 h. The solid sample was then sectioned by a Cryostat Microtome (CM1950, Leica, Germany) at −20 °C. The sections with a thickness of 20 μm were transferred to carbon tapes for SEM observation.
2.3.2. Particle size analysis
Particle size and size distribution of microparticles were analyzed by a MicrotracX-100 laser particle sizer (Honeywell, USA) equipped with appropriate analysis software (MICROTRAC 9.01). Approximately 20 mg of microparticles were dispersed in 10 mL of aqueous solution containing PVA (0.5%) and Tween 80 (0.1%) and subjected to vortex mixing and ultrasonic dispersing before analysis. The particle size was expressed as volume weighted mean diameter (Dv) in micrometers. The width of size distribution was calculated according to the equation below (Vladisavljević and Schubert, 2003).
where d10, d50, and d90 are microparticle diameters below which 10, 50, and 90% of the volume of microparticles lies, respectively.
2.3.3. Determination of drug loading
To determine the loading percentage of GA into the microparticles, 10 mg of microparticles were accurately weighed and dissolved in 0.3 mL dioxane. The resulting solution was then diluted with methanol to 10 mL. The concentration of GA was determined by a reversed-phase high pressure liquid chromatography (RP-HPLC) system with a C18 column (250 × 4.6 mm × 5 μm, DIAMONSIL). Then drug loading (D–L) and encapsulation efficiency (E–E) of the microparticles were calculated by the following equations.
2.3.4. Thermal analysis
Differential scanning calorimetry (DSC) was carried out using a SETSYS-1750CS Evolution thermogravimetry analyzer (SERARAM, France). The samples were weighed accurately and sealed into aluminum pans. As a reference, an empty pan was used. Heating curves were recorded at a scan rate of 10 °C/min from 25 to 450 °C under a dry nitrogen atmosphere.
2.3.5. XRPD analysis
The crystalline state of GA, PLGA, physical mixtures and microparticles was characterized with an X-ray powder diffraction (XRPD) instrument (D/MARX2200/PC, Rigaku Co., Tokyo, Japan) using CuKα radiation at 40 mA and 40 kV. Standard runs were performed with a scanning rate of 8°/min over a 2θ range of 3–60°.
2.4. Observation of drug distribution inside microparticles
Coumarin 6 (C6) was used as an indicator to observe drug distribution inside the microparticles (Qi et al., 2014b). C6 (3 mg), GA (90 mg) and PLGA (210 mg) were dissolved in 2 mL mixtures of dichloromethane and dioxane (2/1, V/V). Then the C6-GA-PLGA microparticles were prepared by the above-mentioned methods. The obtained microparticles were dispersed in water, and then observed by using combination confocal laser scanning microscopy (CLSM, Olympus FV1000-IX81, Tokyo, Japan) at excitation wavelength of 387 nm. FV10-ASW 1.7 Viewer software was utilized for image processing.
2.5. In vitro release test
GA-PLGA microparticles (20 mg) were incubated at 37 °C in 30 mL phosphate buffer saline containing 1% Tween 20 (PBST, pH 7.4) using THZ-100B thermostatic gas bath shaker (Shanghai, China). Supernatants were periodically collected by centrifugation and replaced with fresh PBST of equal volume at the pre-set time. The concentration of GA in the supernatant was determined by RP-HPLC method described above. All experiments were performed in triplicate.
2.6. In vitro degradation study
Polymer degradation study of GA-PLGA microparticles was carried out. An amount of 20 mg microparticles were incubated at 37 °C in 30 mL PBST using a thermostatic gas bath shaker. At pre-set intervals, the vials were centrifuged at 4000 rpm for 3 min. After removing the supernatants, the microparticles were dried in a freeze-dryer for 24 h. Then the surface morphology of the microparticles was observed by SEM. The pH values of the release medium were also measured by a PHS-3E laboratory pH meter (Shanghai, China) during the degradation study.
3. Results and discussion
3.1. Preparation of microparticles
The flow chart for the key processes of these fabrication techniques is shown in Fig. 1. The influence of process parameters on microparticles obtained can be summarized into two aspects, morphology and structure. The morphology includes shape and size of microparticles, whereas the structure is about the relative distribution of drug and polymer in microparticles.
Fig. 1.
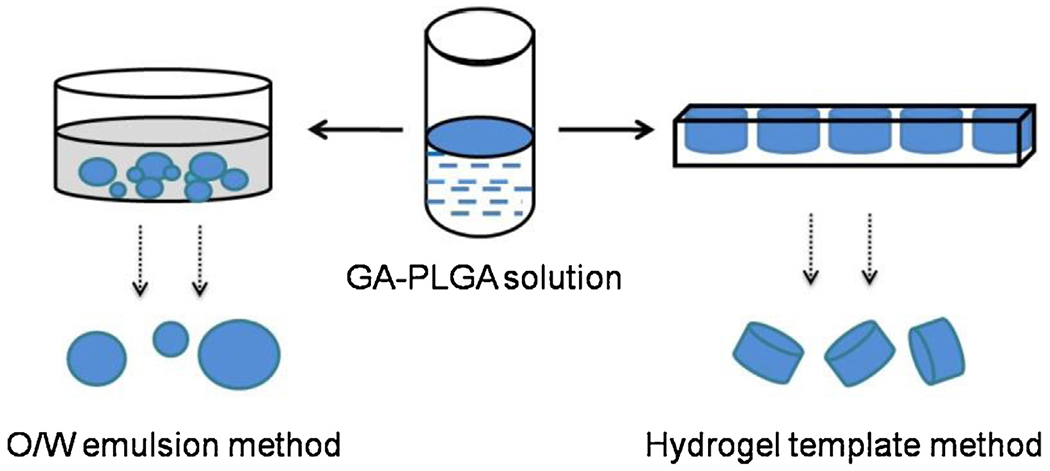
Fabrication methods for GA-loaded PLGA microparticles.
For the conventional emulsion method (Freitas et al., 2005), the drug-polymer solution was dispersed in PVA solution by stirring, homogenization or ultrasonication, and formed the primary O/W emulsion. Then the primary emulsion was further poured into a large volume of aqueous solution and kept stirring to remove the organic solvent. The shape and size of the microparticles obtained was mostly consistent with the primary emulsion drops. The microparticles usually appeared as tiny spheres with polydispersity. Since the organic phase was incompatible with the aqueous phase, the emulsion of microparticles formed as soon as the two phases were mixed and sheared. Then the organic solvent inside the microparticles gradually diffused into the aqueous solution and slowly evaporated. During this time-consuming process, drug and polymer molecules inside the microparticles may show a relative shift because of their different affinity for the organic phase.
For the hydrogel template method (Acharya et al., 2010b), the drug-polymer solution was gradually poured onto a template of a predefined size, and then was left to dry at room temperature. Finally, the microparticles were collected by washing away the hydrogel template. Theoretically, the shape and size of the microparticles obtained were almost the same as those from the trenches of the hydrogel template. So the template approach provides uniform microparticles with predefined size and shape. In this process, only the organic solvent escaped from the opening of the trenches and directly evaporated. Thus, we can speculate that the drying process of the microparticles takes less time with the template method than for the conventional emulsion-based method under the same conditions. Accordingly, there is less time for the migration and phase separation of the drug from PLGA inside the microparticles.
Thus, although GA-PLGA microparticles were successfully prepared either by the emulsion method or by the template method under the same formulation parameters, the morphology and structure of the obtained products from these two methods may be significantly different from each other.
3.2. Characterization of microparticles
To compare the morphology of microparticles prepared by the above-mentioned techniques, shape and size of the microparticles were characterized by SEM and dynamic light scattering (DLS), respectively. As presented in Fig. 2, microparticles prepared using the emulsion method was spherical in shape with a broad size distribution, and their surface was nonporous but full of slight dimples (Fig. 2–A1). On the cross section (Fig. 2–A2), we can see that the outermost layer was dense and smooth, whereas the inner part was coarse and filled with round spots. It seems like the microparticles possessed a different texture between the external layer and the internal part, which formed a core–shell structure. This structural formation can be understood from the work by the Burt group (Gilchrist et al., 2012). In the early stage of the solvent extraction, the PLGA solution viscosity is relatively low allowing for coalescence of drug-rich domains throughout the microparticles. The drug-rich domains localized on the surface of microparticles are exposed to water during the solvent removal and washing steps. During this period the drug located on the surface may be dissolved, and this may result in dimples on the microparticle surface (Gilchrist et al., 2012). Since it is the surface layer of microparticles that are exposed to water longer than the inner side, the shell formation is understandable. The fact that the drug is separated from the polymer indicates that the interaction between PLGA and GA is not as strong as the interaction among GA molecules.
Fig. 2.
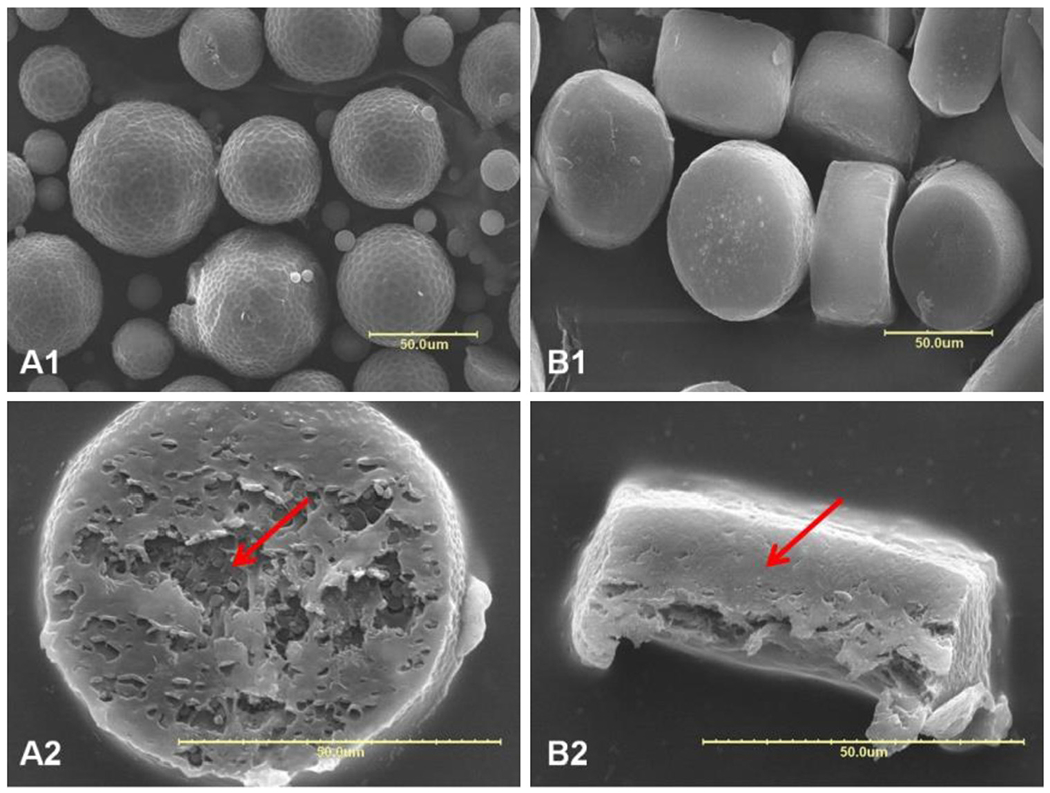
SEM images of GA-loaded microparticles prepared by O/W emulsion method (A1: surface, A2: cross-section) and template method (B1: surface, B2: cross-section). The arrows indicate cross section of the microparticles. Scale bar: 50 μm.
On the other hand, microparticles fabricated by the template method resulted in microdiscs with uniform size of approximately 50 μm in diameter and 30 μm in height. The deviation from the target size was due to the axial shrinkage of microdiscs after solvent evaporation. The surfaces of obtained microparticles did not show regular dimples as observed in Fig. 2–A. Instead, the surface appears wrinkled with many small pits (Fig. 2–B1), and the cross section shows an even and compact texture with ruffles (Fig. 2–B2). The solvent drying process here is different from that in the emulsion process, in that the organic solvent is evaporated directly into the air and microparticles were not exposed to shear stress. Since the evaporation of organic solvent into the air is expected to be faster than extraction into PVA solution and then evaporation into the air, the drug molecules in the PLGA solution may have less time to phase separate from PLGA to form drug-rich domains, leading to formation of smaller drug-rich domains as observed in microparticles by the emulsion method. Furthermore, the presence of PVA template prevented the microparticle shrinking laterally during drying, and caused partial formation of wrinkles. The two different microparticle manufacturing methods resulted in two microparticles with different morphology and phase separation between drug and PLGA.
Results from particle size characterization are summarized in Table 1. Although the microparticles obtained from the O/W emulsion method exhibited an average particle size of 40 μm, the size distribution ranged from 10 μm to over 80 μm, and its span was over 1.10, indicating a significant polydispersity. These results were consistent with SEM characterization. But for microparticles prepared using the hydrogel template method, the mean particle size was 40 μm instead of 50 μm predefined by the pattern on the template. The difference between diameter and height of dried microparticles might attribute to the deviation during DLS analysis. The span of particle size was well below 0.3, which revealed a fairly narrow size distribution.
Table 1.
Drug loading (D–L), encapsulation efficiency (E–E), and diameter (Dv) of GA-loaded microparticles, and span of microparticles prepared by two different methods. (mean ± SD, n = 3).
| Method | D–L (%) | E–E (%) | Dv (μm) | Span |
|---|---|---|---|---|
| O/W emulsion | 22.3 ± 0.0 | 74.3 ± 0.9 | 40.2 ± 16.2 | 1.11 ± 0.1 |
| Hydrogel template | 25.6 ± 0.5 | 85.3 ± 1.6 | 40.1 ± 3.1 | 0.20 ± 0.0 |
High D–L can meet the demands for longer-term release or lower injection amount of microparticles (Qi et al., 2013). If solubility of the drug in the continuous phase is higher than in the dispersed phase, however, the drug can easily diffuse into the continuous phase during production (Yeo and Park, 2004). As a low molecular weight drug, GA is freely soluble in DCM and dioxane, but poorly soluble in water (Sui et al., 2012). Thus, it was expected to be efficiently encapsulated into the PLGA microparticles. A comparison of drug loading and encapsulation efficiency of GA-PLGA microparticles is presented in Table 1. As expected, the obtained microparticles showed a preferable E–E of over 70% at a theoretical D–L of 30%. The E–E of the emulsion method was significantly lower than that of the template method, predominantly due to the diffusion of drug molecules located on the surface into external aqueous phase during the solidification process.
DSC thermograms of drug, polymer, physical mixture and microparticles are shown in Fig. 3. PLGA showed a glass transition at around 52 °C (Bragagni et al., 2013) and then decomposed above 250 °C. Pure GA exhibited an endothermic peak at about 300 °C as its melting point and component decomposition occurred above 370 °C. The thermogram of the physical mixture was more similar to that of pure GA powder, probably due to the overlap of melting and decomposition of the drug and polymer. For microparticles by the emulsion method, the peaks of the drug were absent but the glass transition and decomposition points of polymer were clearly identifiable, which indicated that GA was highly dispersed or in an amorphous state in the polymer matrix (Bohr et al., 2011; Zhang et al., 2011) but PLGA was precipitated out to some extent during the production process. Compared with the emulsion method, the template method resulted a similar thermogram with significantly lower peaks, which suggesting a higher dispersion degree of drug and polymer molecules into each other in the microparticle matrix.
Fig. 3.
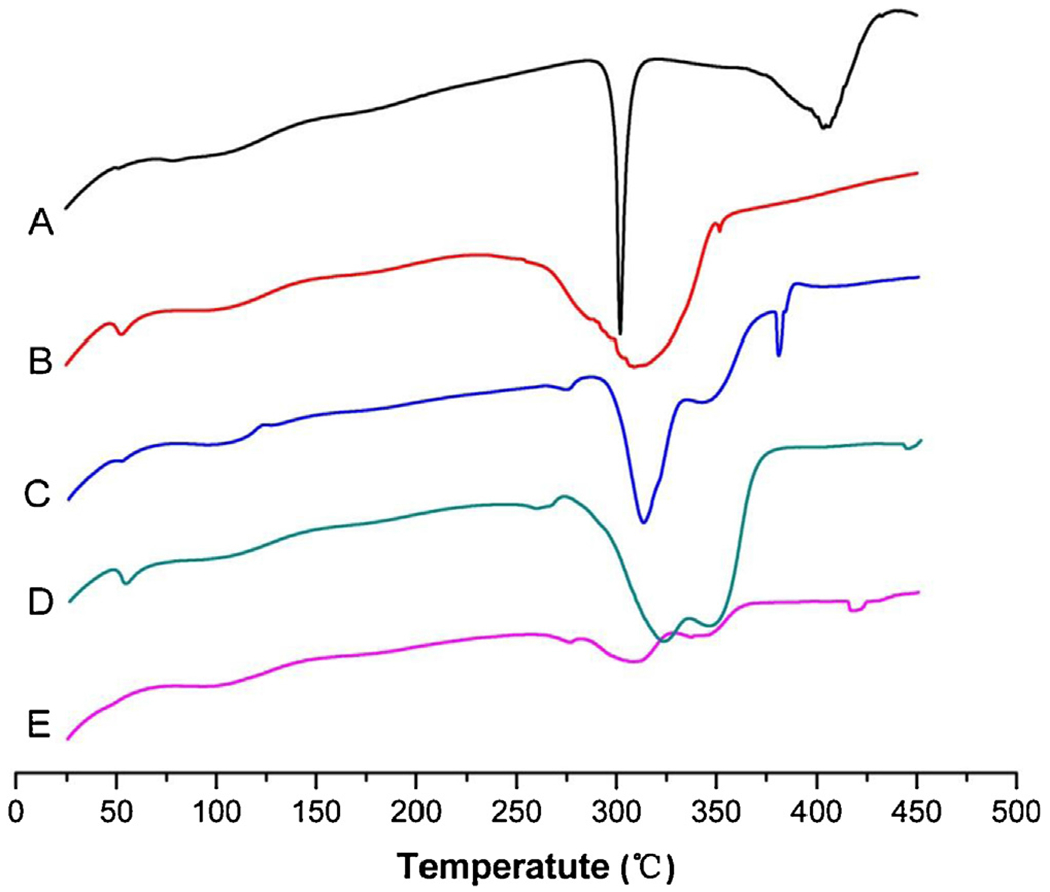
DSC thermograms of GA-loaded microparticles (A: GA, B: PLGA, C: physical mixture of GA and PLGA, D: O/W emulsion method, E: template method).
The X-ray diffractograms of samples are shown in Fig. 4. Several dominant peaks between 5° and 20° were observed for GA. A slight shift above the baseline without any dominant peaks was detected for PLGA, which indicated a basically amorphous state of the polymer. The primary peaks of GA at 2θ angles of around 13° were still observable for the physical mixture of drug and polymer at a ratio of 3:7 (w/w). However, the X-ray diffractograms of microparticles suggested that the process of drug encapsulation into microparticles resulted in the loss of drug crystallinity in comparison with the drug alone or the physical mixtures (Patel et al., 2012). The dominant peaks of GA were almost lost for both the emulsion method and the template method, indicating that GA would be either molecularly dispersed in PLGA or distributed in an amorphous form (Nath et al., 2013). Several weak peaks of GA could still be observed for the template method but not for the emulsion method, probably due to the higher drug loading and more drugs located on the surface of the microparticles by the template method.
Fig. 4.
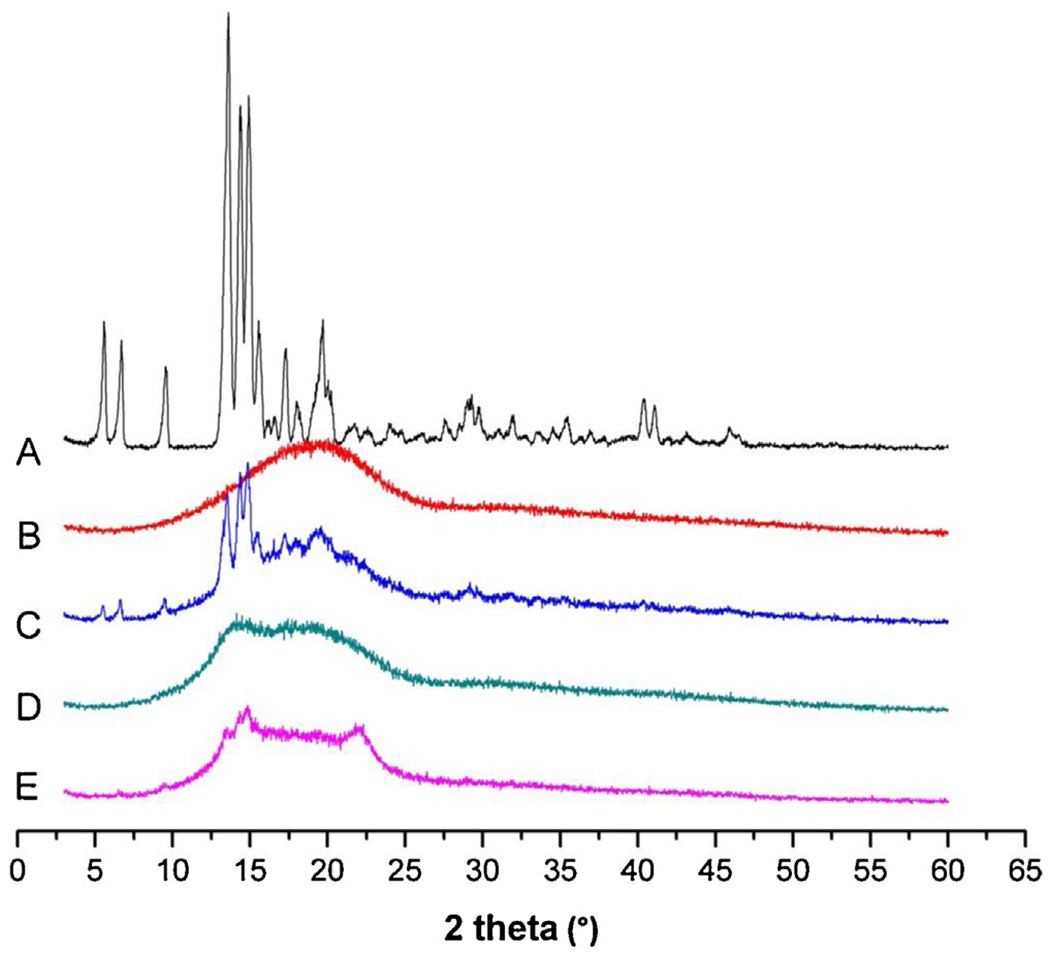
X-ray diffractograms of GA-loaded microparticles (A: GA, B: PLGA, C: physical mixture of GA and PLGA, D: O/W emulsion method, E: template method).
3.3. Drug distribution in microparticles
For a deeper insight into the influence of the fabrication process on the structure of microparticles, C6 was encapsulated along with GA into the microparticles and observed by CLSM. As shown in Fig. 5, the shape and size of microparticles characterized by CLSM were almost the same as those by SEM. Surprisingly, a large amount of red spots were observed for the microparticles from the emulsion method (Fig. 5–A). The red spots were aggregated into a circle, but no red fluorescence was seen on the periphery of the microparticles. As described in Fig. 2–A, the drug-rich domains on the periphery were likely to be dissolved away during the microparticle production process, resulting in dimples. The periphery in Fig. 5–A reflects uneven surface which is likely due to the presence of dimples. These results were also in accordance with the morphology observation, and the round spots on the cross-section by SEM exactly corresponded to the drug-rich spots under CLSM. The surface of microparticles made by the emulsion method may be denser due to the fast formation of the shell structure upon exposure to water.
Fig. 5.
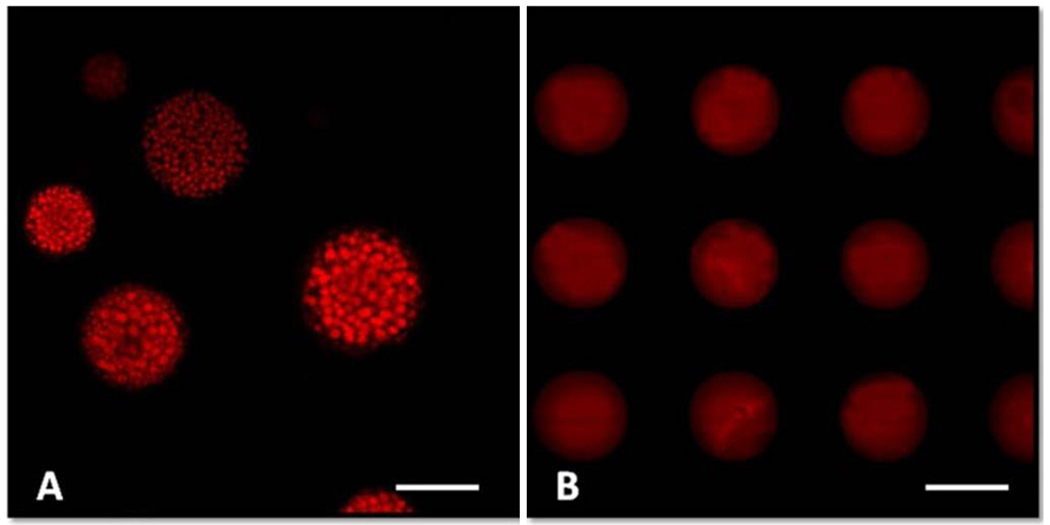
CLSM images of GA-loaded microparticles prepared by the O/W emulsion method (A) and the template method (B). Scale bar: 50 μm. (For interpretation of the references to color in the text, the reader is referred to the web version of this article.)
Phase separation of the drug and polymer occurred during the solvent evaporation process of the emulsion method, resulting in drug-rich domains inside a shell structure of microparticles. Qi et al. (2014a) observed a similar phenomenon of drug distribution in the microparticles prepared by the W/O/W emulsion-based method, but the spots under CLSM were derived from the inner aqueous droplets. These inner droplets formed pores after fully drying of microparticles, and then the drug molecules originally dissolved in the droplets were precipitated out and adhered on the inner surface of the pores. Several other reports produced microparticles with a single core and a thick shell, utilizing the phase separation phenomenon of different polymers (e.g., PLLA and PLGA) by solvent evaporation/extraction method (Kokai et al., 2010; Tan et al., 2005; Xiao et al., 2013; Zheng, 2009).
Fig. 5–B shows microparticles prior to dissolving the template in water. Many microdiscs with the same size were formed as the original template design. Red fluorescence was distributed more homogeneously in the matrix, indicating more uniform drug distribution within the microparticles prepared by the template method. Similar results were also observed in previous reports (Acharya et al., 2010a; Lu et al., 2014). These CLSM images were in good consistent with the SEM images, and also supported the DSC/XRPD results.
3.4. In vitro release
Fig. 6 shows the in vitro release profiles of GA-PLGA microparticles prepared using the two different methods. Both types of microparticles exhibited a long-term release for 3 months, and their cumulative release finally reached up to 97% at the end of the experiment. But their release behaviors were quite different. For microparticles prepared by the emulsion method, a lag time of 3 days followed by a slow release period of approximately 50 days were observed. The initial lag is most likely due to the absence of the drug on the shell, as the drug was dissolved away to form dimples. After Day 50, the cumulative drug release was increased quickly from 30% up to 97% during the last 35 days, and this is due to the degradation of PLGA. The microparticles prepared by the template method presented a very different drug release profile with an initial burst release of 26.7% at 4 h followed by a constant release up to 90 days. The steady state release without any jump during the remaining 90 days indicates no drastic change in the internal structure of the microparticles. PLGA is expected to undergo the same degradation steps regardless of which method was used to make microparticles. But the absence of the sudden increase in the drug release rate implies that the drug and PLGA molecules are assembled in such a way that the drug release is not altered after the initial burst release.
Fig. 6.
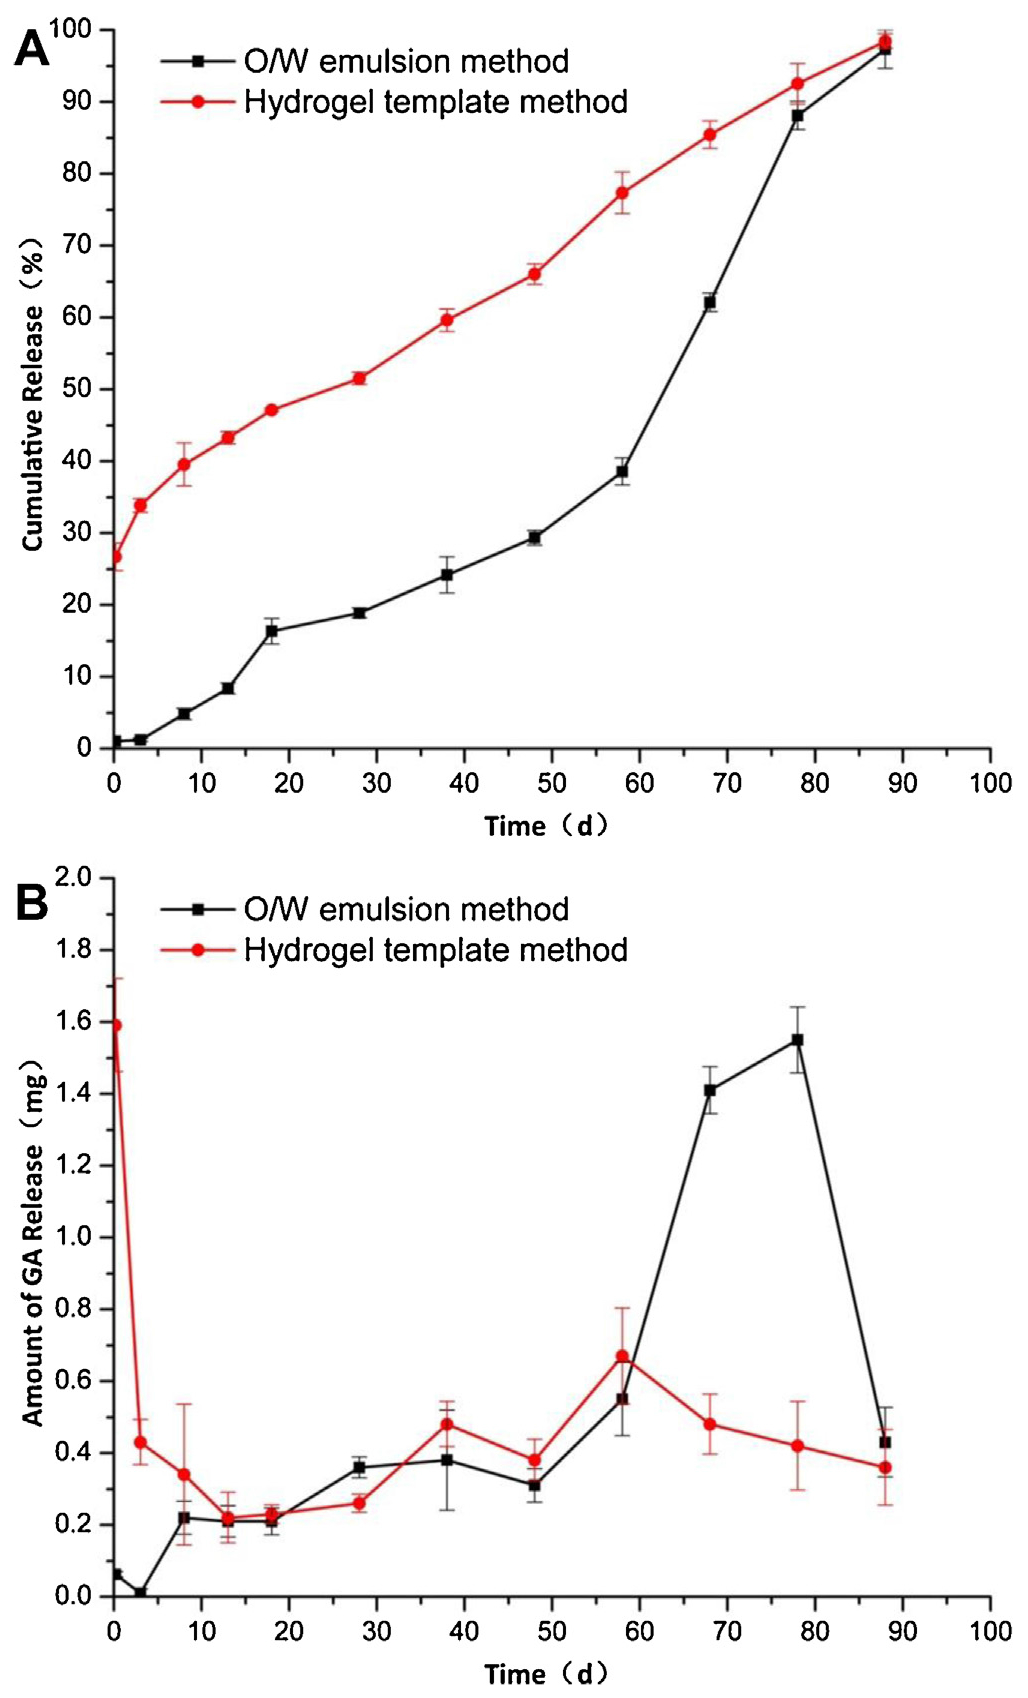
Cumulative (A) and amount (B) in vitro release profiles of GA-loaded microparticles prepared by O/W emulsion method and template method (mean ± SD, n = 3).
Drug release from PLGA microparticles usually follows 3 different stages consisting of an initial burst, a period with slow release, and finally an erosion-accelerated phase with rapid release (Wischke and Schwendeman, 2008). The presence of the triphasic stages, however, depends on the physicochemical properties of a drug, affecting the release kinetics and the PLGA degradation kinetics. The initial burst release is a result of the drug localized near the surface of the microparticles (Kim and Park, 2004). The absence of the initial burst release from the emulsion method microparticles is consistent with the loss of drugs that eventually formed dimples on the surface. On the other hand, the initial burst release from the template method microparticles indicates the presence of the drug near the surface.
3.5. Polymer degradation
To better understand the mechanisms for different release performance of microparticles by two methods, in vitro degradation observation of microparticles was performed. The morphological changes of microparticles and acidity changes of incubation medium were characterized by SEM and pH values at predetermined times.
The SEM images of microparticles are shown in Fig. 7. Fig. 7–A of the emulsion method microparticles shows the original dimples on the surface became deepened after immersed in aqueous medium for 7 days. The pores were getting larger and their underlying channels became deeper into the core during the following days, which make the microparticle a beehive-like sphere. The shape of the sphere was maintained until day 50. Then, its porous structure was destroyed with further degradation of the polymer and dissolution of the drug. The individual spheres became irregular clumps. Finally, at the end of the experiment, the remaining skeleton of matrix was collapsed and all microparticles were fused together to be a large clump (Fan et al., 2012).
Fig. 7.
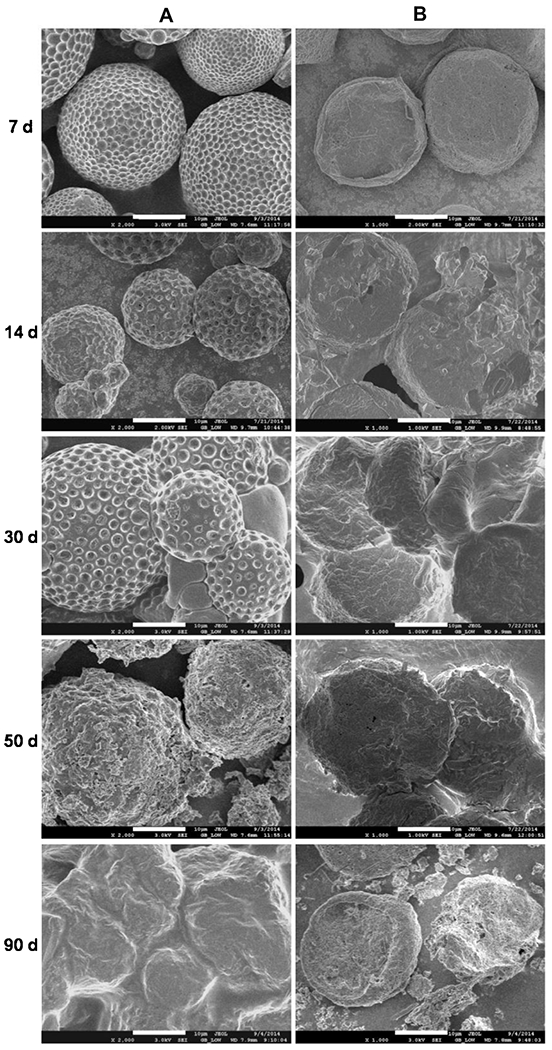
SEM images for morphological changes of GA-loaded microparticles prepared by O/W emulsion method (A) and template method (B) at different incubation times. Scale bar: 20 μm.
For the template method microparticles (Fig. 7–B), the obtained microparticles remained free of dimple-like porous structures over a period of 3 months. The surface of the microparticles was just gradually eroded and the microdiscs became thinner and thinner. The matrix was still retaining good dispersion state even at the final stage of the experiment. This may explain the stead-state release, after the initial burst release, during the entire 90 days.
It can be derived from these results that the primary mechanism of degradation for GA-PLGA microparticles are bulk erosion for the emulsion method and surface erosion for the template method (Ford Versypt et al., 2013). It is unexpected to see different degradation modes of microparticles made of the same polymer and the same drug, but prepared by different methods. Apparently, different methods resulted in different molecular packing of the polymer and the drug distribution.
The pH changes of the incubation medium are shown in Fig. 8. The pH profiles for both methods were comparable, decreasing slowly from 7.40 to around 6.70 over the whole period of 3 months. The pH decrease of the template method microparticles was faster during the first 30 days but slower since then, as compared with that of the emulsion method microparticles. As a result of low sample concentration in the medium (i.e., <1 mg/mL), the pH change of the medium was not significant as the microclimate pH distribution inside the microparticles reported by Liu et al. (2012). The overall similar pH changes in Fig. 8 indicate that the difference in the drug release profiles in Fig. 6 is not due to the differences in the PLGA degradation kinetics. Rather, it is due to the different polymer structures and drug distribution formed by different methods.
Fig. 8.
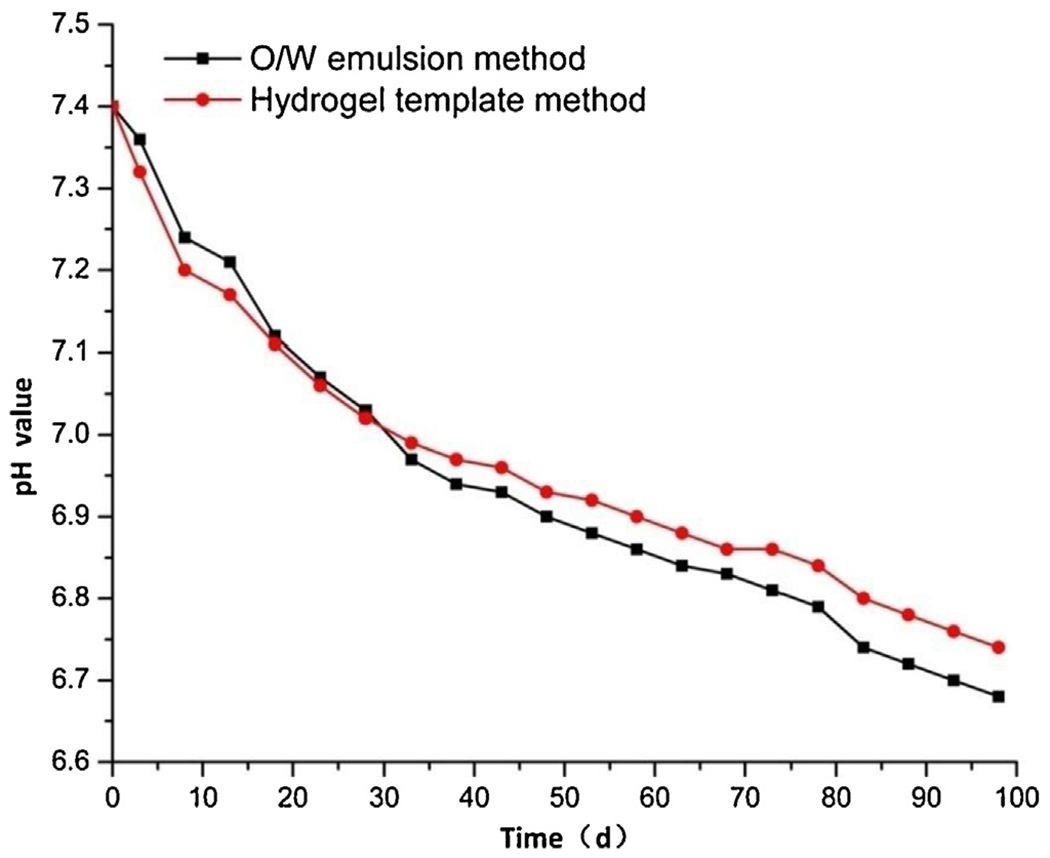
pH changes for release media of GA-loaded microparticles prepared by O/W emulsion method and template method.
As described in Figs. 6 and 7, both drug release and matrix erosion for the emulsion method microparticles exhibited a lag phase followed by steady-state release during the first month but an accelerated release after Day 50. The release profile of the template method microparticles indicates that the drug in the surface layer resulted in burst release in the beginning, and left many pores on the surface. The sponge-like surface enlarged the contact area of the polymer with aqueous medium, and facilitated the hydrolysis of PLGA and decreased the pH of the medium, which may further increase the erosion of the matrix (Liu et al., 2012). When the outer layers faded away, a more compact matrix was exposed and the erosion rate was slowed down, so that the drop in pH was alleviated accordingly. In brief, the performance for pH decline, drug release and matrix erosion of microparticles were relevant and interfered with each other.
4. Conclusion
In this study, GA-loaded PLGA microparticles were prepared by two different methods, a conventional O/W emulsion-solvent evaporation method and the template method. Comparative studies were conducted to examine morphology, drug loading, drug release, drug distribution, crystallinity, and polymer degradation. Although both types of microparticles exhibited excellent drug loading and encapsulation efficiency, their morphology and structure turned out to be quite different. As a result, big differences existed on their release patterns and degradation behavior. The results of this study provide a further understanding on the effects of process parameters on microparticle preparation, and a renewed strategy for tailoring drug release profiles in microparticles.
Acknowledgements
This work was supported by the National Natural Science Foundation of China (81360644), International Cooperation Project of Ningxia ([2013] NO.21), and the Showalter Research Trust Fund, and U.S. National Institute of Health (R01GM095879).
References
- Acharya G, Shin CS, McDermott M, Mishra H, Park H, Kwon IC, Park K, 2010a. The hydrogel template method for fabrication of homogeneous nano/microparticles. J. Control. Release 141, 314–319. [DOI] [PubMed] [Google Scholar]
- Acharya G, Shin CS, Vedantham K, McDermott M, Rish T, Hansen K, Fu Y, Park K, 2010b. A study of drug release from homogeneous PLGA microstructures. J. Control. Release 146, 201–206. [DOI] [PubMed] [Google Scholar]
- Anderson JM, Shive MS, 2012. Biodegradation and biocompatibility of PLA and PLGA microspheres. Adv. Drug Deliv. Rev 64, 72–82. [DOI] [PubMed] [Google Scholar]
- Bock N, Woodruff MA, Hutmacher DW, Dargaville TR, 2011. Electrospraying, a reproducible method for production of polymeric microspheres for biomedical applications. Polymers 3, 131–149. [Google Scholar]
- Bohr A, Kristensen J, Stride E, Dyas M, Edirisinghe M, 2011. Preparation of microspheres containing low solubility drug compound by electrohydrodynamic spraying. Int. J. Pharm 412, 59–67. [DOI] [PubMed] [Google Scholar]
- Bragagni M, Beneitez C, Martin C, Hernan Perez de la Ossa D, Mura PA, Gil-Alegre ME, 2013. Selection of PLA polymers for the development of injectable prilocaine controlled release microparticles: usefulness of thermal analysis. Int. J. Pharm 441, 468–475. [DOI] [PubMed] [Google Scholar]
- Elkharraz K, Ahmed AR, Dashevsky A, Bodmeier R, 2011. Encapsulation of water-soluble drugs by an o/o/o-solvent extraction microencapsulation method. Int. J. Pharm 409, 89–95. [DOI] [PubMed] [Google Scholar]
- Fan D, De Rosa E, Murphy MB, Peng Y, Smid CA, Chiappini C, Liu X, Simmons P, Weiner BK, Ferrari M, Tasciotti E, 2012. Mesoporous silicon-PLGA composite microspheres for the double controlled release of biomolecules for orthopedic tissue engineering. Adv. Funct. Mater 22, 282–293. [Google Scholar]
- Ford Versypt AN, Pack DW, Braatz RD, 2013. Mathematical modeling of drug delivery from autocatalytically degradable PLGA microspheres–a review. J. Control. Release 165, 29–37. [DOI] [PMC free article] [PubMed] [Google Scholar]
- Freitas S, Merkle HP, Gander B, 2005. Microencapsulation by solvent extraction/evaporation: reviewing the state of the art of microsphere preparation process technology. J. Control. Release 102, 313–332. [DOI] [PubMed] [Google Scholar]
- Gilchrist SE, Rickard DL, Letchford K, Needham D, Burt HM, 2012. Phase separation behavior of fusidic acid and rifampicin in PLGA microspheres. Mol. Pharm 9, 1489–1501. [DOI] [PubMed] [Google Scholar]
- Jain R, 2000. The manufacturing techniques of various drug loaded biodegradable poly(lactide-co-glycolide) (PLGA) devices. Biomaterials 21, 2475–2490. [DOI] [PubMed] [Google Scholar]
- Kim TH, Park TG, 2004. Critical effect of freezing/freeze-drying on sustained release of FITC-dextran encapsulated within PLGA microspheres. Int. J. Pharm 271, 207–214. [DOI] [PubMed] [Google Scholar]
- Kokai LE, Tan H, Jhunjhunwala S, Little SR, Frank JW, Marra KG, 2010. Protein bioactivity and polymer orientation is affected by stabilizer incorporation for double-walled microspheres. J. Control. Release 141, 168–176. [DOI] [PubMed] [Google Scholar]
- Liu Y, Ghassemi AH, Hennink WE, Schwendeman SP, 2012. The microclimate pH in poly(D,L-lactide-co-hydroxymethyl glycolide) microspheres during biodegradation. Biomaterials 33, 7584–7593. [DOI] [PMC free article] [PubMed] [Google Scholar]
- Lu Y, Sturek M, Park K, 2014. Microparticles produced by the hydrogel template method for sustained drug delivery. Int. J. Pharm 461, 258–269. [DOI] [PMC free article] [PubMed] [Google Scholar]
- Nath SD, Son S, Sadiasa A, Min YK, Lee BT, 2013. Preparation and characterization of PLGA microspheres by the electrospraying method for delivering simvastatin for bone regeneration. Int. J. Pharm 443, 87–94. [DOI] [PubMed] [Google Scholar]
- Pandita D, Kumar S, Lather V, 2015. Hybrid poly(lactic-co-glycolic acid) nanoparticles: design and delivery prospectives. Drug Discov. Today 20, 95–104. [DOI] [PubMed] [Google Scholar]
- Patel RS, Cho DY, Tian C, Chang A, Estrellas KM, Lavin D, Furtado S, Mathiowitz E, 2012. Doxycycline delivery from PLGA microspheres prepared by a modified solvent removal method. J. Microencapsul 29, 344–352. [DOI] [PubMed] [Google Scholar]
- Qi F, Wu J, Fan Q, He F, Tian G, Yang T, Ma G, Su Z, 2013. Preparation of uniform-sized exenatide-loaded PLGA microspheres as long-effective release system with high encapsulation efficiency and bio-stability. Colloids Surf. B Biointerfaces 112, 492–498. [DOI] [PubMed] [Google Scholar]
- Qi F, Wu J, Hao D, Yang T, Ren Y, Ma G, Su Z, 2014a. Comparative studies on the influences of primary emulsion preparation on properties of uniform-sized exenatide-loaded PLGA microspheres. Pharm. Res 31, 1566–1574. [DOI] [PubMed] [Google Scholar]
- Qi F, Wu J, Yang T, Ma G, Su Z, 2014b. Mechanistic studies for monodisperse exenatide-loaded PLGA microspheres prepared by different methods based on SPG membrane emulsification. Acta Biomater. 10, 4247–4256. [DOI] [PubMed] [Google Scholar]
- Sui X, Wei W, Yang L, Zu Y, Zhao C, Zhang L, Yang F, Zhang Z, 2012. Preparation, characterization and in vivo assessment of the bioavailability of glycyrrhizic acid microparticles by supercritical anti-solvent process. Int. J. Pharm 423, 471–479. [DOI] [PubMed] [Google Scholar]
- Tan EC, Lin R, Wang CH, 2005. Fabrication of double-walled microspheres for the sustained release of doxorubicin. J. Colloid Interface Sci 291, 135–143. [DOI] [PubMed] [Google Scholar]
- Tsai M, Lu Z, Wientjes MG, Au JL, 2013. Paclitaxel-loaded polymeric microparticles: quantitative relationships between in vitro drug release rate and in vivo pharmacodynamics. J. Control. Release 172, 737–744. [DOI] [PMC free article] [PubMed] [Google Scholar]
- Vladisavljević GT, Schubert H, 2003. Influence of process parameters on droplet size distribution in SPG membrane emulsification and stability of prepared emulsion droplets. J. Membr. Sci 225, 15–23. [Google Scholar]
- Wang LJ, Geng CA, Ma YB, Huang XY, Luo J, Chen H, Zhang XM, Chen JJ, 2012. Synthesis, biological evaluation and structure-activity relationships of glycyrrhetinic acid derivatives as novel anti-hepatitis B virus agents. Bioorg. Med. Chem. Lett 22, 3473–3479. [DOI] [PubMed] [Google Scholar]
- Wischke C, Schwendeman SP, 2008. Principles of encapsulating hydrophobic drugs in PLA/PLGA microparticles. Int. J. Pharm 364, 298–327. [DOI] [PubMed] [Google Scholar]
- Xiao CD, Shen XC, Tao L, 2013. Modified emulsion solvent evaporation method for fabricating core–shell microspheres. Int. J. Pharm 452, 227–232. [DOI] [PubMed] [Google Scholar]
- Ye M, Kim S, Park K, 2010. Issues in long-term protein delivery using biodegradable microparticles. J. Control. Release 146, 241–260. [DOI] [PubMed] [Google Scholar]
- Yeo Y, Park K, 2004. Control of encapsulation efficiency and initial burst in polymeric microparticle systems. Arch. Pharm. Res 27, 1–12. [DOI] [PubMed] [Google Scholar]
- Zhang Z, Bi X, Li H, Huang G, 2011. Enhanced targeting efficiency of PLGA microspheres loaded with Lornoxicam for intra-articular administration. Drug Deliv. 18, 536–544. [DOI] [PubMed] [Google Scholar]
- Zheng W, 2009. A water-in-oil-in-oil-in-water (W/O/O/W) method for producing drug-releasing, double-walled microspheres. Int. J. Pharm 374, 90–95. [DOI] [PubMed] [Google Scholar]


