

Abstract
Close coordination between chaperones is essential for protein biosynthesis, including the delivery of tail-anchored (TA) proteins containing a single C-terminal transmembrane domain to the endoplasmic reticulum (ER) by the conserved GET pathway. For successful targeting, nascent TA proteins must be promptly chaperoned and loaded onto the cytosolic ATPase Get3 through a transfer reaction involving the chaperone SGTA and the bridging factors Get4, Ubl4a, and Bag6. Here, we report cryo-EM structures of metazoan pre-targeting GET complexes at 3.3 Å to 3.6 Å. The structures reveal that Get3 helix 8 and the Get4 C-terminus form a composite lid over the Get3 substrate-binding chamber that is opened by SGTA. Another interaction with Get4 prevents formation of Get3 helix 4, which links the substrate chamber and ATPase domain. Both interactions facilitate TA protein transfer from SGTA to Get3. Our findings show how the pre-targeting complex primes Get3 for coordinated client loading and ER targeting.
A relatively small set of protein chaperones handle the complex biosynthetic requirements of a large and diverse proteome. Close cooperation between chaperones is essential to selectively triage nascent proteins to the appropriate biosynthetic program and avoid generating proteotoxic products1–3. A mechanistic understanding of how multiple chaperones coordinate their activities during protein biosynthesis requires structures of chaperone complexes in functional states. In the conserved guided entry of TA (GET) pathway, chaperones cooperate to target tail-anchored (TA) membrane proteins containing a single C-terminal hydrophobic transmembrane domain (TMD) to the endoplasmic reticulum (ER)4–6. ER-targeted TA proteins have diverse functions and include SNARE proteins required for vesicular trafficking, components of transport complexes, and factors required for lipid homeostasis. Because the ribosomal exit tunnel shields the C-terminal TMD required for ER delivery throughout TA protein synthesis, TA proteins cannot engage cotranslational ER targeting factors and must use posttranslational targeting mechanisms such as the GET pathway.
The GET pathway centers around the cytosolic TMD chaperone Get3 (also known as TRC40 or Asna1 in metazoans), a homodimeric ATPase6–8. ATP-bound Get3 assumes a closed conformation that has a hydrophobic TMD-binding groove and interacts with Get4 (also known as TRC35 in metazoans), a subunit of a ‘bridging’ complex that facilitates client loading onto Get36,7,9–16. In yeast, this bridging complex is a heterodimer of Get4 and Get5. In metazoans, the C-terminus of Bag6 is additionally required to link Get4 and the Get5 homolog, Ubl4a17–19. Ubl4a recruits SGTA (small glutamine-rich tetratricopeptide repeat protein alpha; Sgt2 in yeast), another dimeric TMD chaperone13,19,20. Unlike Get3, SGTA does not hydrolyze nucleotides and binds TA proteins rapidly and reversibly19,21. Thus, SGTA is well-suited to selectively capture newly-synthesized TA proteins and prevent their aggregation as they are delivered to Get3. Numerous genetic and biochemical studies indicate that TA protein transfer from SGTA to Get3 is important for accurate ER targeting6,13,14,17,19,21–23.
TA protein loading onto Get3 stimulates ATP hydrolysis and Get4 dissociation15,16,22,24, allowing Get3 to engage the ER-resident Get1-Get2 complex (WRB-CAML in metazoans)25–27. Current models suggest that Get2 recruits ADP-bound Get3-TA protein complexes via a cytosolic domain on a long linker. Subsequent Get1 binding to Get3 in the open conformation releases nucleotides and the TA protein for insertion into the lipid bilayer by the Get1-Get2 transmembrane assembly27–29. Finally, Get3 is recycled for another round of targeting by ATP binding, dissociation from Get1, and re-engagement of Get44,5,15. However, despite this general framework for TA protein targeting, molecular details of client transfer between GET chaperones remain unclear.
We previously reconstituted TA protein loading onto Get3 with purified factors to show that client transfer from SGTA to TRC40 is rapid and private, unable to be outcompeted by an unrelated TMD chaperone19,21. This mechanism minimizes off-target effects and is especially important in metazoans, because Bag6 also binds TMDs and engages ubiquitination-proteasome machinery to effect client protein degradation19,30,31. Compared to TA protein transfer from SGTA to Get3, Bag6 capture of TA proteins initially chaperoned by SGTA is slower and can be outcompeted19. These observations suggest that TA protein transfer from SGTA to Get3 may occur through a direct interaction rather than a free TA protein intermediate.
Currently, incomplete structures of metazoan GET pre-targeting complexes limit our understanding of TA protein loading onto Get3. Structures of yeast GET pre-targeting complexes do not show how Bag6 contributes to complex organization32, and available structures of Bag6 domains only show interactions with individual binding partners18,33. It is also not known how SGTA affects the complex. To address this, we investigated complexes of metazoan Get3 and the bridging factors without or with SGTA using single-particle cryogenic electron microscopy (cryo-EM). Reconstructions at 3.3 to 3.6 Å reveal how the metazoan complex is organized, the dynamic ‘lid’ over the Get3 substrate-binding chamber, previously unappreciated Get3-Get4 interactions that facilitate TA protein transfer, and how SGTA alters the complex. Our results provide molecular insights into the coordination and fidelity of TA protein loading onto Get3 for ER targeting.
Results
Structures of metazoan pre-targeting GET complexes
We purified recombinant complexes of metazoan ATP hydrolysis-deficient Get3(D68N) in complex with Get4, Ubl4a, and a C-terminal fragment of Bag6 (residues 1004–1132, referred to as cBag6) sufficient to form the functional bridging complex, without or with SGTA19 (Extended Data Fig. 1a and Supplementary Fig. 1). Get4, Ubl4a, cBag6, and SGTA are of human sequence, and Get3(D68N) is of zebrafish sequence (Supplementary Figs. 1–3). D. rerio Get3 is 94% identical to human Get3 and is commonly used to reconstitute TA protein targeting in metazoan systems17,19 (Extended Data Fig. 1b). We determined the structure of the ‘cBUGG’ (cBag6-Ubl4a-Get4-Get3) complex with ATP to an overall resolution of 3.4 Å (Table 1, Extended Data Fig. 2, Supplementary Fig. 4, and Movie S1), which revealed a symmetrical architecture comprising a Get3(D68N) dimer flanked by two bridging ‘arms’ (Fig. 1a,b). Applying two-fold symmetry and focused classification revealed two cBUGG conformations (referred to as cBUGG-in and cBUGG-out) with slightly different placements of the bridging arms relative to Get3 (Table 1, Extended Data Fig. 2, Supplementary Fig. 4, and Movie S2). We also determined the structure of the ‘cBUGGS’ complex with SGTA to an overall resolution of 3.6 Å (Fig. 1c, Table 1, Extended Data Fig. 2, Supplementary Fig. 5, and Movie S3). Compared to cBUGG, cBUGGS has an asymmetric density extending from one bridging arm towards the top of the Get3 substrate chamber. The resolutions of the Coulomb potential maps allowed us to build atomic models for the majority of Get3(D68N) and Get4, and to fit in portions of cBag6 and Ubl4a18,33 (Fig. 1c, Table 1, and Extended Data Figs. 2–3).
Table 1.
Cryo-EM data collection, refinement and validation statistics
| cBUGG (C1) (EMDB-24703) | cBUGG-in (EMDB-24700) (PDB 7RU9) | cBUGG-out (EMDB-24701) (PDB 7RUA) | cBUGGS (EMDB-24702) (PDB 7RUC) | cBUGGS (masked) (EMDB-24704) | |
|---|---|---|---|---|---|
|
| |||||
| Data collection and processing | |||||
| Magnification | 105,000 | 105,000 | |||
| Voltage (kV) | 300 | 300 | |||
| Electron exposure (e–/Å2) | 54 | 54 | |||
| Defocus range (μm) | -1.4 to -2.6 | -1.4 to -2.6 | |||
| Pixel size (Å) | 0.825 | 0.825 | |||
| Symmetry imposed | C1 | C2 | C2 | C1 | |
| Initial particle images (no.) | 2,981,740 | 2,844,806 | |||
| Final particle images (no.) | 388,455 | 28,439 | 35,535 | 56,845 | 71,159 |
| Map resolution (Å) | 3.4 | 3.3 | 3.4 | 3.6 | 4.1 |
| FSC threshold | 0.143 | 0.143 | 0.143 | 0.143 | 0.143 |
| Map resolution range (Å) | 3.2–7.1 | 3.1–6.2 | 3.2–6.6 | 3.3–10.8 | 3.7–11 |
| Refinement | |||||
| Initial model used (PDB code) | - | 3IQW, 6AU8, 4WWR | cBUGG-in | cBUGG-in | - |
| Model resolution (Å) | - | 3.7 | 3.7 | 3.8 | - |
| FSC threshold | - | 0.5 | 0.5 | 0.5 | - |
| Model resolution range (Å) | - | 33–3.7 | 33–3.7 | 33–3.8 | - |
| Map sharpening B factor (Å2) | - | -45.1 | -54.2 | -60.9 | - |
| Model composition | |||||
| Non-hydrogen atoms | - | 11,595 | 11,603 | 10,766 | |
| Protein residues | - | 1,448 | 1,448 | 1,344 | |
| Ligands | - | 1 Zn2+, 2 Mg2+, 2 ATP | 1 Zn2+, 2 Mg2+, 2 ATP | 1 Zn2+, 2 Mg2+, 2 ATP | |
| B factors (Å2) | |||||
| Protein | - | 116 | 127 | 164 | - |
| Ligand | - | 67 | 76 | 105 | - |
| R.m.s. deviations | |||||
| Bond lengths (Å) | - | 0.003 | 0.003 | 0.004 | - |
| Bond angles (°) | - | 0.592 | 0.566 | 0.533 | - |
| Validation | |||||
| MolProbity score | - | 1.56 | 1.45 | 1.73 | - |
| Clashscore | - | 7.18 | 7.22 | 7.36 | - |
| Poor rotamers (%) | - | 0 | 0 | 0 | - |
| Ramachandran plot | |||||
| Favored (%) | - | 97 | 97.8 | 95.4 | - |
| Allowed (%) | - | 3 | 2.2 | 4.6 | - |
| Disallowed (%) | - | 0 | 0 | 0 | - |
Fig. 1. Cryo-EM structures of pre-targeting metazoan GET complexes.
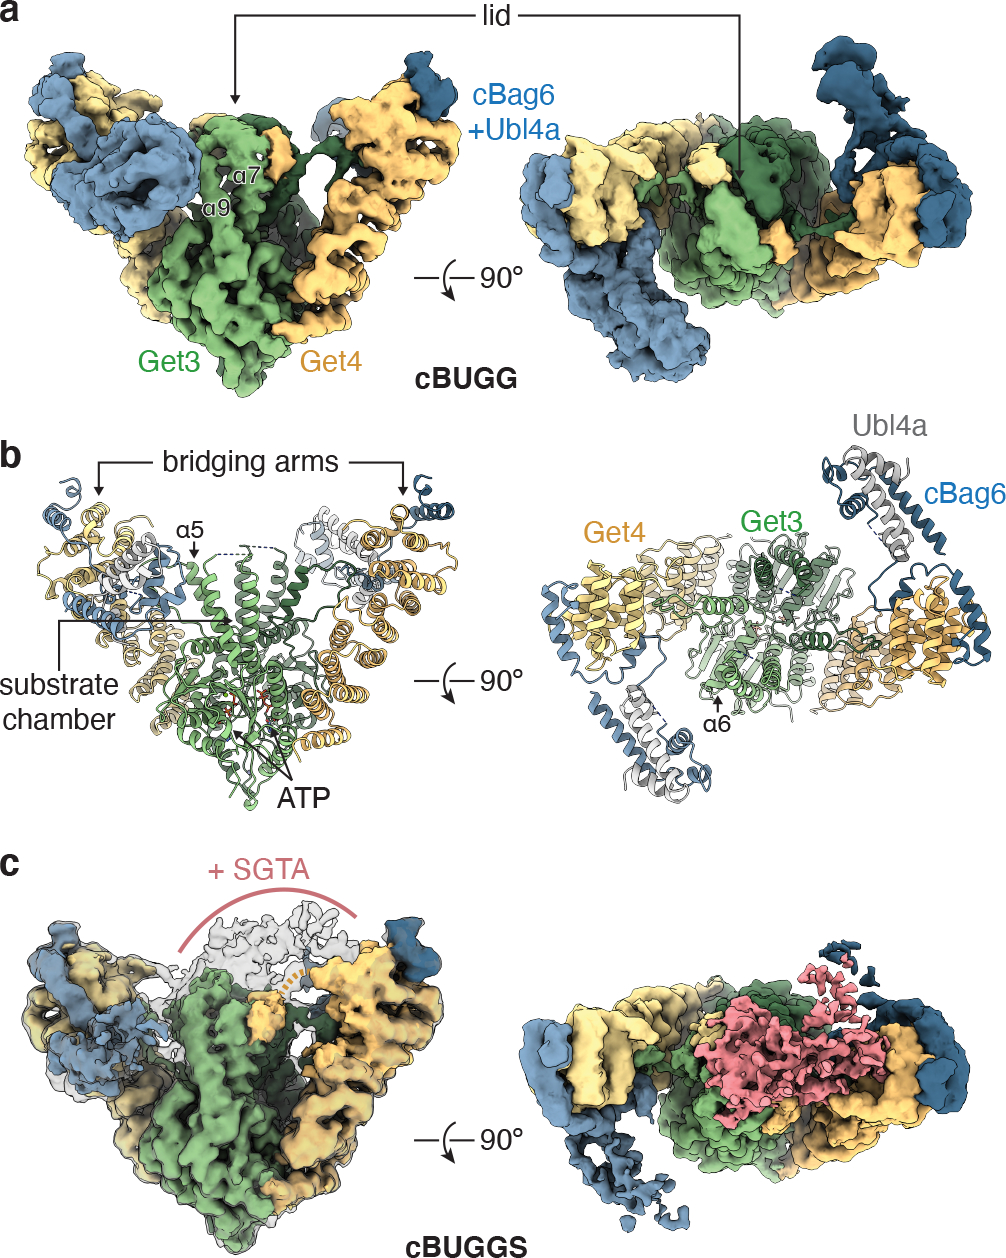
a, Front (left) and top (right) view of the cryo-EM map of cBUGG [cBag6-Ubl4a-Get4-Get3(D68N)] at 8.1σ contour level colored according to the indicated polypeptides. b, Atomic model of cBUGG-out. c, Cryo-EM map of cBUGGS at 5.8σ contour level colored as in panel a, or at 5σ contour level in transparent outline (left). Unassigned segments absent in cBUGG maps are shown in pink (right). Light orange dashed line, proposed continuity of unmodeled Get4 C-terminal region.
The Get3 dimer is in the closed conformation in all reconstructions, generating a large hydrophobic substrate-binding chamber above the ATPase domain10 (Fig. 2a and Extended Data Fig. 4a–c). As previously described10–12, the ‘floor’ of the chamber is formed by α6 of each Get3 subunit, and α5, α7, and α9 line the sides of the chamber. The conformations of these chamber ‘wall’ helices are the most variable parts of Get3 compared to crystal structures of yeast Get3 (Extended Data Fig. 4a–c). In addition, the top of the Get3 substrate chamber is completely covered by a lid that has not been visualized previously (Figs. 1a and 2a; discussed below). Below the substrate chamber, the ATP binding sites were well-resolved (Extended Data Fig. 4d) and highly similar between the three models (RMSD of ~0.2 Å). Get3 motifs involved in ATP binding and hydrolysis closely align with closed yeast Get3 structures9,10,32 (Extended Data Fig. 4e; RMSD ranges of 0.6–0.9 Å). The A-loop, which facilitates nucleotide binding, resembles substrate-bound yeast Get3 and is shifted ~2 Å from the position seen in other yeast Get3 structures.
Fig. 2. Get4 primes Get3 for TA protein loading.

a, Clipped view of the sharpened cBUGG-in map (at 9.5σ contour level) showing the interior of the Get3 substrate chamber. Get3 helices (numbered) lining the chamber and putative Get3 (green) and Get4 (yellow) lid (L) helices are indicated. Green arrows, Get3 L(α4) interaction with Get4. b, Get3 model showing how L(α4) connects helices (α5, α6) lining the substrate chamber with β3 in the ATPase domain (green). The Switch I loop is purple; the other Get3 subunit is light gray. c, Segmented cBUGG-in map and model of Get3 L(α4). d, The Get3 L(α4) (green) and Get4 (light orange) interaction site. e, Surface electrostatics of the regions boxed in panel d.
The main interaction site between Get3 and Get4, involving a negative surface at the base of the Get3 dimer and basic residues in N-terminal Get4 helices, is conserved32 (Extended Data Fig. 5a,b). In the metazoan pre-targeting GET complex, this interface buries a surface area of ~2200 Å2, compared to ~1400 Å2 in the yeast complex32. Comparing cBUGG-in and cBUGG-out revealed that the bridging arms are well-aligned at the N-terminal Get3 interaction but begin to deviate at Get4 α6 in the angle they extend away from Get3 by ~2.5° (Extended Data Fig. 5c). This difference translates to a ~2 Å shift in distal features of the bridging arms. The bridging complexes of cBUGGS and of yeast Get3-Get4-Get532 resemble the wider cBUGG-out conformation (Extended Data Fig. 5a). The two cBUGG conformations and the decreased local resolution at the distal ends of the bridging arms (Extended Data Fig. 2c) suggest that the bridging complexes are conformationally heterogeneous34, which may help relay changes to Get3 upon SGTA engagement that facilitate TA protein loading.
Get4 prevents formation of Get3 α4
In addition to the primary Get3-Get4 interaction, our cryo-EM structures revealed two secondary interactions between metazoan Get3 and Get4 that have not been described. One interaction involves a Get3 loop [referred to as L(α4)] that connects the ATPase domain and the substrate chamber. L(α4) extends from a β-strand adjacent to the ATP-binding site below the substrate chamber to α5 at the top of the substrate chamber (Fig. 2b and Extended Data Fig. 5a). The sidechains of consecutive phenylalanines (Phe112 and Phe113) in L(α4) permitted modeling of the interaction site (Fig. 2c,d), which contributes a buried surface area of ~1350 Å2 and was observed in both cBUGG conformations and in cBUGGS (Extended Data Fig. 2c).
L(α4) is predicted to form a helix (α4) and is enriched in acidic amino acids conserved in metazoan Get3 (Supplementary Fig. 3). In structures of yeast Get3 in the closed conformation, α4 lines the substrate-binding chamber9,10,32 (Extended Data Fig. 4a–c). Compared to these structures, α5 of metazoan Get3 in cBUGG extends further up the substrate chamber while L(α4) travels along the axis of yeast α4. A charge-driven interaction network involving 1) the acidic residues and the backbone of Phe112 of Get3 L(α4), 2) Arg278 in α14 and Lys139 in the α6-α7 loop of Get4, and 3) a basic patch in cBag6 (Fig. 2d,e) may keep metazoan Get3 L(α4) in an extended conformation in the pre-targeting complexes.
Get4 interacts primarily with one Get3 subunit via its N-terminus and with L(α4) of the other Get3 subunit further down the bridging arm (Extended Data Fig. 5d). This organization may help coordinate conformational changes between the bridging factors and the Get3 dimer. The β-strand preceding L(α4) pairs with the strand leading to the Switch I loop required for ATP hydrolysis (Fig. 2b). In addition, L(α4) is optimally placed to sense the occupancy of the substrate chamber, and conformational changes of L(α4), such as folding into a helix, would directly modify characteristics of the chamber. Thus, L(α4) movement or folding into a helix may result from or regulate ATP hydrolysis, TA protein loading, and Get4 dissociation.
A composite lid covers the Get3 substrate chamber
Another Get4-Get3 interaction may contribute to the lid over the Get3 substrate chamber in cBUGG. This lid has not been observed in crystal structures, presumably because Get3 α8 implicated in shielding the substrate binding site is assumed to be dynamic10,21. In our cryo-EM reconstructions, the lid, which appears to be mostly helical, extends from α7 of one Get3 subunit all the way across the substrate chamber and travels down along α7 of the opposite Get3 subunit (Fig. 3a). These characteristics were not an artefact of imposing symmetry during data processing, as a map of cBUGG without symmetry imposed showed a similar lid (Extended Data Fig. 6a). Although the resolution of this area did not permit accurate modeling, several considerations suggest that the lid comprises not only Get3 α8, but also the C-terminus of Get4 (Fig. 3a).
Fig. 3. A composite lid covers the Get3 substrate chamber.

a, Lid region above the Get3 substrate chamber of the unsharpened cBUGG-out map (gray; at 8.9σ contour level) and model (colored). Dotted lines indicate proposed continuity of unmodeled regions of Get3 and Get4. b, Superposition of cBUGG-out (colored) with a crystal structure of human Get4 and a cBag6 fragment (gray; PDB 6AU8). Residues C-terminal of Pro288 modeled in the crystal structure are shown in mauve and would clash with Get3 L(α4). Arrow, proposed movement of mauve domain when Get4 engages Get3 L(α4). c, Helical wheel representation of predicted Get3 α8 and Get4 α15 sequences. Hydrophobic amino acids are orange.
First, 18 unmodeled Get3 residues presumably extend from α7 to contribute to the lid as α8 and must loop back to α9 (Extended Data Fig. 6b). However, a helix of 18 residues is insufficient to span the ~30 Å across the substrate chamber, without accounting for the ~20 Å needed to connect back to α9 or the extension needed to make the interactions with α7 of the other Get3 subunit (Extended Data Fig. 6c). Thus, populating the entire lid with only Get3 α8 is unlikely. Instead, a break in the helical shape approximately 2/3 along the length of the lid may correspond to the point where Get3 loops back to α9. Such a model would be physically possible and consistent with secondary structure predictions (Extended Data Fig. 6a–c).
Second, in the EM maps, the unmodeled C-terminus of Get4 extends towards the Get3 substrate chamber (Fig. 3a and Extended Data Fig. 2c). These 39 amino acids following Pro288 are more than sufficient to reach the lid and form a helix to accommodate the lid density past the helical break that travels down α7 of the proximal Get3 subunit (Extended Data Fig. 6b,d). Specifically, a predicted C-terminal Get4 helix (α15) comprising the conserved residues 297–308 may contribute to the lid. In this scenario, the 8 amino acids between Pro288 and α15 would be sufficient to span the ~20 Å between these elements. In a crystal structure of Get4, a portion of Get4 α15 interacts with α1433. Aligning this structure with cBUGG showed that Get3 L(α4) clashes with the unassembled Get4 α15-α14 interaction (Fig. 3b). Because Get4 α15 cannot occupy the same site in cBUGG(S), we propose that it is displaced to help cover the Get3 substrate chamber.
Both Get3 α8 and Get4 α15 would form amphipathic helices34,35 (Fig. 3c), compatible with a function of lining the hydrophobic substrate chamber. In crystal structures of Get4 homologs, α15 also has been observed to interact in trans with other Get4 molecules34,35, which may indicate a dynamic interaction interface. The metazoan-specific C-terminus of Get4 following α15 is enriched with acidic residues (Extended Data Fig. 6b) that may compete with Get3 L(α4) for the basic binding site next to Get4 α14 (Figs. 2e and 3b). When associated with Get3, the displaced acidic Get4 C-terminus may interact with a basic patch on Get3 α7 generated by Arg183 and Arg179 to help position the Get4 lid helix (Extended Data Fig. 6e). These observations suggest that Get3 α8 and the Get4 C-terminus cooperate to form the lid over the Get3 substrate chamber in the pre-targeting GET complex.
Secondary Get3-Get4 interactions mediate TA protein transfer
Disrupting the metazoan Get3-Get4 interactions identified above impairs TA protein transfer from SGTA to Get3 without affecting stable association between Get3 and Get4 (Fig. 4a–c). To demonstrate this, we synthesized a radiolabeled TA protein containing the VAMP2 TMD in complex with SGTA using the PURE system19, and used chemical crosslinking and immunoprecipitations to assay TA protein release from SGTA in the presence of Get3 and the bridging complex (Fig. 4c, Extended Data Fig. 6f, and Supplementary Discussion). While incubating SGTA-TA protein complexes with Get3 alone did not result in appreciable TA protein release from SGTA or transfer to Get3 (Fig. 4c, lane 2), adding wildtype cBUG resulted in complete release of TA protein from SGTA and a crosslink to Get3 (lane 3). As previously noted36, we also observed TA protein crosslinks to Get4, which likely reflects the proximity of these factors in the pre-targeting complex.
Fig. 4. Secondary Get3-Get4 interactions mediate TA protein transfer.

a, Summary (left) and locations (right) of mutations analyzed for Get3-Get4 interaction and TA protein transfer from SGTA to Get3. ΔC, deletion of 34 amino acids from the Get4 C-terminus; RK-DD, R25D/K29D Get4; KAAKKK, mutation of residues 111–116 of Get3 from EFFEED to KAAKKK. b, SDS-PAGE and Coomassie staining, representative of 3 independent experiments, of the indicated Get3 and GST-tagged Get4 variants before (input) and after GST pulldowns. c, Crosslinking (XL) of radiolabeled TA protein transfer reactions from SGTA (x SGTA) to Get3 variants without or with the indicated cBUG complexes assayed by SDS-PAGE and autoradiography, representative of 2 independent experiments. IPs, immunoprecipitations for TA crosslinks to SGTA. tot., TA signal in uncrosslinked samples; bottom panel, Coomassie staining of uncrosslinked samples.
Removing 34 amino acids from the C-terminus of Get4 impaired TA protein transfer (Fig. 4c, lane 5) to a similar extent as a Get4(R25D/K29D) mutant19,32 (Fig. 4c, lane 7) that does not stably bind Get3 (Fig. 4b). Similarly, mutating the Get3 L(α4) residues 111–116 from EFFEED to KAAKKK disrupted TA protein transfer from SGTA to Get3 (Fig. 4c, lane 12) without impairing Get3-Get4 binding (Fig. 4b). A helix-disrupting E114P mutation in Get3 (lane 13) or a R278E mutation in Get4 at the Get3 L(α4) interaction site (lane 4) did not affect TA protein transfer, suggesting that single point mutations may not be sufficient to disrupt the composite interaction interface (Fig. 2e). The defect in TA protein transfer from SGTA to Get3(KAAKKK) was not due to impaired TA protein binding, as adding Get3(KAAKKK) directly to PURE translation reactions resulted in a similar amount of TA protein capture as wildtype Get3 (Extended Data Fig. 6f,g). Thus, both secondary metazoan Get3-Get4 interactions facilitate TA protein transfer from SGTA to Get3.
Bag6 positions Ubl4a on an accessible platform
Our structures reveal for the first time the organization of Ubl4a, cBag6, and Get4 in the pre-targeting GET complex. Previously, two separate crystal structures showed how non-overlapping segments of Bag6 interact with Get433 or a C-terminal domain of Ubl4a18, respectively. However, the arrangement of these factors in the context of the entire complex was not known. In the cBUGG structures, the globular Ubl4a-Bag6 interaction domain, which we refer to as the ‘recruitment platform’, juts away from Get4 at a ~125° angle (Figs. 1c and 5a). This architecture positions the recruitment platform on a plane roughly perpendicular to the Get4 arm and slightly above the Get3 substrate chamber (Fig. 5a).
Fig. 5. SGTA remodels one bridging complex and the substrate chamber lid.

a, cBUGG-in model showing cBag6 interactions and position of the cBag6-Ubl4a dimerization domain (SGTA recruitment platform). b, An unsharpened cBUGGS map produced from a refinement with a mask over Get3 and the SGTA-altered bridging arm at 4.5σ contour level (gray) with atomic model (colored; left) or at 9.5σ contour level (right). Get3 (green), Get4 (light orange), and cBag6 (blue) helices are numbered. L, C-terminal Get4 contribution to substrate chamber lid; D1 and D2, regions specific to cBUGGS. Green arrow, Get3 L(α4)-Get4 interaction; light orange arrow and dotted line, Get4 C-terminus lid connection; pink arrow and dotted line, interaction and connectivity between Get4 α13 and cBUGGS-specific regions.
Consistent with the crystal structure33, the N-terminal portion of cBag6 contributes a helix (α2) that packs against Get4 α12 and α13, and then loops back down Get4 to a short α3 packed against Get4 α8-α10. Our cryo-EM structures additionally show that cBag6 α3 approaches the Get4-Get3 L(α4) interaction, but instead makes a 180° turn via Gly1045 and Pro1047 (Fig. 5a and Extended Data Fig. 7a). The subsequent basic segment of cBag6 leading towards the recruitment platform may contribute to the Get3 L(α4) interaction (Fig. 2e and Supplementary Fig. 1). At the recruitment platform, density likely corresponding to the C-terminus of Bag6 packs against cBag6 α6 (Extended Data Fig. 7b). The recruitment platform also may be stabilized by interactions between the loop following cBag6 α6 and the Get4 α9-α10 loop, and between the Ubl4a α2-α3 loop and the cBag6 α2-α3 loop (Extended Data Fig. 7b). These interactions may position the platform to maximize Ubl4a accessibility for SGTA recruitment.
SGTA remodels a bridging arm and the substrate chamber lid
The cBUGGS map indicates that SGTA binding selectively remodels one recruitment platform and the lid over the Get3 substrate chamber (Fig. 1c). To further investigate this asymmetric density, we analyzed a map produced from a masked refinement focused on Get3 and the altered bridging arm (Fig. 5b, Table 1, Extended Data Fig. 7c, and Supplementary Fig. 5). This map revealed two seemingly globular domains (referred to as D1 and D2) specific to cBUGGS that extend from the distal end of the bridging arm to the top of the Get3 substrate chamber (Fig. 5b and Extended Data 7c,d). Although we could not unambiguously assign the domains, we observed two distinct interactions.
First, D1 extending from the bridging arm appears to interact with Get4 α13 before transitioning into D2 (Fig. 5b). It is possible that D1 results from the recruiting platform being pulled towards the distal end of the bridging arm (Extended Data Fig. 7d). If so, this rearrangement may involve movement of the cBag6 α3-α4 linker, as the interactions between cBag6 α1-α3 and Get4 remain clearly resolved. Second, D2 crosses over the top of the substrate chamber to interact with the opposite Get3 subunit near the top of α7 (Fig. 5b and Extended Data Fig. 7c). This interaction accompanies opening or disordering of the substrate chamber lid below D1 and D2 (Extended Data Fig. 7e). Thus, opening the lid of the substrate chamber may resemble pulling apart the flaps of a box at the ‘seam’ where Get3 α8 meets Get4 α15 (Fig. 3a and Extended Data Fig. 6a–d), a transition possibly facilitated by the straightening of Get3 α7 and α8 into a continuous helix27,37. These structures suggest that SGTA binding induces conformational changes that directly alter the Get3 substrate chamber.
Site-specific crosslinking validation of interactions
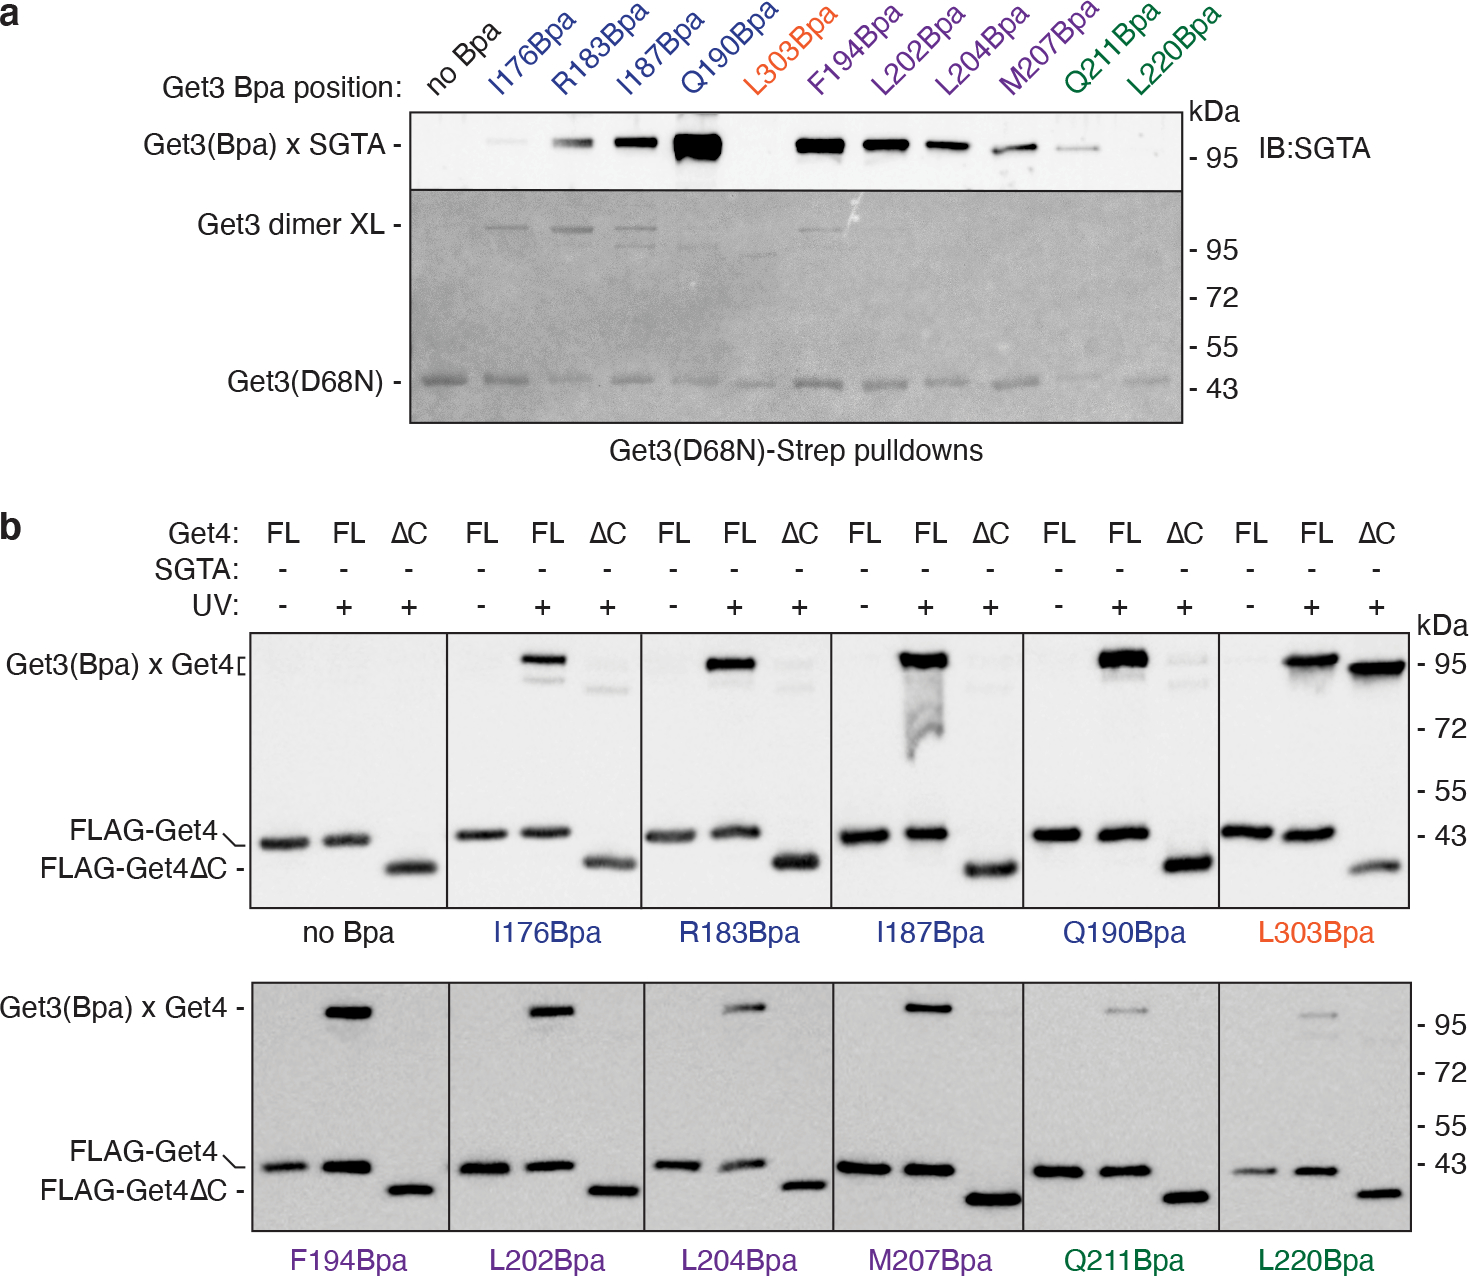
To directly probe the interactions between Get3 and SGTA or Get4, we incorporated the site-specific UV-activated crosslinker p-benzoylphenylalanine (Bpa) at various positions along α7-α9 of recombinant Get3 using amber stop codon suppression (Fig. 6a). These positions line the Get3 chamber and include unmodeled portions of α8. As a control, we incorporated Bpa in place of Leu303 in Get3 α11 at the main Get4 interaction interface. We assayed for UV-dependent crosslinks between each Get3(Bpa) to full-length Get4, to Get4(ΔC) lacking the putative lid domain, and to SGTA in the presence of cBUG (Fig. 6b), and validated crosslinks to specific factors using denaturing pulldowns and immunoblotting (Fig. 6a and Extended Data Fig. 8).
Fig. 6. Validation of the metazoan pre-targeting GET complex architecture.

a, cBUGG-in map and Get3 model showing positions of Bpa incorporated into Get3 colored according to location (top; green, α7; blue, α9; purple, unmodeled residues between α7 and α9) or the strength of crosslinking to the indicated factors as assayed by Get3 pulldowns and immunoblotting (bottom three panels). b, SDS-PAGE and Coomassie staining of UV-activated crosslinking reactions of Get3 with Bpa incorporated at the indicated positions without or with cBUG and SGTA, representative of 2 independent experiments. Green arrows, UV-specific crosslinks to Get4 and/or SGTA. c, Representative 2D class averages of the BUGGS complex isolated with full-length Bag6 protein.
As expected, crosslinked adducts required UV irradiation and Bpa incorporation (Fig. 6b). For most of the Bpa positions along α7 (residues 176, 183, 187, and 190) and the first half of the unmodeled portion corresponding to α8 (residues 194 and 202), the most prominent crosslink corresponds to a Get3-Get3 dimer adduct. This result is consistent with the proximity of α7 to α5 of the opposite Get3 subunit (Fig. 1b), and with the side-by-side arrangement of the lid over the Get3 substrate chamber (Fig. 3a). In contrast, the Get3 dimer crosslink was less prominent or nonexistent for Bpa located at residue 303, in α9 (residues 211 and 220), and at positions corresponding to the α8-α9 linker (residues 204 and 207) that are not adjacent to the other Get3 subunit. Thus, site-specific photocrosslinking validates spatial proximity based on high-resolution structural information.
In addition to the Get3 dimer adduct, Get3(Bpa) crosslinks were visible at a size range consistent with Get3 adducts to Get4 and/or SGTA (Fig. 6b, arrows). No UV-dependent crosslinks were visible at sizes consistent with adducts to cBag6 or Ubl4a. Analysis of Get3(Bpa) crosslinks to SGTA by immunoblotting revealed that Gln190 at the top of α7 produced the strongest crosslink (Fig. 6a and Extended Data Fig. 8a). We also observed SGTA crosslinks with Bpa positioned in the putative Get3 lid and at other positions in α7. The intensity of SGTA crosslinks tapered off with Bpa positions further down α7, closer to the ATPase domain. Only weak crosslinking to SGTA was observed with Bpa at residue 211 located at the top of α9, and no crosslinks were observed with Bpa at residue 220 further down α9 or at residue 303 at the main Get4 interaction interface. These results indicate that SGTA interacts with the top of the Get3 substrate chamber via contacts that closely match the placement of the D2 domain in the cBUGGS map (Fig. 5b).
Finally, Bpa at all analyzed positions crosslinked to full-length Get4, with the weakest signal coming from residues in α9 (Fig. 6a and Extended Data Fig. 8b). However, when assembled with Get4(ΔC), Get3(Bpa) crosslinks to Get4 disappeared at every position except for residue 303 located at the main Get4 interaction interface. This observation is consistent with the stable interaction between Get4(ΔC) and Get3 (Fig. 4b), and a model in which the C-terminal portion of Get4 contributes to the lid over the Get3 substrate chamber primarily through interactions with α7 and α8 (Fig. 3a). These site-specific crosslinking data support the interactions suggested by the cryo-EM maps of the Get3 substrate chamber with the unmodeled C-terminus of Get4 (Fig. 3) and with SGTA (Fig. 5b).
GET complex architecture is conserved with full-length Bag6
A Get3 dimer has two Get4 binding sites, but only one bridging arm is needed to recruit SGTA. Indeed, if the additional density observed in cBUGGS extended from both bridging arms, the two D2 domains would clash. Metazoan Ubl4a also lacks a dimerization domain present in yeast Get534, yet we observe that both Get4 binding sites on the Get3 dimer are occupied (Fig. 1). In addition, multiple 2D and 3D classification steps did not reveal distinct classes of the complexes without two copies of the bridging factors (Extended Data Fig. 2 and Supplementary Figs. 4–5). Multi-angle light scattering coupled with size exclusion chromatography (SEC-MALS) also estimates that cBUGG is 204.6 kDa, which closely matches the Get3 dimer (79.5 kDa) and two cBUG (cBag6, Ubl4a, Get4) complexes (70.2 kDa) seen in the cBUGG structures. cBUGGS is estimated to be 302.5 kDa, which is most consistent with the addition of a single SGTA dimer (Extended Data Fig. 9a).
To ensure that isolating cBUGGS via Get4 tagged with GST, which may independently dimerize, does not bias complex formation, we replaced GST with a tandem Flag tag that does not self-associate. Purification of cBUGGS via Flag-tagged Get4 in the presence of excess Get3 revealed the same two-armed configuration (Extended Data Fig. 9b,c). Finally, we assembled the ‘BUGGS’ complex with full-length Bag6 (Extended Data Fig. 9d). 2D class averages revealed a similar two-armed structure in the most abundant classes (Fig. 6c). The rest of the Bag6 protein was not easily identified, presumably because the 900+ amino acids separating the C-terminal scaffolding domain from the N-terminal Ubl domain are predicted to be largely disordered38,39 (Supplementary Fig. 1). Because we purified BUGGS via Bag6, we conclude that the two-armed structure can form with the entire Bag6 protein and is not specific to the isolated C-terminal domain. These results suggest that two bridging arms may be the preferred configuration of the pre-targeting GET complex, but only one functions to recruit SGTA for TA protein transfer.
Discussion
Our structures of metazoan pre-targeting GET complexes reveal two previously unknown interactions between Get3 and Get4 that may coordinate TA protein transfer and ER targeting. These interactions may form through a sequential docking mechanism, where Get4 first engages the largest and most exposed binding interface at the base of the Get3 dimer interface (Extended Data Fig. 5). This primary interaction may then promote the interaction between Get3 L(α4) and Get4 halfway up the bridging arm (Fig. 2), which may unfold Get3 α4, alter the Get3 substrate chamber, and possibly regulate Get3 ATP hydrolysis. The Get4-Get3 L(α4) interaction also may displace the Get4 C-terminus at the distal end of the bridging arm to help form the lid over the Get3 substrate binding chamber (Fig. 3b). Altogether, these interactions may prime Get3 for TA protein loading by 1) coupling Get4 to L(α4) connecting the Get3 substrate chamber and ATPase domain, and 2) coordinating access to the substrate chamber with a Get4-dependent lid.
Both Get3-Get4 interactions identified in this study are strategically positioned to sense and regulate the status of the substrate chamber and may contribute to the functional coupling of TA protein loading with Get3 ATP hydrolysis and/or Get4 dissociation4,15,16,21. One Get4 molecule may directly regulate both Get3 molecules through its interactions with the base of one Get3 subunit and with L(α4) of the other Get3 subunit (Extended Data Fig. 5d). In addition, the Get4 lid contacts both Get3 subunits. The sequences of the interaction elements identified in this study, particularly of Get3 α4 and the C-terminus of Get4 following α15, are among the most divergent between yeast and metazoan Get3 and Get4 (Supplementary Figs. 2–3). Thus, some regulatory mechanisms may be enhanced in metazoans, possibly to help accommodate the higher biosynthetic and quality control burdens of an expanded repertoire of membrane proteins.
Although two bridging complexes can bind a Get3 dimer, SGTA specifically alters only one bridging arm (Fig. 1c), resulting in interactions with the Get3 substrate chamber incompatible with engagement of both recruitment platforms (Fig. 5a). The presence of two bridging arms with accessible recruitment platforms may maximize opportunities to engage SGTA-client complexes. Interactions between Get3 and Get4 on both sides of the dimer also may be important to fully prime the Get3 dimer for TA protein loading. In addition, while the cBUGGS map showed that SGTA binding disrupts the lid of the Get3 substrate chamber, the interactions between Get3 and Get4 are maintained, including the putative Get4 lid interaction with Get3 α7, and the Get3 L(α4) interaction site. It is possible that our analysis using ATPase-deficient Get3 prevents additional conformational changes triggered by SGTA engagement. Alternatively, these interactions may be selectively disrupted when the substrate chamber is occupied. How successful client loading onto Get3 leads to ATP hydrolysis and Get4 dissociation are important questions for future investigations. Altogether, our findings provide insights into how accessory factors prime chaperones for cooperative client transfer reactions through highly coordinated interactions that may apply to other protein chaperone systems.
Methods
Recombinant protein expression, purification, and complex formation
Constructs for recombinant protein expression, including D. rerio His-Get3(D68N) in pET-28a, GST-SGTA and GST-TRC35 (wildtype and R25D/K29D) in pGEX6.1, Ubl4a-His in pRSETA, and His-cBag6 [1004–1132] in pACYCDuet-1, and for PURE translation of a model TA protein containing VAMP2 TMD and the cytosolic region of Sec61β (Fig. 4) are as previously described19. To generate recombinant Get3(Bpa) for site-specific photocrosslinking experiments, a C-terminal 3xStrepII tag ending with the UGA stop codon was appended to His-Get3(D68N) in pET-28a using Phusion mutagenesis. Individual amber mutations were incorporated using Phusion mutagenesis. The Bag6-Strep plasmid for mammalian cell expression was generated by transferring the Bag6 open reading frame from a previously described Flag-tagged construct19 into a pcDNA3.1 cassette containing a C-terminal TEV-TwStrep tag using standard molecular biology techniques. Get4 point mutants (R278E) and C-terminal deletions (ΔC; Y294*) were introduced using quick-change mutagenesis.
BL21(DE3) E. coli. were individually transformed with SGTA, Ubl4a, or His-Get3(D68N) or co-transformed with TRC35 and cBag6. Transformed cells were grown in LB, except for those expressing Ubl4a, which were grown in TB, under the appropriate antibiotic selection. Get3(D68N), SGTA, Ubl4a were induced with 0.2 mM IPTG at OD600 ~0.4 at 37°C for 3 hr. cBag6 co-expressed with Get4 was induced with 0.2 mM IPTG at OD600 ~0.6 at 16°C overnight. Cell pellets were suspended in Ni-A [1x PBS pH 7.5, 250 mM NaCl, 10 mM imidazole, 1 mM DTT, 1x cOmplete EDTA-free protease inhibitor cocktail (Roche) or 1 mM PMSF], lysed by sonication, and clarified by centrifugation at 34,541xg for 20 min at 4°C. Purification of His-TRC40 and His-Ubl4a over Ni-NTA (Qiagen 30210) was performed by gravity flow, washed with 20 column volumes of Ni-A, and eluted with Ni-B (1x PBS pH 7.5, 250 mM NaCl, 250 mM imidazole, 1 mM DTT). Purification of GST-SGTA over glutathione sepharose (Cytiva 17075604) was performed by gravity flow, washed with 20 column volumes of Ni-A, and eluted with 50 mM Tris pH 8, 150 mM KOAc, 2 mM Mg(OAc)2, 25 mM reduced glutathione. Peak elutions of Get3(D68N), Ubl4a, and SGTA were individually dialyzed overnight in 1x PBS pH 7.5, 10 mM imidazole, 1 mM DTT at 4°C in the presence of 1:100 (v/v) of recombinant SuperTEV protease [Get3(D68N), Ubl4a] or 1:400 of GST-3C protease (SGTA). Cleaved epitope tags and proteases were subtracted by passing over the appropriate affinity resin, and the cleaved proteins were used immediately for complex formation.
To purify the Get3(D68N/Bpa)-Strep mutants for site-specific photocrosslinking, BL21(DE3) E. coli were co-transformed with Get3(D68N/amber)-Strep and pEVOL-pBpF plasmids. Transformed cells were grown in 500 mL LB containing 34 μg/mL chloramphenicol and 50 μg/mL kanamycin at 37°C. At OD600 ~0.5–0.6, Bpa was added to a final concentration of 1 mM, and the cells were grown for a further 15 min at 37°C before induction with 0.1% arabinose and 1 mM IPTG at 25°C for 6 hr. The cell pellets were washed with water to remove residual biotin, resuspended in PSB (50 mM HEPES pH 7.5, 100 mM KOAc, 2.5 mM MgOAc2) supplemented with 1 mM DTT and 1x cOmplete EDTA-free protease inhibitor cocktail (Roche), lysed by sonication, and clarified by centrifugation at 34,541xg for 20 min at 4°C. The clarified lysates were mixed with 200 μL of Streptactin HP (Cytiva) resin for 1 hr at 4°C, then washed with 40 mL of PSB supplemented with 1 mM DTT, transferred to gravity columns, and eluted with PSB supplemented with 1 mM DTT and 5 mM desthiobiotin. The peak elution was dialyzed overnight in PSB supplemented with 1 mM DTT and 20 mM imidazole at 4°C in the presence of 1:100 (v/v) of recombinant SuperTEV protease to remove the N-terminal 6xHis tag not used for purification or pulldowns in these experiments. Cleaved epitope tags and proteases were subtracted by incubating with Ni-NTA resin.
To purify cBag6 and Get4 and assemble cBUGG(S), clarified cell lysate co-expressing His-cBag6 and GST-TRC35 was first passed over Ni-NTA by gravity flow, washed with 20 column volumes of Ni-A, and eluted with Ni-B. The peak elution fractions were dialyzed overnight 4°C in 1x PBS pH 7.5, 10 mM imidazole, 1 mM DTT. The dialyzed material was combined with ~3–5-fold molar excess of Get3(D68N), Ubl4a, and optionally SGTA purified as above. ATP was added to a final concentration of 2 mM. After 10 min at 4°C, the mixture was purified by gravity flow over glutathione sepharose, washed with 9 column volumes of 1x PBS pH 7.5, 1 μM ATP, 1 mM DTT, and eluted with 50 mM Tris pH 8, 150 mM KOAc, 2 mM Mg(OAc)2, 25 mM reduced glutathione, 1 μM ATP. Peak elutions were dialyzed overnight in PSB (50 mM HEPES pH 7.5, 150 mM KOAc, 2 mM Mg(OAc)2, 1 mM DTT) at 4°C in the presence of 1:400 (v/v) of GST-3C. Cleaved GST and 3C protease were subtracted by passage over glutathione sepharose. The purified complexes were immediately used to freeze grids for cryo-EM analysis, or frozen at −80°C and used within one freeze-thaw cycle. For one preparation of the cBUGGS complex, an excess of GST-SGTA was added to peak cBUGG fractions after glutathione elution and dialyzed overnight in PSB (50 mM HEPES pH 7.5, 150 mM KOAc, 2 mM Mg(OAc)2, 1 mM DTT) at 4°C with 1:400 (v/v) GST-3C. The resulting cBUGGS complex was isolated from free SGTA, GST, and GST-3C by size exclusion chromatography over a superose 6 column equilibrated in PSB with 1 μM ATP before freezing to grids.
Purification of cBUGGS via Flag-Get4 (Extended Data Fig. 9b,c) was similar, except that the dialyzed cBag6-Get4 elution after the NiNTA purification step was combined with approximately equimolar Ubl4a relative to cBag6 and ~5-fold molar excess of Get3 and SGTA in the presence of 2 mM ATP. After 10 min at 4°C, the mixture was passed over anti-Flag M2 affinity resin (Sigma A2220) by gravity flow. The resin was washed with 9 column volumes of PBS, 1 mM DTT, 1 μM ATP, and the cBUGGS complex cleaved off from the resin by incubation with 1:100 (v/v) GST-3C overnight at 4°C. The eluted complex was incubated with a mixture of glutathione sepharose and NiNTA to subtract the GST-3C and remaining epitope tags for 30 min at 4°C before being frozen at −80°C for negative stain analysis.
To purify the BUGGS complex (Fig. 6c and Extended Data Fig. 9d), 120 mL of Expi293F cells (ThermoFisher Scientific A14527) were seeded at 2.5 million cells/mL. After 24 hr, the cells were transfected with 1 μg/mL Bag6-Strep plasmid using 5 μg/mL polyethylenimine (PEI 25K, Polysciences). 3 mM sodium valproate and 0.45 % glucose were added 24 hr after transfection, followed by an additional 48 hr of incubation. The Expi293F cells were washed in PBS and lysed in 4 mL lysis buffer (50 mM HEPES pH 7.5, 100 mM KOAc, 5 mM Mg(OAc)2, 1% TX-100, 1 mM DTT, 1x cOmplete EDTA-free protease inhibitor cocktail) for 10 min on ice. 500 μL of clarified lysate was incubated with 15 μM Get3, Get4, Ubl4a, and SGTA in the presence of 1 mM ATP in a total volume of 1 mL. The mixture was incubated with 100 μL of pre-equilibrated Streptactin-HP (Cytiva) resin at 4°C for 1 hr. The beads were washed three times with 2 mL lysis buffer containing 1 mM ATP, followed by three times with 2 mL of 50 mM HEPES pH 7.5, 100 mM KOAc, 5 mM Mg(OAc)2, 1 mM DTT, 1 μM ATP. Three sequential elutions were performed with 50 mM HEPES pH 7.5, 100 mM KOAc, 5 mM Mg(OAc)2, 1 mM DTT, 10 mM desthiobiotin.
Cryo-EM sample preparation and data collection
Purified cBUGG or cBUGGS at 1.3 mg/mL were crosslinked with 250 μM BS3 (Thermo Fisher Scientific 21580) for 15 min at 4°C, quenched with 2.5 mM Tris pH 7.5. 3 μL of crosslinked cBUGG at 0.65 or 0.45 mg/mL was applied to glow-discharged 1.2/1.3 UltrAuFoil 300 mesh grids (Quantifoil), and frozen in liquid ethane using a Vitrobot Mark IV (Thermo Fisher Scientific) set at 4°C and 100% humidity with a 30 sec wait time, 3 sec blot time, and +8 blot force. 3 μL of crosslinked cBUGGS at 0.6 mg/mL was applied to glow-discharged 1.2/1.3 carbon foil 300 mesh copper grids (Quantifoil), and frozen in liquid ethane using a Vitrobot Mark IV set at 4°C and 100% humidity with a 30 sec wait time, 3 sec blot time, and +4 blot force. For one cBUGGS dataset, 0.05 mg/mL of combined peak fractions of the cBUGGS complex after size exclusion chromatography was directly applied without crosslinking to 1.2/1.3 holey carbon 400 mesh Cu grids coated in-house with graphene oxide (Sigma 763705)40, and frozen in liquid ethane using a Vitrobot Mark I (FEI) set at 4°C and 100% humidity with a 30 sec wait time, 4 sec blot time, and −2 blot offset. 3 μL of 1 mg/mL BUGGS was applied to glow-discharged 1.2/1.3 UltrAuFoil 300 mesh grids and frozen in liquid ethane using a Vitrobot Mark IV set at 4°C and 100% humidity with a 30 sec wait time, 3 sec blot time, and +8 blot force.
Semi-automated data collection was performed with SerialEM. cBUGG and cBUGGS grids were imaged on a Titan Krios (Thermo Fisher Scientific) operating at 300 kV equipped with a BioQuantum K3 imaging filter with a 20 eV slit width and a K3 summit direct electron detector (Gatan) in counting mode at a nominal magnification of 105,000x corresponding to a calibrated pixel size of 0.825 Å. A total exposure time of 2.5 sec was fractionated into 50 frames and resulted in a total exposure of ~54 electrons/Å2. The defocus targets were −1.4 to −2.6 μm. BUGGS grids were imaged on a Talos Arctica (Thermo Fisher Scientific) operating at 200 kV equipped with a K3 direct electron detector (Gatan) in counting mode at a nominal magnification of 36,000x corresponding to a calibrated pixel size of 1.1 Å. A total exposure time of 4.5 sec was fractionated into 50 frames and resulted in a total exposure of ~52.5 electrons/Å2. The defocus targets were −1.4 to −2.6 μm.
Data processing, modeling, and validation
Data processing was performed in RELION-3.0 and RELION-3.141. Global and local (5×5 patches) beam-induced motion was corrected using RELION’s implementation of motion correction or MotionCor242. CTF parameter estimation was performed with CTFFind4.143 or GCTF44. Micrographs with severe contamination or poor CTF fits were removed from further processing. Automated particle picking was performed using crYOLO by manually picking a subset of ~10–20 micrographs and training a model using default parameters for autopicking45. Coordinates from crYOLO were imported into RELION for subsequent processing steps. cBUGG(S) particles were extracted with a box size of 364, or downsampled to a box size of 182 for initial classification steps. Iterative 2D classification was critical for removing particle coordinates that did not correspond to true particles and partially denatured complexes. Based on the structures observed in the 2D classes, a reference map was generated from PDB 4PWX32 using the molmap function in Chimera46 that was low pass filtered to 30 Å and used for an initial round of 3D refinement and classification of cBUGGS dataset #1. Subsequently, RELION-generated maps were used as references for additional processing steps.
For the cBUGG datasets, multiple rounds of 2D and 3D classification were performed to isolate particles contributing to the best reconstructions after 3D refinement as summarized in Supplementary Fig. 4. After refinement, CTF refinement and Bayesian polishing was performed. Polished particles from two datasets for each sample were combined for an additional round of particle cleanup by 2D classification and CTF refinement. Masked 3D refinement was performed without and with C2 symmetry imposed using a mask around the entire cBUGG volume. Subsequently, signal subtraction was performed using a mass around the entire cBUGG volume, and 3D classification without alignments identified two populations of the cBUGG complex with different bridging arm conformations. The original particles corresponding to each class were used for a final round of refinement using a mask around the entire volume with C2 symmetry imposed. Performing the refinements of these classes without imposed symmetry did not reveal clear asymmetric differences. Particles from the two cBUGGS datasets were combined after initial 2D and 3D classifications as summarized in Supplementary Fig. 5, and used for masked 3D refinement and 3D classification. Particles from the best classes were selected for CTF refinement and Bayesian polishing.
Starting models for ATP-bound Get3 (PDB 3IQW)11, Get4 (PDB 6AU8), cBag6 (PDB 6AU8 and 4WWR) and Ubl4a (PDB 4WWR)18,33 were placed into an unsharpened cBUGGS map by rigid body fitting in Chimera. Amino acid sequences were converted to the human Get3 sequence in Coot47. Local differences and new visible loops were built or adjusted in Coot. Models were refined using multiple rounds of Phenix real space refine48, with manual model correction in Coot and in ChimeraX guided by ISOLDE49 in between rounds of refinement. Model validation was performed with MolProbity50 and EMRinger51. Figure panels were made with Chimera, ChimeraX52, and Pymol53. Secondary structure predictions (Extended Data Fig. 2) were performed using PSIPRED54. Software packages were installed and configured by SBGrid55.
Motion correction, CTF estimation, and particle picking for the full-length BUGGS dataset was performed as described for the cBUGG(S) datasets. 150,287 particles were extracted from 981 micrographs with a box size of 256 correlating to a pixel size of 1.1 Å, or downsampled to a box size of 128 for initial rounds of 2D classification. The final round of 2D classification was performed with 31,937 particles. The representative class averages shown in Fig. 6c are the first, second, third, and twelfth most abundant classes comprising 6,273 particles.
Crosslinking and TA transfer assays
For substrate photocrosslinking (Extended Data Fig. 1b), expression and purification of Flag-tagged TA protein in complex with calmodulin is as previously described56. Crosslinking reactions were with ~30 nM TA protein-calmodulin complex, 1 μM SGTA, and 1 μM cBUGG. Reactions were incubated at 32°C for 5 min, and irradiated with UV light for 10 min on ice with a UV B-100AP lamp (Analytik Jena). Reactions were quenched with protein sample buffer and analyzed by SDS-PAGE and immunoblotting using the M2 anti-Flag antibody (Sigma F3165).
To assay TA protein transfer (Fig. 4), PURE in vitro translation (NEB E6800) reactions of a radiolabeled model TA protein containing the VAMP2 TMD were performed with 25 μM SGTA according to manufacturers’ instructions for 30 min at 37°C. 50 μL reactions were diluted 4-fold in 50 mM Hepes pH 7.5, 100 mM KOAc, 2 mM Mg(OAc)2 and size fractionated over a 2 mL 5–25% sucrose gradient in a TLS-55 rotor (Beckman Coulter) at 258,487xg for 5 hr at 4°C with the slowest acceleration and deceleration settings. The third through fifth fractions of eleven 200 μL fractions were combined (referred to as SGTA-TA complex) and used for transfer assays. Transfer reactions containing one-half volume of SGTA-TA complex, 1 mM ATP, and 1 μM Get3 and cBUG complexes as indicated were incubated at 32°C for 10 min. Reactions were analyzed directly or diluted two-fold and incubated with 250 μM BMH (ThermoFisher Scientific 22330) for 1 hr at 4°C before being quenched with protein sample buffer and analyzed by SDS-PAGE and autoradiography. Immunoprecipitations for crosslinks to SGTA were performed on 50 μL quenched samples heated to 95°C for 5 min and then incubated with 3 μL rabbit polyclonal anti-SGTA serum raised against an SGTA peptide19 and 10 μL packed Protein A resin (CaptivA) in IP buffer (1x PBS, 250 mM NaCl, 1% Triton X-100) at 4°C for 1.5 hr. The resin was washed three times with 1 mL IP buffer and eluted with protein sample buffer.
For site-specific photocrosslinking with recombinant Get3(D68N/Bpa)-Strep, reactions containing 2 μM of purified Get3(Bpa)-Strep, 2 μM cBUG containing Flag-tagged full-length or ΔC Get4, optionally 2 μM SGTA, and 0.5 mM ATP in PSB supplemented with 1 mM DTT were incubated at 32°C for 5 min. Where indicated, reactions were irradiated with UV light for 10 min on ice with a UV B-100AP lamp ~10 cm away from the light source. Reactions were placed on ice and quenched in protein sample buffer for analysis by SDS-PAGE and Coomassie staining (Fig. 6b). For immunoprecipitations, 70 μL of each reaction was added to 10 μL 10% SDS, boiled for 5 min, diluted with 1 mL IP buffer (PBS, 250 mM NaCl, 1% Triton X-100), and incubated with 10 μL packed volume of Streptactin HP (Cytiva) for 1 hr at 4°C. Reactions were washed twice with IP buffer and eluted directly in protein sample buffer for SDS-PAGE and immunoblotting using M2 anti-Flag antibody or anti-SGTA polyclonal sera19 (Extended Data Fig. 8). Bpa locations were ranked and binned into groups based on normalized crosslinking intensities. Crosslinks to SGTA were normalized to the maximum signal (to Q190Bpa). Crosslinks to Get4 were normalized to the uncrosslinked Get4 signal in each lane.
SEC-MALS
Experiments were performed with a Wyatt Dawn Heleos II multi-angle light scattering detector with an Optilab T-rEX refractive index monitor and Agilent isocratic HPLC system equipped with a SEPAX SRT SEC-300 column. All samples were subjected to an initial size exclusion chromatography step over a Superose 6 column before 100 μL of 2 mg/mL SGTA, 1.15 mg/mL TRC40, 1.74 mg/mL cBUG, 0.87 mg/mL cBUGG, or 1 mg/mL cBUGGS was injected at a flow rate of 0.5 mL/min. Data analysis was performed with the Astra software package version 7.1.4.8 (Wyatt).
Negative staining, data collection, and analysis
3 μL of 0.05 mg/mL cBUGGS or Flag-cBUGGS in 20 mM HEPES pH 7.5, 150 mM KOAc, 2 mM Mg(OAc)2, 1 mM DTT, 1 μM ATP was applied to glow-discharged (30 sec, 30 mA) 400-mesh Cu grid (Electron Microscopy Sciences) coated with a ~10 nm layer of continuous carbon (Safematic CCU-010) for 30 sec. After side blotting, the grid was immediately stained with 1.5% uranyl formate and then blotted from the side. Staining was repeated twice with a 30 sec incubation with uranyl formate before the final blotting step. The grid was air dried prior to imaging. EM Images were collected using a FEI Tecnai T12 operating at 120 keV and equipped with a Gatan 4K × 4K CCD camera at a nominal magnification of 67,000× corresponding to a pixel size of 1.68 Å. Defocus targets were −1.0 to −2.0 μm. Image processing was performed in RELION-3.0. After CTF estimation with GCTF, particle picking was carried out using templates generated from manual picking a subset of micrographs. Particles were extracted with a 178 pixel box size for reference-free 2D classification.
Code Availability Statement
No code was generated in this study.
Extended Data
Extended Data Fig. 1. GET complexes analyzed in this study.

a, SDS-PAGE and Coomassie staining of recombinant cBUGG (cBag6-Ubl4a-Get4-Get3) and cBUGGS (cBag6-Ubl4a-Get4-Get3-SGTA) complexes, representative of 6 independent purifications. b, Recombinant Flag-tagged tail-anchored (TA) protein containing the UV-activatable crosslinking amino acid Bpa in the Sec61β transmembrane domain [Flag-TA(Bpa)] in complex with the calcium-dependent chaperone calmodulin was incubated with SGTA, cBUGG, and the calcium chelator EGTA as indicated. Reactions were exposed to UV light and analyzed by SDS-PAGE and immunoblotting, representative of 2 independent experiments. TA protein crosslinks to other TA protein molecules (x TA), SGTA, and Get3 are indicated.
Extended Data Fig. 2. Quality of maps and models.

a, Representative 2D class averages of the cBUGG (cBag6-Ubl4a-Get4-Get3; top) and cBUGGS (cBUGG + SGTA; bottom) complexes. Scale bars, 100 Å. Pink arrowheads, extra density seen in 2D class averages of cBUGGS but not cBUGG. b, Fourier shell correlation (FSC) coefficient vs. resolution (1/Å) curves of the indicated maps. Resolution was estimated at FSC=0.143 (gray dotted line). c, Unsharpened Coulomb potential maps colored by local resolution. Get3 L(α4) is indicated. Light orange arrows, C-terminus of Get4; Pink arrow, cBUGGS-specific interaction. d, Model vs. map FSC curves.
Extended Data Fig. 3. Examples of model and map fits.

Segmented EM densities of the sharpened cBUGG-in map and atomic model of the indicated Get3 (green), Get4 (light orange), and cBag6 (blue) residues. Map contour levels are listed below.
Extended Data Fig. 4. Get3 comparisons.

a, Superposition of Get3 from cBUGG-in (colored) with yeast Get3 in the closed conformation (gray, PDB 2WOJ). The two Get3 subunits are differentiated by dark (Get3-A) and light (Get3-B) green. Helices lining the substrate chamber are labeled. b, Superposition of Get3 from cBUGG-in (green) with yeast Get3 (gray) bound to the Pep12 transmembrane domain (TMD, purple, PDB 4XTR). c, Clipped view of the metazoan Get3 substrate chamber colored by surface hydrophobicity (blue, least hydrophobic to orange, most hydrophobic). d, Segmented EM density (at 14.1σ contour level) and atomic model of the ATP binding site of cBUGG-in. The catalytic Asp68 mutated to Asn is indicated. e, Superposition of the ATP-binding sites of Get3 in cBUGG-out with yeast Get3 in the closed conformation (2WOJ), bound to a substrate (4XTR), and in complex with Get4/5 (4PWX). Resolutions of crystal structures are reported in parentheses. Motifs involved in ATP binding and hydrolysis are labeled; other residues are transparent.
Extended Data Fig. 5. Get3-Get4 comparisons.

a, Superposition of cBUGG-out (colored) with yeast Get3-Get4-Get5 (gray, PDB 4PWX). Conserved (black) and L(α4) (purple) binding interactions are boxed. b, Surface electrostatics of the Get3-Get4 interface. Boxed regions correspond to panel a. c, Superposition of the bridging factors of cBUGG-in (gray) and cBUGG-out (colored) aligned on Get3. d, Overview of Get3-Get4 interactions along one bridging arm. Note that the two interaction sites on Get4 involve different Get3 subunits.
Extended Data Fig. 6. Substrate chamber lid.

a, Lid region above the Get3 substrate chamber of the unsharpened cBUGG map without imposed symmetry (at 9.5σ contour level; gray) and the cBUGG-out atomic model (colored). Dotted lines indicate proposed continuity of unmodeled regions of Get3 (green) and Get4 (yellow). b, Unmodeled sequences of Get3 and Get4. Hydrophobic (orange), acidic (red), and basic (blue) amino acids are colored. Modeled amino acids are gray with Get3 secondary structure designations above (green). Mauve line, Get4 residues modeled in PDB 6AU8; gray dashed lines, unmodeled helices predicted by PSIPRED. c-d, Unsharpened cBUGG-in map (at 9.7σ contour level) and hypothetical lid helices contributed by c, Get3 or d, Get4. Mauve arrow indicates break in lid density that may correspond to the point where Get3 loops back towards α9. e, Cartoon (top) and surface electrostatics (bottom) of Get3 in cBUGG-in showing a basic face of α7 (dashed rectangle) that may interact with acidic C-terminal Get4 residues. Basic residues (Arg183 and Arg179) along α7 are shown. f, Scheme for assaying radiolabeled TA protein capture and transfer from SGTA to Get3. IVT, in vitro translation. g, SDS-PAGE and autoradiography (top) or Coomassie staining (bottom) of PURE in vitro translation reactions with no additional chaperone, SGTA, or the indicated Get3 variant, followed by chemical crosslinking. Note that the KAAKKK Get3 mutant captures TA protein as well as wildtype Get3, representative of 2 independent experiments.
Extended Data Fig. 7. Recruitment platform and SGTA interactions.

a, Model and unsharpened map of cBUGG-in showing connectivity of cBag6 and cBag6 interactions with Get4. Blue arrow, turning point after cBag6 α3. b, cBUGG-out model of a bridging arm fitted into the unsharpened cBUGG map without imposed symmetry. Red arrow, interaction between Ubl4a and the cBag6 α2-α3 loop; red box, interaction between the C-terminus of cBag6 and the Get4 α9-α10 loop. Blue dotted line, map region corresponding to unmodeled C-terminal cBag6 residues. c, Different views of the unsharpened cBUGGS map at 9.5σ contour level as in Fig. 5b. Relevant helices of Get3 (green), Get4 (light orange), and cBag6 (blue) are numbered. Arrows are as in Fig. 5b. d, The masked cBUGGS map (pink) aligned to the cBUGG map (transparent gray), both at 4.5σ contour level, showing remodeling of the recruitment platform towards D1 (blue arrow) and the region above the Get3 substrate chamber upon SGTA binding. The view on the right corresponds to the top view in Fig. 1 (right panels). e, Aligned maps as in panel d, both at 9.5σ contour level, showing how SGTA binding remodels the lid over the Get3 substrate chamber.
Extended Data Fig. 8. Identification of Get3(Bpa) crosslinks to SGTA and Get4.
UV-dependent crosslinking reactions as in Fig. 6b were subjected to denaturing pulldowns for Get3-Strep and immunoblotted for a, SGTA (Ponceau staining shown in bottom panel) or b, FLAG-tagged Get4, representative of 2 independent experiments. Low levels of uncrosslinked Get4 result from non-specific interactions with the resin, are a small proportion of the input (see Fig. 6b), and serve as loading controls.
Extended Data Fig. 9. Influences on complex architecture.

a, SEC-MALS traces of the indicated complexes. Absorbance at 280 nm was normalized to the highest peak for each sample. *, minor populations of higher-order cBUGGS (black) and excess Get4 (orange). b, SDS-PAGE and Coomassie staining of cBUGGS purified via Flag-tagged Get4, representative of 2 independent purifications. c, Representative 2D classes (top, scale bar, 100 Å) and micrographs (bottom, scale bar, 50 nm) of negatively stained cBUGGS purified via GST- (left) or Flag-tagged Get4 (right). d, SDS-PAGE and Coomassie staining of the BUGGS complex containing full-length Bag6 assembled with Ubl4a, Get4, Get3, and SGTA, representative of 3 independent experiments.
Supplementary Material
Acknowledgements
Cryo-EM screening and data collections were performed at the Cryo-EM Center for Structural Biology and the Molecular Electron Microscopy Suite (MEMS) at Harvard Medical School. Data processing was supported by SBGrid. SEC-MALS was performed at the Center of Macromolecular Interactions (CMI) at Harvard Medical School. We thank Michael McKenna for calmodulin complexes; Melissa Chambers, Zongli Li, Sarah Sterling, and Richard Walsh for cryo-EM support; Kelly Arnett for SEC-MALS training; Robert Keenan and Claire Atkinson for input at preliminary stages of this project; and Alan Brown, Ramanujan Hegde, and Shao Lab members for helpful discussions.
This work was supported by the Richard and Susan Smith Family Foundation (S.S.), Harvard Medical School (S.S.), the Vallee Foundation (S.S.), the Packard Foundation (S.S.), and NIH DP2GM137415 (S.S.). M.C.J.Y. is supported by AHA predoctoral fellowship 287375208.
Footnotes
Competing Interests
The authors declare no competing interests.
Data Availability Statement
EM maps and models described in this study are available under accession numbers EMD-24700, EMD-24701, EMD-24702, EMD-24703, EMD-24704, PDB-7RU9, PDB-7RUA, and PDB-7RUC. Source data are provided with this paper.
References
- 1.Gestaut D et al. The Chaperonin TRiC/CCT Associates with Prefoldin through a Conserved Electrostatic Interface Essential for Cellular Proteostasis. Cell 177, 751–765.e15 (2019). [DOI] [PMC free article] [PubMed] [Google Scholar]
- 2.Rosenzweig R, Nillegoda NB, Mayer MP & Bukau B The Hsp70 chaperone network. Nat Rev Mol Cell Bio 20, 665–680 (2019). [DOI] [PubMed] [Google Scholar]
- 3.Genest O, Wickner S & Doyle SM Hsp90 and Hsp70 chaperones: Collaborators in protein remodeling. J Biol Chem 294, 2109–2120 (2019). [DOI] [PMC free article] [PubMed] [Google Scholar]
- 4.Chio US, Cho H & Shan S Mechanisms of Tail-Anchored Membrane Protein Targeting and Insertion. Annu Rev Cell Dev Bio 33, 417–438 (2017). [DOI] [PMC free article] [PubMed] [Google Scholar]
- 5.Hegde RS & Keenan RJ Tail-anchored membrane protein insertion into the endoplasmic reticulum. Nat Rev Mol Cell Bio 12, 787–798 (2011). [DOI] [PMC free article] [PubMed] [Google Scholar]
- 6.Schuldiner M et al. The GET complex mediates insertion of tail-anchored proteins into the ER membrane. Cell 134, 634–645 (2008). [DOI] [PMC free article] [PubMed] [Google Scholar]
- 7.Stefanovic S & Hegde RS Identification of a targeting factor for posttranslational membrane protein insertion into the ER. Cell 128, 1147–1159 (2007). [DOI] [PubMed] [Google Scholar]
- 8.Favaloro V, Vilardi F, Schlecht R, Mayer MP & Dobberstein B Asna1/TRC40-mediated membrane insertion of tail-anchored proteins. J Cell Sci 123, 1522–1530 (2010). [DOI] [PubMed] [Google Scholar]
- 9.Mateja A et al. Structure of the Get3 targeting factor in complex with its membrane protein cargo. Science 347, 1152–1155 (2015). [DOI] [PMC free article] [PubMed] [Google Scholar]
- 10.Mateja A et al. The structural basis of tail-anchored membrane protein recognition by Get3. Nature 461, 361–366 (2009). [DOI] [PMC free article] [PubMed] [Google Scholar]
- 11.Bozkurt G et al. Structural insights into tail-anchored protein binding and membrane insertion by Get3. Proc Natl Acad Sci 106, 21131–21136 (2009). [DOI] [PMC free article] [PubMed] [Google Scholar]
- 12.Suloway CJM, Chartron JW, Zaslaver M & Clemons WM Model for eukaryotic tail-anchored protein binding based on the structure of Get3. Proc Natl Acad Sci 106, 14849–14854 (2009). [DOI] [PMC free article] [PubMed] [Google Scholar]
- 13.Wang F, Brown EC, Mak G, Zhuang J & Denic V A chaperone cascade sorts proteins for posttranslational membrane insertion into the endoplasmic reticulum. Mol Cell 40, 159–171 (2010). [DOI] [PMC free article] [PubMed] [Google Scholar]
- 14.Wang F, Whynot A, Tung M & Denic V The mechanism of tail-anchored protein insertion into the ER membrane. Mol Cell 43, 738–750 (2011). [DOI] [PMC free article] [PubMed] [Google Scholar]
- 15.Rome ME, Chio US, Rao M, Gristick H & Shan S Differential gradients of interaction affinities drive efficient targeting and recycling in the GET pathway. Proc Natl Acad Sci 111, E4929–35 (2014). [DOI] [PMC free article] [PubMed] [Google Scholar]
- 16.Rome ME, Rao M, Clemons WM & Shan S Precise timing of ATPase activation drives targeting of tail-anchored proteins. Proc Natl Acad Sci 110, 7666–7671 (2013). [DOI] [PMC free article] [PubMed] [Google Scholar]
- 17.Mariappan M et al. A ribosome-associating factor chaperones tail-anchored membrane proteins. Nature 466, 1120–1124 (2010). [DOI] [PMC free article] [PubMed] [Google Scholar]
- 18.Mock J-Y et al. Bag6 complex contains a minimal tail-anchor-targeting module and a mock BAG domain. Proc Natl Acad Sci 112, 106–111 (2015). [DOI] [PMC free article] [PubMed] [Google Scholar]
- 19.Shao S, Rodrigo-Brenni MC, Kivlen MH & Hegde RS Mechanistic basis for a molecular triage reaction. Science 355, 298–302 (2017). [DOI] [PMC free article] [PubMed] [Google Scholar]
- 20.Lin K-F, Fry MY, Saladi SM & Clemons WM Molecular basis of tail-anchored integral membrane protein recognition by the cochaperone Sgt2. J Biol Chem 296, 100441 (2021). [DOI] [PMC free article] [PubMed] [Google Scholar]
- 21.Chio US, Chung S, Weiss S & Shan S A Chaperone Lid Ensures Efficient and Privileged Client Transfer during Tail-Anchored Protein Targeting. Cell Rep 26, 37–44.e7 (2019). [DOI] [PMC free article] [PubMed] [Google Scholar]
- 22.Rao M et al. Multiple selection filters ensure accurate tail-anchored membrane protein targeting. eLife 5, 1743 (2016). [DOI] [PMC free article] [PubMed] [Google Scholar]
- 23.Leznicki P, Clancy A, Schwappach B & High S Bat3 promotes the membrane integration of tail-anchored proteins. J Cell Sci 123, 2170–2178 (2010). [DOI] [PMC free article] [PubMed] [Google Scholar]
- 24.Chio US, Chung S, Weiss S & Shan S A protean clamp guides membrane targeting of tail-anchored proteins. Proc Natl Acad Sci 114, E8585–E8594 (2017). [DOI] [PMC free article] [PubMed] [Google Scholar]
- 25.Stefer S et al. Structural basis for tail-anchored membrane protein biogenesis by the Get3-receptor complex. Science 333, 758–762 (2011). [DOI] [PMC free article] [PubMed] [Google Scholar]
- 26.Mariappan M et al. The mechanism of membrane-associated steps in tail-anchored protein insertion. Nature 477, 61–66 (2011). [DOI] [PMC free article] [PubMed] [Google Scholar]
- 27.McDowell MA et al. Structural Basis of Tail-Anchored Membrane Protein Biogenesis by the GET Insertase Complex. Mol Cell 80, 72–86.e7 (2020). [DOI] [PubMed] [Google Scholar]
- 28.Wang F, Chan C, Weir NR & Denic V The Get1/2 transmembrane complex is an endoplasmic-reticulum membrane protein insertase. Nature 512, 441–444 (2014). [DOI] [PMC free article] [PubMed] [Google Scholar]
- 29.Vilardi F, Stephan M, Clancy A, Janshoff A & Schwappach B WRB and CAML are necessary and sufficient to mediate tail-anchored protein targeting to the ER membrane. PLoS ONE 9, e85033 (2014). [DOI] [PMC free article] [PubMed] [Google Scholar]
- 30.Hessa T et al. Protein targeting and degradation are coupled for elimination of mislocalized proteins. Nature 475, 394–397 (2011). [DOI] [PMC free article] [PubMed] [Google Scholar]
- 31.Rodrigo-Brenni MC, Gutierrez E & Hegde RS Cytosolic quality control of mislocalized proteins requires RNF126 recruitment to Bag6. Mol Cell 55, 227–237 (2014). [DOI] [PMC free article] [PubMed] [Google Scholar]
- 32.Gristick HB et al. Crystal structure of ATP-bound Get3–Get4–Get5 complex reveals regulation of Get3 by Get4. Nat Struct Mol Biol 21, 437–442 (2014). [DOI] [PMC free article] [PubMed] [Google Scholar]
- 33.Mock J-Y, Xu Y, Ye Y & Clemons WM Structural basis for regulation of the nucleo-cytoplasmic distribution of Bag6 by TRC35. Proc Natl Acad Sci 114, 11679–11684 (2017). [DOI] [PMC free article] [PubMed] [Google Scholar]
- 34.Chartron JW, Suloway CJM, Zaslaver M & Clemons WM Structural characterization of the Get4/Get5 complex and its interaction with Get3. Proc Natl Acad Sci 107, 12127–12132 (2010). [DOI] [PMC free article] [PubMed] [Google Scholar]
- 35.Bozkurt G et al. The structure of Get4 reveals an α-solenoid fold adapted for multiple interactions in tail-anchored protein biogenesis. Febs Lett 584, 1509–1514 (2010). [DOI] [PubMed] [Google Scholar]
- 36.Morgens DW et al. Retro-2 protects cells from ricin toxicity by inhibiting ASNA1-mediated ER targeting and insertion of tail-anchored proteins. eLife 8, e48434 (2019). [DOI] [PMC free article] [PubMed] [Google Scholar]
- 37.Suloway CJ, Rome ME & Clemons WM Tail-anchor targeting by a Get3 tetramer: the structure of an archaeal homologue. Embo J 31, 707–719 (2012). [DOI] [PMC free article] [PubMed] [Google Scholar]
- 38.Xu Y, Liu Y, Lee J & Ye Y A Ubiquitin-like Domain Recruits an Oligomeric Chaperone to a Retrotranslocation Complex in Endoplasmic Reticulum-associated Degradation. J Biol Chem 288, 18068–18076 (2013). [DOI] [PMC free article] [PubMed] [Google Scholar]
- 39.Banerji J, Sands J, Strominger JL & Spies T A gene pair from the human major histocompatibility complex encodes large proline-rich proteins with multiple repeated motifs and a single ubiquitin-like domain. Proc Natl Acad Sci 87, 2374–2378 (1990). [DOI] [PMC free article] [PubMed] [Google Scholar]
Methods References
- 40.Martin TG, Boland A, Fitzpatrick AWP & Scheres SHW Graphene Oxide Grid Preparation. (2016) doi: 10.6084/m9.figshare.3178669.v1. [DOI]
- 41.Zivanov J et al. New tools for automated high-resolution cryo-EM structure determination in RELION-3. eLife 7, e42166 (2018). [DOI] [PMC free article] [PubMed] [Google Scholar]
- 42.Zheng SQ et al. MotionCor2: anisotropic correction of beam-induced motion for improved cryo-electron microscopy. Nat Methods 14, 331–332 (2017). [DOI] [PMC free article] [PubMed] [Google Scholar]
- 43.Rohou A & Grigorieff N CTFFIND4: Fast and accurate defocus estimation from electron micrographs. J Struct Biol 192, 216–221 (2015). [DOI] [PMC free article] [PubMed] [Google Scholar]
- 44.Zhang K Gctf: Real-time CTF determination and correction. J Struct Biol 193, 1–12 (2016). [DOI] [PMC free article] [PubMed] [Google Scholar]
- 45.Wagner T et al. SPHIRE-crYOLO is a fast and accurate fully automated particle picker for cryo-EM. Commun Biol 2, 218 (2019). [DOI] [PMC free article] [PubMed] [Google Scholar]
- 46.Pettersen EF et al. UCSF Chimera: A visualization system for exploratory research and analysis. J Computational Chemistry 25, 1605–1612 (2004). [DOI] [PubMed] [Google Scholar]
- 47.Emsley P, Lohkamp B, Scott WG & Cowtan K Features and development of Coot. Acta Cryst Struct Biol 66, 486–501 (2010). [DOI] [PMC free article] [PubMed] [Google Scholar]
- 48.Adams PD et al. PHENIX: a comprehensive Python-based system for macromolecular structure solution. Acta Cryst Struct Biol 66, 213–221 (2010). [DOI] [PMC free article] [PubMed] [Google Scholar]
- 49.Croll TI ISOLDE: a physically realistic environment for model building into low-resolution electron-density maps. Acta Cryst Struct Biol 74, 519–530 (2018). [DOI] [PMC free article] [PubMed] [Google Scholar]
- 50.Chen VB et al. MolProbity: all-atom structure validation for macromolecular crystallography. Acta Cryst Struct Biol 66, 12–21 (2010). [DOI] [PMC free article] [PubMed] [Google Scholar]
- 51.Barad BA et al. EMRinger: side chain–directed model and map validation for 3D cryo-electron microscopy. Nat Methods 12, 943–946 (2015). [DOI] [PMC free article] [PubMed] [Google Scholar]
- 52.Pettersen EF et al. UCSF ChimeraX: Structure visualization for researchers, educators, and developers. Protein Sci 30, 70–82 (2021). [DOI] [PMC free article] [PubMed] [Google Scholar]
- 53.The PyMOL Molecular Graphics System, Version 1.5.0.4 Schrödinger, LLC. [Google Scholar]
- 54.Buchan DWA & Jones DT The PSIPRED Protein Analysis Workbench: 20 years on. Nucleic Acids Res 47, W402–W407 (2019). [DOI] [PMC free article] [PubMed] [Google Scholar]
- 55.Morin A et al. Collaboration gets the most out of software. eLife 2, e01456 (2013). [DOI] [PMC free article] [PubMed] [Google Scholar]
- 56.McKenna MJ et al. The endoplasmic reticulum P5A-ATPase is a transmembrane helix dislocase. Science 369, eabc5809 (2020). [DOI] [PMC free article] [PubMed] [Google Scholar]
Associated Data
This section collects any data citations, data availability statements, or supplementary materials included in this article.
Supplementary Materials
Data Availability Statement
EM maps and models described in this study are available under accession numbers EMD-24700, EMD-24701, EMD-24702, EMD-24703, EMD-24704, PDB-7RU9, PDB-7RUA, and PDB-7RUC. Source data are provided with this paper.