

Summary
Background
The low expectation of clinical benefit from phase 1 cancer therapeutics trials may negatively impact patient and physician participation, study reimbursement and slow oncology research progress. Advances in cancer drug development, meanwhile, may have favorably improved treatment responses; however, little comprehensive data exist describing the response and toxicity associated with phase 1 trials across solid tumors.
Methods
We analyzed patient-level data from the Cancer Therapy Evaluation Program, National Cancer Institute, sponsored investigator-initiated phase 1 trials for solid tumors, January 2000 to May 2019, and report rates of toxicity and response by cancer type comparing the periods 2000–2005, 2006–2012, and 2013–2019.
Findings
A total of 465 protocols that enrolled 13,847 patients using 261 agents were analyzed. Thirty-one percent of trials comprise a monotherapy and 69% were combination therapies. The overall treatment-related death rate was 0.67% across all periods. Advanced age, performance status ≥2 and albumin <3.5g/dL were associated with higher risk of treatment-related death. A significant increase in response rate was seen over time; overall response rate increased from 9.6% to 18.0% from 2000–2005 to 2013–2019. Response rates for combination therapy were substantially higher than for monotherapy (15.8% vs 3.5%). The response by class of agents differed across diseases. Anti-angiogenesis agents were associated with higher response rate for bladder, colon, kidney and ovarian cancer. DNA repair inhibitors were associated with higher response rate in ovarian and pancreatic cancer. The rates and trends of response over time differed markedly by disease; there were notable improvements in bladder, breast, kidney cancer, and melanoma, but no change in the low response of pancreatic and colon cancer.
Interpretation
Over the past 20 years, the response rate in phase 1 trials nearly doubled without an increase in the treatment-related death rate. This study provides updated encouraging outcomes of modern phase 1 trials in solid tumors.
Funding
National Cancer Institute, National Institutes of Health, USA
Keywords: Phase I trial, treatment-related death, grade 5 toxicity, efficacy, response rate
Introduction
Phase 1 trials are the initial step in early phase oncology drug development. Phase 1 trials evaluate the safety and tolerability of novel investigational agents and combinations, leading to the determination of the recommended phase 2 dose in later phase studies. However, the debate around treatment intention in these trials has been ongoing. Due to the historical low response rate,1–5 ethical concerns were raised in offering phase 1 trials as the “last resort” for patients with advanced cancer who have exhausted other treatment options.6–9 Overall response rates in a mixed population of solid and haematologic malignancies have been reported at 5–10% based on data from previous studies analyzing phase 1 trials in the 1990s to early 2000s,1,2,10 confronting patients who are seeking therapeutics options beyond standard treatment with the prospect of high risks and unlikely benefit.
With significant advances in understanding cancer molecular biology and the identification of multiple molecular therapeutic targets, cancer drug development has dramatically changed from a focus on cytotoxic chemotherapy to targeted agents, including monoclonal antibodies, small molecules, and immunotherapy. Industry sponsored first-in-human monotherapy solid tumor phase 1 clinical trials involving such targeted drugs have demonstrated remarkable responses in patients with selected genomic markers.11 As a result, the risk to benefit ratio of phase 1 trials in particular tumor or genomic driven has improved, and the role of phase 1 trials has shifted towards being a tool for signal-finding and identifying an appropriate patient population for further development in addition to evaluating safety and toxicity.12–16
It is now recognized that the responses seen in phase 1 trials can vary significantly by disease.17,18 A meta-analysis of 346 phase 1 trials conducted between 2011 and 2013 showed that overall response was significantly higher in haematologic malignancies than solid tumors; the median response rate was 21.0% in haematologic malignancies vs. 4.3% in solid tumors.18 However, these studies were conducted based on meta-analysis of published trials in which the results are prone to various biases. Also, trial results are commonly reported as a summary which makes it challenging to look at disease-specific or agent-specific outcomes. Understanding of disease-specific toxicity and treatment activity requires individual patient-level data and comprehensive analyses which can potentially provide further insights into the characteristics of clinical responses in early phase trials. We recently showed that there has been a meaningful increase in response rate in phase 1 trials for haematologic malignancies;19 however, a study focusing on solid tumors is lacking.
The National Cancer Institute’s (NCI) Cancer Therapy Evaluation Program (CTEP) is the foremost sponsor of early phase clinical trials through the Experimental Therapeutics Clinical Trials Network, which consists of NCI-designated academic cancer centers in the United States and Canada. From 1974 to 1982, the response rate in CTEP-sponsored phase 1 trials was 4.2%.5 A follow-up CTEP analysis showed that the response rate in phase 1 trials was slightly improved to 10.6% in 1991–2002, with no significant trend observed for improvement within this period.1 Notably, these studies analyzed response and toxicity for trials predominantly using cytotoxic chemotherapy and combined solid tumor and haematologic malignancies. We report here recent trends in treatment-related deaths, and response rates for solid tumors, leveraging the large database of CTEP sponsored phase 1 clinical trials over the last 20 years in recognition of the impact of the National Cancer Act20 on its 50th anniversary.
Methods
Study population
We examined data for all patients with solid tumors receiving treatment on CTEP-sponsored, investigator-initiated phase 1 oncology trials conducted between January 2000 and May 2019. Patients with neurological cancers, haematological malignancies, and those treated in phase 1/2 clinical trials were excluded from the study analysis. Also, patients only receiving radiation therapy were not included in the study. CTEP collects comprehensive information at bi-weekly intervals from investigators and actively monitors the trials through regularly scheduled periodic audits. CTEP maintains a patient-level, comprehensive trials data, including patient demographics, agent toxicity, and efficacy data.
Agents used in the trials analyzed were grouped by investigators (D.C., L.M.C, and N.T.) according to the mechanism of action (Supplemental Table 1). Combination therapy consist of investigational new drugs alone, investigational drug and a Food and Drug Administration (FDA)-approved agent, and FDA approved drugs alone aimed at a new clinical indication structured through CTEP agreements with industry partners.21 The database does not include trial design nor the status of the agent (FDA approved or not at the time of trial conduct) under investigation.
Toxicity grade was based on the Common Terminology Criteria for Adverse Events (CTCAE), and attribution of all grade 5 adverse events to the intervention was assessed by the phase 1 study investigators when reported to CTEP. The patient’s response to treatment was determined based on the Response Evaluation Criteria in Solid Tumors (RECIST) 1.0 introduced in 2000 by the international RECIST Working Group. An updated version, RECIST 1.1, was released in 2009. Concordance between the two versions regarding responses to treatment is high.22 Best response to the treatment was reported by the investigator for each patient if available according to the standard response criteria used at that time for each disease.
Statistical analysis
This study assessed risks of treatment-related death (grade 5 toxicity ratings possibly, probably, or definitely attributable to treatment), all on-treatment deaths (deaths during protocol treatment regardless of attribution), grade 3/4 toxicity, and proportion of overall response and complete response rate on phase 1 trials. We defined three time periods, 2000–2005, 2006–2012, and 2013–2016, leading to each period having ≥70 trials initiated and ≥1500 patients enrolled. For each period, the widths of the 95% confidence interval (CI, calculated based on the exact method) are at most 24.4% for study-level endpoints (such as the rate of combination trials) and 5.1% for patient-level toxicity/response rates, respectively. Univariate associations of treatment related deaths and response with patients’ variables were assessed using risk ratio (RR) based on the modified Poisson regression model.23 Each protocol was treated as a cluster, and the p-value of the Wald test was computed based on the sandwich variance estimator for clustering. The results were also verified by the mixed-effects logistic regression model. We compared cancer-specific response and toxicity rates among the three periods based on a logistic regression model by including the period as a covariate. A multivariable Poisson regression model was also fitted to adjust for patient baseline variables. All analyses were performed in R Studio version 2022.02.1.
Results
Trial characteristics
A total of 465 protocols that enrolled 13,847 patients using 261 agents (Supplemental Tables 1, 2) were analyzed (Table 1). Ninety percent of the trials focused only on solid tumors. Ten percent of the trials were “all-comer” trials that enrolled solid tumor, haematologic malignancies and/or neurological cancers; for these trials, only patients with solid tumor were included in the study. Common solid tumors included: ovarian cancer (N=1,518), colon cancer (N=1,438), breast cancer (N=1,010), and lung cancer (N=982). Patients without detailed diagnosis (solid tumor not otherwise specified), rare tumors such as sarcomas or other low incidence cancers were pooled and categorized together as “others” (N=6,735). Although information of the dose escalation method of each trial was not available, the majority of trials in the CTEP sponsored trials utilized the 3+3 design. The median age of study patients was 57 years (range: 0–94). The median number of patients treated per trial was 24 (range: 1–431). Thirty-one percent of trials used an agent as a monotherapy, and 69% of trials used combination therapy. Overall, the most used class of agents was chemotherapy; however, the class of agents used in the trials changed over time (Supplemental Figure 1, Supplemental Table 3). Chemotherapy was less frequently used for 10 years after 2004, but its use became more frequent after 2015, involving up to 60% of recent trials in 2018. There was increased use of checkpoint inhibitors since the late 2000s with approximately one-third of trials using checkpoint inhibitors recently. Anti-angiogenesis agents became less frequently used recently, while DNA repair agents became more frequently used.
Table 1.
Characteristics of the phase 1 trials
| N | ||
|---|---|---|
| Total number of protocols | 465 | |
| Total number of patients | 13,847 | |
| Number of patients with disease | ||
| Bladder | 257 | (1.9%) |
| Breast | 1010 | (7.3%) |
| Colon | 1438 | (10.4%) |
| Kidney | 310 | (2.2%) |
| Lung | 982 | (7.1%) |
| Melanoma | 779 | (5.6%) |
| Ovary | 1518 | (11.0%) |
| Pancreas | 530 | (3.8%) |
| Prostate | 288 | (2.1%) |
| Others | 6735 | (48.6%) |
| Median age of patients (range, 1Q-3Q) | 57 | (0–94, 46–65) |
| Type of phase I | ||
| Solid tumor focused trial* | 418 | (89.9%) |
| Basket trial** | 47 | (10.1%) |
| Median number of patients on trial (range, 1Q-3Q) | 24 | (1–431, 14–37) |
| Trial activation year | ||
| 2000–2005 | 214 | (46.0%) |
| 2006–2012 | 180 | (38.7%) |
| 2013–2019 | 71 | (15.3%) |
| Median days to study completion (range, 1Q-3Q) | 1517 | (4–4794, 1079–2138) |
| Number of trials agents used | ||
| Antiangiogenesis | 71 | (15.3%) |
| Checkpoint inhibitor | 24 | (5.2%) |
| Chemotherapy | 225 | (48.4%) |
| Cytokine | 20 | (4.3%) |
| DNA repair | 35 | (7.5%) |
| Gene/cellular therapy | 8 | (1.7%) |
| Epigenetic modulation | 39 | (8.4%) |
| Monoclonal antibody | 19 | (4.1%) |
| Protein metabolism | 41 | (8.8%) |
| Receptor/signal transduction pathway agent | 136 | (29.2%) |
| Vaccine | 30 | (6.5%) |
| Others (Apoptosis, Immunotoxin, etc.) | 113 | (24.3%) |
| Number of agents used on trial (range, 1Q-3Q) | 2 | (1–12, 1–3) |
| Monotherapy | 144 | (31.0%) |
| Combination | 321 | (69.0%) |
Trials that enrolled only patients with solid tumors
Trials that enrolled patients with solid tumors, hematologic malignancies and/or neurological cancers
Toxicity and deaths in phase 1 trials for solid tumors
A total of 1,111 patients died while on study (8.0%, 95%CI: 7.6–8.5%, Table 2), among these, 93 deaths were attributed to treatment (treatment-related death risk: 0.67%, 95%CI: 0.5–0.8%). Advanced age (RR: 1.02 for each one-year increase in age, 95%CI: 1.01–1.04), performance status (PS) ≥2 (RR: 2.6, 95%CI: 1.2–5.5) and albumin <3.5g/dL (RR: 2.6, 95%: 1.5–4.5) were associated with higher risk of treatment-related deaths (Table 3). The results were consistent with the mixed-effects logistic regression model (Supplemental table 4). Multivariate analysis adjusting cancer type and patient background revealed that albumin <3.5g/dL (RR: 2.5, 95%: 1.5–4.3) was associated with higher risk of treatment-related death (Supplemental table 5). Trials that used anti-angiogenesis and protein metabolism agents, such as heat shock protein inhibitors and proteasome inhibitors, were associated with a higher risk of treatment-related deaths; while trials that used receptor/signal transduction pathway agent were associated with a lower risk of treatment-related deaths. The treatment-related death risks for combination trials, were not higher than the risks for monotherapy trials (0.7% for both).
Table 2.
Treatment-related death and all cause death rate during trials by cancer types
| Number of patients | Number of events | % | 95%CI | ||
|---|---|---|---|---|---|
| Treatment-related death | All patients | 13847 | 93 | 0.67 | (0.54, 0.82) |
| Bladder | 257 | 1 | 0.39 | (0.01, 2.15) | |
| Breast | 1010 | 7 | 0.69 | (0.28, 1.42) | |
| Colon | 1438 | 11 | 0.76 | (0.38, 1.36) | |
| Kidney | 310 | 1 | 0.32 | (0.01, 1.78) | |
| Lung | 982 | 9 | 0.92 | (0.42, 1.73) | |
| Melanoma | 779 | 1 | 0.13 | (0, 0.71) | |
| Ovary | 1518 | 9 | 0.59 | (0.27, 1.12) | |
| Pancreas | 530 | 3 | 0.57 | (0.12, 1.65) | |
| Prostate | 288 | 3 | 1.04 | (0.22, 3.01) | |
| Others | 6735 | 48 | 0.71 | (0.53, 0.94) | |
| Death during trial* | All patients | 13847 | 1111 | 8.02 | (7.58, 8.49) |
| Bladder | 257 | 34 | 13.23 | (9.34, 17.99) | |
| Breast | 1010 | 84 | 8.32 | (6.69, 10.19) | |
| Colon | 1438 | 120 | 8.34 | (6.97, 9.9) | |
| Kidney | 310 | 13 | 4.19 | (2.25, 7.06) | |
| Lung | 982 | 78 | 7.94 | (6.33, 9.81) | |
| Melanoma | 779 | 59 | 7.57 | (5.82, 9.66) | |
| Ovary | 1518 | 43 | 2.83 | (2.06, 3.8) | |
| Pancreas | 530 | 79 | 14.91 | (11.98, 18.23) | |
| Prostate | 288 | 7 | 2.43 | (0.98, 4.94) | |
| Others | 6735 | 594 | 8.82 | (8.15, 9.52) |
Death during trial: all death regardless of attribution
Abbreviations: CI, confidence interval computed using the exact method
Table 3.
Risk factor table for treatment-related death or death during trial
| Treatment-related death | Death during protocol treatment | |||||||||
|---|---|---|---|---|---|---|---|---|---|---|
| N (%) | Number toxicities (%) | RR | 95%CI | p-value | Number events (%) | RR | 95%CI | p-value | ||
| Age | ||||||||||
| Continuous (with 1 increase) | 1.02 | (1.01–1.04) | 0.006 | 1.01 | (1.00–1.01) | 0.009 | ||||
| < 18 | 1169 (8.4) | 3 (0.3) | 0.45 | (0.15, 1.40) | 0.169 | 85 (7.3) | 0.95 | (0.69, 1.30) | 0.739 | |
| 18–59 | 6899 (49.8) | 39 (0.6) | Ref | 528 (7.7) | Ref | |||||
| ≥ 60 | 5778 (41.7) | 51 (0.9) | 1.58 | (1.02, 2.41) | 0.041 | 498 (8.6) | 1.13 | (1.00, 1.27) | 0.050 | |
| Sex | ||||||||||
| Female | 7531 (54.4) | 47 (0.6) | Ref | 529 (7.0) | Ref | |||||
| Male | 6316 (45.6) | 46 (0.7) | 1.21 | (0.80, 1.83) | 0.370 | 582 (9.2) | 1.17 | (1.03, 1.33) | 0.370 | |
| PS | ||||||||||
| 0–1 | 6460 (94.1) | 43 (0.7) | Ref | 482 (7.5) | Ref | |||||
| ≥2 | 404 (5.9) | 7 (1.7) | 2.62 | (1.24, 5.54) | 0.011 | 110 (27.3) | 3.16 | (2.52, 3.97) | <0.001 | |
| BMI | ||||||||||
| Continuous | 1.01 | (0.97, 1.06) | 0.554 | 0.97 | (0.95, 0.98) | <0.001 | ||||
| <18.5 | 257 (3.7) | 1 (0.4) | 0.56 | (0.08, 3.80) | 0.556 | 36 (14.0) | 1.41 | (1.00, 1.98) | 0.052 | |
| 18.5–25 | 2489 (35.6) | 18 (0.7) | Ref | 257 (10.3) | Ref | |||||
| 25–30 | 2395 (34.2) | 15 (0.6) | 0.88 | (0.46, 1.67) | 0.688 | 196 (8.2) | 0.84 | (0.68, 1.04) | 0.104 | |
| ≥ 30 | 1858 (26.5) | 16 (0.9) | 1.18 | (0.57, 2.44) | 0.652 | 115 (6.2) | 0.62 | (0.50, 0.78) | <0.001 | |
| Albumin | ||||||||||
| Continuous | 0.47 | (0.30, 0.72) | 0.001 | 0.32 | (0.29, 0.37) | < 0.001 | ||||
| ≥ 3.5 g/dL | 3856 (68.7) | 20 (0.5) | Ref | 190 (4.9) | Ref | |||||
| < 3.5 g/dL | 1757 (31.3) | 23 (1.3) | 2.62 | (1.51, 4.54) | <0.001 | 300 (17.1) | 3.38 | (2.80, 4.08) | < 0.001 | |
| Hemoglobin | ||||||||||
| Continuous | 1.01 | (0.84, 1.21) | 0.925 | 0.79 | (0.75, 0.83) | < 0.001 | ||||
| ≥ 12.0 g/dL | 3513 (52.3) | 22 (0.6) | Ref | 185 (5.3) | Ref | |||||
| < 12.0 g/dL | 3209 (47.7) | 27 (0.8) | 1.32 | (0.79, 2.20) | 0.288 | 395 (12.3) | 2.15 | (1.76, 2.64) | < 0.001 | |
| Study Activation Year | ||||||||||
| 2000–2005 | 5882 (42.5) | 44 (0.7) | Ref | 327 (5.6) | Ref | |||||
| 2006–2012 | 6220 (44.9) | 37 (0.6) | 0.76 | (0.48, 1.21) | 0.249 | 614 (9.9) | 1.49 | (1.13, 1.98) | 0.005 | |
| 2013–2019 | 1745 (12.6) | 12 (0.7) | 0.94 | (0.47, 1.82) | 0.830 | 170 (9.7) | 1.65 | (1.15, 2.36) | 0.006 | |
| Investigational Agent | ||||||||||
| Antiangiogenesis | 2689 (19.4) | 32 (1.2) | 2.19 | (1.41, 3.39) | <0.001 | 224 (8.3) | 1.06 | (0.77, 1.47) | 0.725 | |
| Checkpoint inhibitor | 817 (5.9) | 5 (0.6) | 0.95 | (0.41, 2.21) | 0.909 | 70 (8.6) | 1.12 | (0.66, 1.90) | 0.681 | |
| Chemotherapy | 6981 (50.4) | 48 (0.7) | 1.03 | (0.66, 1.59) | 0.912 | 432 (6.2) | 0.68 | (0.52, 0.89) | 0.005 | |
| Cytokine | 367 (2.7) | 1 (0.3) | 0.39 | (0.06, 2.50) | 0.320 | 12 (3.3) | 0.49 | (0.26, 0.90) | 0.021 | |
| DNA repair | 1791 (12.9) | 12 (0.7) | 0.91 | (0.47, 1.79) | 0.790 | 152 (8.5) | 1.17 | (0.76, 1.80) | 0.480 | |
| Epigenetic modulation | 1255 (9.1) | 7 (0.6) | 0.82 | (0.41, 1.66) | 0.582 | 139 (11.1) | 1.34 | (0.92, 1.94) | 0.129 | |
| Gene/cellular therapy | 132 (1.0) | 0 (0.0) | NA | NA | NA | 8 (6.1) | 1.00 | (0.29, 3.49) | 1.000 | |
| Monoclonal antibody | 468 (3.4) | 2 (0.4) | 0.66 | (0.16, 2.71) | 0.562 | 25 (5.3) | 0.56 | (0.34, 0.93) | 0.024 | |
| Protein metabolism | 1126 (8.1) | 16 (1.4) | 2.39 | (1.41, 4.06) | 0.001 | 81 (7.2) | 0.94 | (0.66, 1.33) | 0.731 | |
| Receptor/signal transduction pathway | 4029 (29.1) | |||||||||
| agent | 18 (0.4) | 0.60 | (0.36, 1.00) | 0.051 | 362 (9.0) | 1.21 | (0.95, 1.54) | 0.128 | ||
| Vaccine | 773 (5.6) | 1 (0.1) | 0.19 | (0.03, 1.29) | 0.089 | 46 (6.0) | 0.93 | (0.46, 1.88) | 0.847 | |
| Others | 2953 (21.3) | 22 (0.7) | 1.17 | (0.69, 1.96) | 0.559 | 210 (7.1) | 1.00 | (0.72, 1.39) | 0.992 | |
| Combination Therapy | ||||||||||
| Monotherapy | 4108 (29.7) | 28 (0.7) | Ref | 391 (9.5) | Ref | 0.685 | ||||
| Combination Therapy | 9739 (70.3) | 65 (0.7) | 0.99 | (0.61, 1.60) | 0.958 | 720 (7.4) | 0.95 | (0.72, 1.24) | ||
| Trial type | ||||||||||
| Solid tumor focused trial | 12179 (88.0) | 85 (0.7) | Ref | 923 (7.6) | Ref | |||||
| All-comer trial | 1668 (12.0) | 8 (0.5) | 0.70 | (0.33, 1.52) | 0.371 | 188 (11.3) | 1.48 | (1.10, 1.97) | 0.008 | |
Abbreviations: RR, risk ratio; CI, confidence interval; PS, performance status; BMI, body mass index; p-values are obtained using Wald test
Risks of treatment-related deaths did not change over time (2000–2005 vs. 2006–2012 vs. 2013–2019, P=0.52) (Figure 1A) and the RR for the time variable in the multivariable analysis is 0.77 (95%CI, 0.4–1.5, P=0.43). Across all cancers analyzed, the treatment-related death risk was <1%, except for pancreatic cancer (1.04%), with no difference between diseases (P=0.70). No change in treatment-related deaths over time was seen across all cancer types analyzed except for pancreatic cancer, which showed a decreased trend although with limited number of treatment-related deaths throughout (Supplemental Table 6).
Figure 1A:
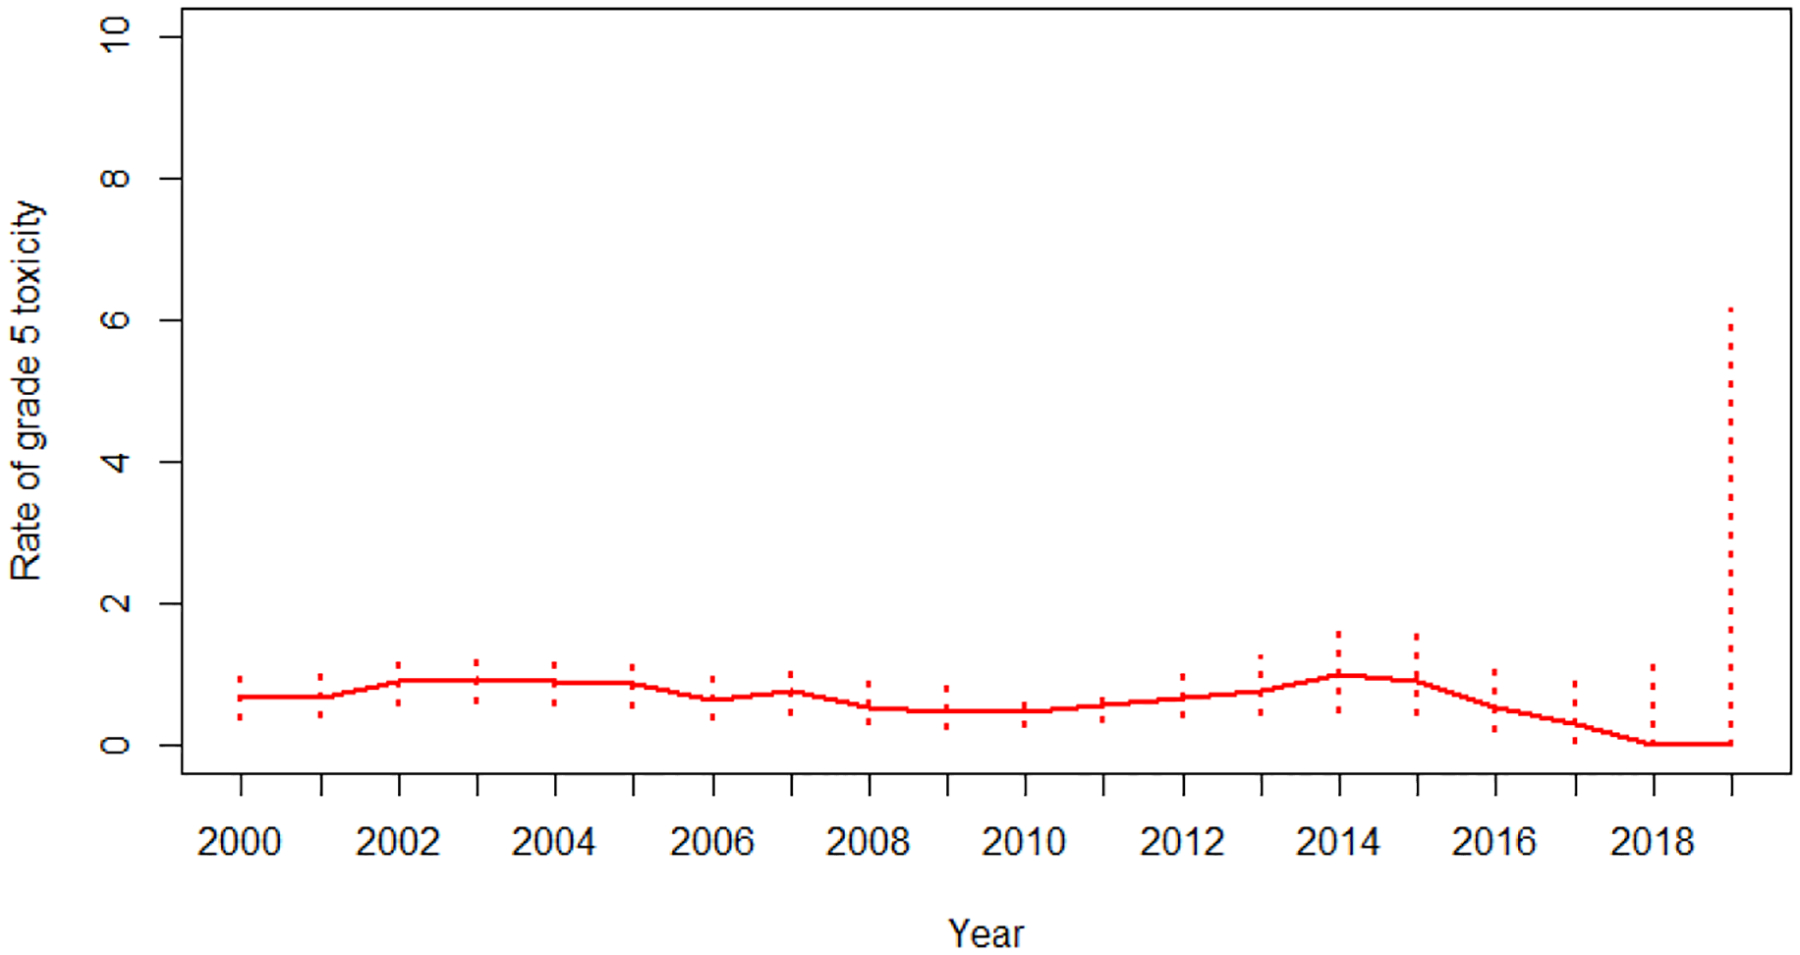
Trend of treatment-related death between 2000 to 2019 with 95% exact confidence interval
Considering all causes of death including death from disease progression during the trial, patients who were older, male, had PS ≥2, albumin <3.5 g/dL, and anemia had a higher risk of death. Patients with higher BMI (≥30) compared to standard BMI (18.5–25.0) had a lower risk of death (Table 3). Intriguingly, trials that used chemotherapy and cytokines showed a lower risk of death. The overall risk of all causes of death during phase 1 trial increased over the period (Supplemental Table 5: 5.6% in 2000–2005, 9.9% in 2006–2012, and 9.7% in 2013–2019). Progression of disease as a cause of death increased over time (69.5% of deaths in 2000–2005, 84.0% in 2006–2012 and 90.9% in 2013–2019). There was a heterogeneity in risk and trend of death-on-trial across diseases; the highest risk of death was seen with pancreatic cancer (14.9%, 95%CI: 12.0–18.2%) and the lowest risk was seen with prostate cancer (2.4%, 95%CI: 1.0–4.9%) (Table 2).
The most common grade 3/4 toxicities in phase 1 trials for solid tumor were haematologic (Supplemental Table 7). Grade 3/4 neutropenia, lymphopenia, anemia and thrombocytopenia occurred in 16.9%, 8.9%, 6.5% and 7.1% of patients, respectively. Febrile neutropenia was observed in 1.6% of patients. Non-hematologic grade 3/4 toxicities were less common, mostly <5% except for fatigue which was observed in 5.1% of patients. No increasing or decreasing trends of specific toxicities were noted over time, except for the neutropenia, which showed a lower risk in 2013–2019 compared to the prior period.
Response rates in phase 1 trials for solid tumor
Response assessment was available for 9,325 patients (67.3%). The overall and complete response rates for all trials during the study period were 12.2% (95%CI: 11.5–12.8%) and 2.7% (95%CI: 2.4–3.0%), respectively. An increase in overall response and complete response rates were seen over time (Figure 1B). Overall response increased from 9.6% to 18.0%, and complete response rates increased from 2.5% to 4.3% from 2000–2005 to 2013–2019 (Table 4). Intriguingly, there was also an increase of stable disease and a decrease of progressive disease as the best response rate in the phase 1 trials (Figure 1B). Patients who experienced clinical benefit (overall response plus stable disease) increased from 48.3% in 2000–2005 to 61.9% in 2013–2019. Patients who were female, had PS 0–1, albumin ≥3.5 g/dL, and hemoglobin ≥12g/dL, experienced higher likelihood of response (Supplemental Table 8). These results were consistent between modified Poisson regression and mixed-effects logistic regression models (Supplemental Table 8). Multivariate analysis adjusting for cancer type and patient background revealed that patients who had albumin ≥3.5g/dL and PS 0–1 had higher chance of response (Supplemental table 5). The trials that used chemotherapy (18.2%), anti-angiogenesis (20.7%), and DNA repair agents (26.5%) were associated with a higher likelihood of response, while trials using cytokines (6.6%), protein metabolism agents (6.2%), epigenetic modulation (5.3%), and vaccines (2.8%) showed a lower likelihood of response. Trials using checkpoint inhibitors had a high overall response rate of 22.9% although without statistical significance (Supplemental table 8). The overall response rate in trials using combination therapy were higher than trials with monotherapy (overall response; 15.8% vs 3.5%, RR: 4.6, 95%CI: 3.1–6.8, p<0.001), and that in all-comer trials was lower than solid tumor focused trials (overall response: 4.1% vs 13.3%, RR: 0.32, 95%CI: 0.2–0.5, p<0.001).
Figure 1B:
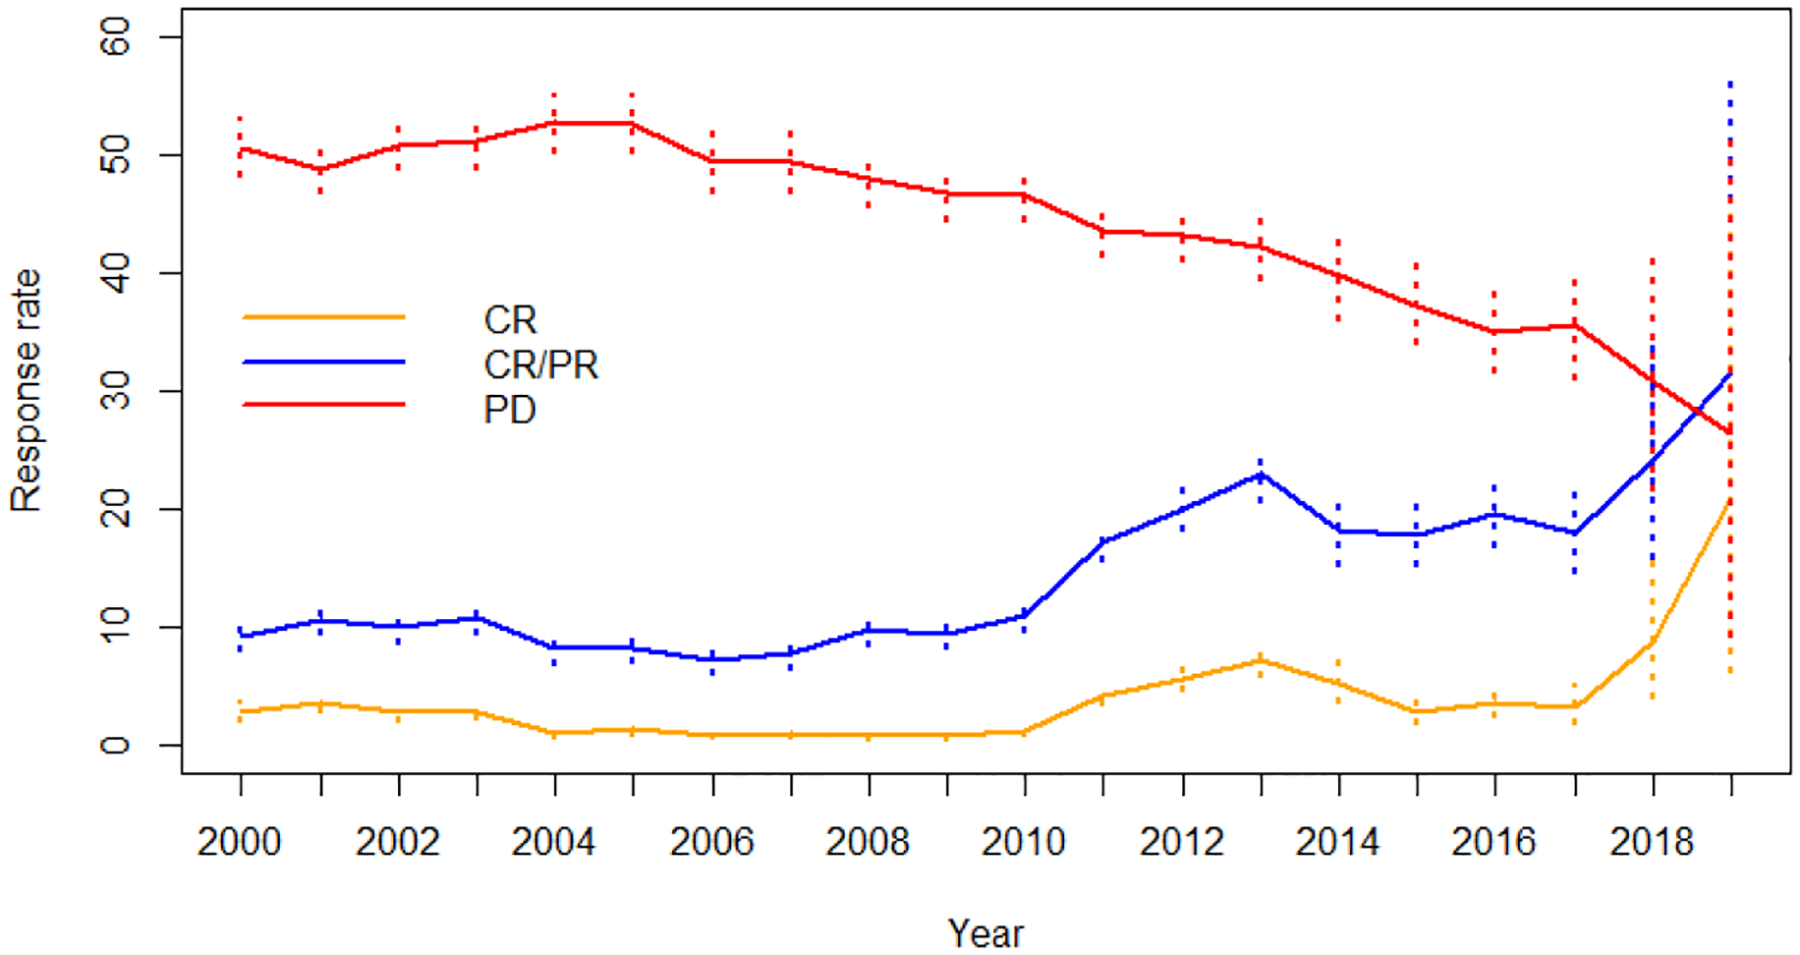
Response trends between 2000 to 2019 with 95% exact confidence interval
Table 4:
Overall and complete response rate with trends by cancer type during 2000 to 2019
| Year | |||||||||||
|---|---|---|---|---|---|---|---|---|---|---|---|
| 2000–2005 | 2006–2012 | 2013–2019 | |||||||||
| Number of patients | % | 95%CI | % | 95%CI | % | 95%CI | % | 95%CI | p-value | ||
| Overall response | All patients | 9325 | 12.2 | (11.5, 12.8) | 9.6 | (8.7, 10.6) | 13.1 | (12.1, 14.2) | 18.0 | (15.7, 20.5) | <0.001 |
| Bladder | 186 | 22.0 | (16.3, 28.7) | 8.5 | (2.4, 20.4) | 22.5 | (10.8, 38.5) | 28.3 | (19.7, 38.2) | 0.006 | |
| Breast | 855 | 15.8 | (13.4, 18.4) | 7.9 | (4.6, 12.5) | 18.4 | (15.4, 21.8) | 16.4 | (7.8, 28.8) | 0.003 | |
| Colon | 1092 | 5.4 | (4.1, 6.9) | 7.7 | (5.7, 10.2) | 2.4 | (1.1, 4.3) | 4.7 | (1.3, 11.5) | 0.002 | |
| Kidney | 276 | 11.6 | (8.1, 16.0) | 3.4 | (1.1, 7.7) | 19.3 | (11.4, 29.4) | 25.0 | (13.2, 40.3) | <0.001 | |
| Lung | 632 | 21.2 | (18.1, 24.6) | 21.3 | (17.1, 26.0) | 14.3 | (9.1, 21.0) | 28.2 | (21.0, 36.3) | 0.255 | |
| Melanoma | 474 | 7.8 | (5.6, 10.6) | 6.7 | (4.2, 10.1) | 4.2 | (1.4, 9.6) | 25.6 | (13.5, 41.2) | 0.006 | |
| Ovary | 656 | 30.5 | (27.0, 34.2) | 14.6 | (9.0, 21.9) | 36.4 | (32.1, 41.0) | 16.7 | (7.9, 29.3) | 0.03 | |
| Pancreas | 375 | 2.9 | (1.5, 5.2) | 1.8 | (0.4, 5.3) | 5.1 | (2.1, 10.2) | 1.4 | (0.0, 7.4) | 0.788 | |
| Prostate | 212 | 6.1 | (3.3, 10.3) | 3.3 | (1.1, 7.5) | 14.6 | (6.5, 26.67 | 0.0 | (0, 60.2) | 0.03 | |
| Others | 4567 | 10.3 | (9.5, 11.2) | 10.1 | (8.8, 11.5) | 9.2 | (8.0, 10.5) | 16.9 | (13.5, 20.7) | 0.012 | |
| Complete response | All patients | 9325 | 2.7 | (2.4, 3.0) | 2.5 | (2.0, 3.0) | 2.4 | (2.0, 3.0) | 4.3 | (3.2, 5.7) | 0.018 |
| Bladder | 186 | 4.8 | (2.2, 9.0) | 0.0 | (0, 7.6) | 0.0 | (0, 8.8) | 9.1 | (4.2, 16.6) | 0.001 | |
| Breast | 855 | 2.6 | (1.6, 3.9) | 0.0 | (0, 1.8) | 3.2 | (19, 4.9) | 5.5 | (1.1, 15.1) | 0.004 | |
| Colon | 1092 | 0.5 | (0.2, 1.1) | 0.9 | (0.3, 2.0) | 0.0 | (0, 0.9) | 0.0 | (0, 4.2) | 0.012 | |
| Kidney | 276 | 0.7 | (0.1, 2.6) | 0.0 | (0, 2.5) | 0.0 | (0, 4.4) | 4.6 | (0.6, 15.5) | 0.006 | |
| Lung | 632 | 1.6 | (0.8, 2.9) | 1.8 | (0.6, 3.8) | 0.7 | (0, 3.7) | 2.1 | (0.4, 6.1) | 0.944 | |
| Melanoma | 474 | 1.5 | (0.6, 3.0) | 1.3 | (0.4, 3.2) | 0.0 | (0, 3.1) | 7.0 | (1.5, 19.1) | 0.112 | |
| Ovary | 656 | 9.3 | (7.2, 11.8) | 4.6 | (1.7, 9.8) | 11.4 | (8.7, 14.7) | 1.9 | (0.1, 9.9) | 0.590 | |
| Pancreas | 375 | 0.0 | (0, 1.0) | 0.0 | (0, 2.2) | 0.0 | (0, 2.6) | 0.0 | (0, 4.9) | 1.000 | |
| Prostate | 212 | 0.0 | (0, 1.7) | 0.0 | (0, 2.4) | 0.0 | (0, 6.5) | 0.0 | (0, 60.2) | 1.000 | |
| Others | 4567 | 2.9 | (2.4, 3.4) | 4.1 | (3.2, 5.1) | 1.4 | (0.9, 2.0) | 5.4 | (3.5, 7.9) | 0.114 | |
Abbreviations: CI, confidence interval computed using the exact method; p-values are derived from the likelihood ratio test using the logistic regression model
The response rate and trend over time differed by disease (Table 4). In the most recent time period of 2013–2019, the response rate was 28.3% in bladder cancer, 16.4% in breast cancer, 25.0% in kidney cancer, 28.2% in lung cancer, 25.6% in melanoma, 16.7% in ovarian cancer, 4.7% in colon cancer and 1.4% in pancreatic cancer. There were improvements in overall and complete response rate over time in bladder, breast, ovary, kidney cancer, and melanoma. No improvement was seen in lung cancer although the response rates were relatively high. In contrast, there was no improvement in response rates and remained notably low for pancreatic and colon cancer.
Response rates by class of investigational agents for each cancer are shown in Supplemental Table 9. After chemotherapy, anti-angiogenesis agents were associated with higher response rates for bladder, colon, kidney and ovarian cancer; and DNA repair inhibitors were associated with higher response rates in ovarian and pancreatic cancer. Interestingly, a protein metabolism agent was associated with lower response rate in breast and colon cancer. In all diseases other than pancreatic and prostate cancer, combination therapy was associated with higher response rates.
Discussion
Expectations of direct clinical benefit by participating in phase 1 clinical trials have been historically low for cancer patients, which may influence patients and physicians considering phase 1 trials as therapeutic options. Although meta-analysis studies suggested a potential increase in response rate in more recent phase 1 trials, particularly with targeted agents,17,18,24 these studies were prone to publication bias and were unable to assess individual patient-level characteristics that influence outcomes. These studies also included patients with haematologic malignancies, who generally have a more favorable response to treatment compared to solid tumors. Due to the disease heterogeneity that leads to different drug development pathways in different cancers, disease-specific toxicity and response rate are critical for reference and design for future phase 1 trials. This study showed that there has been a statistically significant improvement in response rates without an increase in the risk of treatment-related death which remained <1% across the entire study period in patients with solid tumors enrolled in CTEP sponsored phase 1 trials. Notable heterogeneity of rate and trend in response by trial design (combination vs monotherapy and solid tumor focused vs all-comer), by class of investigational agents and by cancer types was observed. The response rate in the most recent years of 2013–2019 was 18%, which is almost doubled from 9.6% in 2000–2005. This study demonstrates that phase 1 trials in the most recent era offer improved likelihood of response with very low likelihood of treatment-related deaths.
Many paradigm-shifting treatment innovations were introduced during the study period, such as monoclonal antibodies, signaling pathway inhibitors, with one of the most dramatic being immune checkpoint inhibitors.25 The agents evaluated in phase 1 trials in this study reflected the path of drug development in the last 20 years. The response rate in trials using regimens involving anti-angiogenesis agents, checkpoint inhibitors, and DNA repair agents exceeded 20%, while the response in trials testing treatments encompassing protein metabolism agents, cytokine, and vaccine were low with <10%. Although chemotherapy is still the most common agent used, almost all are combined with other targeted treatments; checkpoint inhibitors are now used in over 30% of trials. This study suggests that newer agent regimens evaluated in phase 1 trials and rationally designed therapeutic combinations are contributing to increasing response rates without increasing toxicity. However, the response rate in CTEP sponsored monotherapy trials remains low (3.5%), underscoring the difficulty in developing such regimens for the at large cancer patient populations who do not have a treatment selection biomarker.
This comprehensive analysis of response and toxicity in CTEP sponsored phase 1 trials also demonstrated profound heterogeneity in response rate among different cancer types. The response rate was the highest in bladder, kidney, lung cancer, and melanoma in the most recent era. A common feature of these tumor types is that response may be attributed to rapidly evolving treatment paradigms including combination therapy regimens incorporating anti-angiogenesis inhibitors, immune checkpoint inhibitors, and DNA repair inhibitors. In the meantime, there has been no improvement in pancreatic and colon cancer. Our data indicated that there is an unmet need for novel therapeutics in high-risk colorectal cancer,26 and pancreatic cancer, which had a less than 2% response rate in the most recent era. Patients with pancreatic and colon cancer who benefit from recent novel agents such as checkpoint inhibitors beyond standard combination chemotherapy are limited. These results indicate an unmet need for patients requiring additional understanding of disease biology and the development of agents with new mechanisms of action for these cancers.
This analysis has limitations related to study selection and generalizability of the results. The study summarized CTEP-sponsored phase 1 trials that often involved combination trials structured through CTEP agreements with industry partners and conducted by academia collaborators.21 CTEP attempts to fill in the many critical gaps in the national cancer research effort and avoid duplication of ongoing industry partners efforts. CTEP encourages investigators to propose and design rational combination studies based on compelling in vitro and in vivo preclinical data. These trials were funded based on the strength of preclinical studies.27 The general perception of phase 1 trials is equivalent to a first-in-human single-agent trials. Such trials are underrepresented in the current study. The current study is descriptive in nature. Although we did multivariable analyses to adjust for few patient baseline characteristics, there may present other unobserved confounders which need more sensitivity analyses. Therefore, increasing response rates seen in this study need to be interpreted with caution. Analyses examining cancer type and investigational agent specific response had small numbers of patients and were subject to sparse-data bias.28 In addition, we could not assess several important factors that may impact response rate including whether patients were treated in dose escalation cohort or in dose expansion cohort, the number of lines of treatment patients received prior to the investigational agents, and whether patients were selected by biomarkers. Many recent CTEP-sponsored phase 1 trials include one or more tissue agnostic dose-expansion cohorts after dose determination. However, CTEP generally limits expansion cohorts to 12–15 patients unlike some industry sponsored trials that have large expansion cohort with hundreds of patients since expansion cohort in CTEP sponsored phase 1 trials is not designed to evaluate clinical efficacy.29,30 The database lack details to further assess clinical outcomes such as duration of response, progression-free survival and overall survival.
In summary, our data showed that response in CTEP sponsored solid tumor phase 1 trials has almost doubled without increasing treatment related death rate over the past 20 years, although with significant heterogeneity in response rate by trial characteristics and disease. This study presents encouraging safety and response data in modern phase 1 trials for solid tumors and provides an important framework for oncologists to discuss participation with patients. To further characterize outcomes of modern phase 1 trials, collaborative work to build a more comprehensive and complete real-world database is warranted.
Supplementary Material
Acknowledgment:
This research was supported by the Intramural Research Program of the National Cancer Institute/National Institutes of Health and by the Division of Cancer Treatment and Diagnosis, Cancer Therapy Evaluation Program and Biometrics Research Branch.
Conflict-of-interest Disclosure:
CRF has served as a consultant for AbbVie Inc., AstraZeneca, Bayer, BeiGene, Bristol Meyers Sqibb/Celgene Corporation, Denovo Biopharma LLC, Genentech/Roche Pharma, Genmab, Gilead Sciences, Inc., Karyopharm Therapeutics, Morphosys AG, Pharmacyclics/Janssen Pharmaceuticals, Inc., Seagen, and Spectrum Pharmaceuticals, Inc. He has research funding to the institution from 4D, AbbVie Inc., Acerta Pharma, LLC, Adaptimmune, Allogene Therapeutics, Amgen Inc., Bayer, Celgene Corporation, Cellectis, EMD, Gilead Sciences, Inc., Genentech/Roche Pharma, Guardant, Iovance Biotherapeutics, Janssen Pharmaceuticals, Inc., Kite Pharma, MorphoSys AG, Nektar Therapeutics, Novartis, Pfizer, Pharmacyclics, Sanofi, Takeda Pharmaceutical Company, TG Therapeutics, Inc., Xencor, Ziopharm, Burroughs Wellcome Fund, Eastern Cooperative Oncology Group, National Cancer Institute, V Foundation for Cancer Research, and the Cancer Prevention and Research Institute of Texas where he is a CPRIT Scholar in Cancer Research.
LJN has received research support from BMS/Celgene, Caribou Biosciences, Epizyme, Genentech, Gilead/Kite, IGM Biosciences, Janssen, Novartis, Takeda, TG Therapeutics and has served as consultant for ADC Therapeutics, Bayer, BMS/Celgene, Epizyme, Genentech, Gilead/Kite, Janssen, Morphosys, Novartis, Takeda, and TG Therapeutics.
RL has served as a consultant for Monte Rosa Therapeutics, Inc.
DC, RL, SRF, NMC, YF, EPH, LVR, SPI, JHD, and NT has no conflict of interest.
Footnotes
Publisher's Disclaimer: This is a PDF file of an unedited manuscript that has been accepted for publication. As a service to our customers we are providing this early version of the manuscript. The manuscript will undergo copyediting, typesetting, and review of the resulting proof before it is published in its final form. Please note that during the production process errors may be discovered which could affect the content, and all legal disclaimers that apply to the journal pertain.
References
- 1.Horstmann E, McCabe MS, Grochow L, et al. Risks and benefits of phase 1 oncology trials, 1991 through 2002. N Engl J Med 2005; 352(9): 895–904. [DOI] [PubMed] [Google Scholar]
- 2.Roberts TG Jr., Goulart BH, Squitieri L, et al. Trends in the risks and benefits to patients with cancer participating in phase 1 clinical trials. JAMA 2004; 292(17): 2130–40. [DOI] [PubMed] [Google Scholar]
- 3.Von Hoff DD, Turner J. Response rates, duration of response, and dose response effects in phase I studies of antineoplastics. Invest New Drugs 1991; 9(1): 115–22. [DOI] [PubMed] [Google Scholar]
- 4.Decoster G, Stein G, Holdener EE. Responses and toxic deaths in phase I clinical trials. Ann Oncol 1990; 1(3): 175–81. [DOI] [PubMed] [Google Scholar]
- 5.Estey E, Hoth D, Simon R, Marsoni S, Leyland-Jones B, Wittes R. Therapeutic response in phase I trials of antineoplastic agents. Cancer Treat Rep 1986; 70(9): 1105–15. [PubMed] [Google Scholar]
- 6.Abernethy ER, Campbell GP, Hianik RS, et al. Reassessing the measurement and presence of therapeutic misconception in a phase 1 setting. Cancer 2021; 127(20): 3794–800. [DOI] [PubMed] [Google Scholar]
- 7.Reeder-Hayes KE, Roberts MC, Henderson GE, Dees EC. Informed Consent and Decision Making Among Participants in Novel-Design Phase I Oncology Trials. J Oncol Pract 2017; 13(10): e863–e73. [DOI] [PMC free article] [PubMed] [Google Scholar]
- 8.Kimmelman J Is Participation in Cancer Phase I Trials Really Therapeutic? J Clin Oncol 2017; 35(2): 135–8. [DOI] [PMC free article] [PubMed] [Google Scholar]
- 9.Agrawal M, Emanuel EJ. Ethics of phase 1 oncology studies: reexamining the arguments and data. JAMA 2003; 290(8): 1075–82. [DOI] [PubMed] [Google Scholar]
- 10.Italiano A, Massard C, Bahleda R, et al. Treatment outcome and survival in participants of phase I oncology trials carried out from 2003 to 2006 at Institut Gustave Roussy. Ann Oncol 2008; 19(4): 787–92. [DOI] [PubMed] [Google Scholar]
- 11.Bedard PL, Hyman DM, Davids MS, Siu LL. Small molecules, big impact: 20 years of targeted therapy in oncology. Lancet 2020; 395(10229): 1078–88. [DOI] [PubMed] [Google Scholar]
- 12.Iasonos A, O’Quigley J. Randomised Phase 1 clinical trials in oncology. Br J Cancer 2021; 125(7): 920–6. [DOI] [PMC free article] [PubMed] [Google Scholar]
- 13.Burris HA 3rd. Correcting the ASCO position on phase I clinical trials in cancer. Nature reviews Clinical oncology 2020; 17(2): 125. [DOI] [PubMed] [Google Scholar]
- 14.Sisk BA, Dubois J, Hobbs BP, Kodish E. Reprioritizing Risk and Benefit: The Future of Study Design in Early-Phase Cancer Research. Ethics Hum Res 2019; 41(6): 2–11. [DOI] [PMC free article] [PubMed] [Google Scholar]
- 15.Koyfman SA, Agrawal M, Garrett-Mayer E, et al. Risks and benefits associated with novel phase 1 oncology trial designs. Cancer 2007; 110(5): 1115–24. [DOI] [PubMed] [Google Scholar]
- 16.Abarams J, Casadei JM, Rhie JK, et al. A Handbook for Clinical Investigators Conducting Therapeutic Clinical Trials Supported by CTEP, DCTD, NCI. https://ctepcancergov/investigatorResources/investigators_handbookhtm 2014; (https://ctep.cancer.gov/investigatorResources/investigators_handbook.htm).
- 17.Chakiba C, Grellety T, Bellera C, Italiano A. Encouraging Trends in Modern Phase 1 Oncology Trials. N Engl J Med 2018; 378(23): 2242–3. [DOI] [PubMed] [Google Scholar]
- 18.Schwaederle M, Zhao M, Lee JJ, et al. Association of Biomarker-Based Treatment Strategies With Response Rates and Progression-Free Survival in Refractory Malignant Neoplasms: A Meta-analysis. JAMA Oncol 2016; 2(11): 1452–9. [DOI] [PubMed] [Google Scholar]
- 19.Chihara D, Huang EP, Finnigan SR, et al. Trends in Grade 5 Toxicity and Response in Phase I Trials in Hematologic Malignancy: 20-Year Experience From the Cancer Therapy Evaluation Program at the National Cancer Institute. J Clin Oncol 2022; 40(17): 1949–57. [DOI] [PMC free article] [PubMed] [Google Scholar]
- 20.Kaluzny AD, O’Brien DM. How vision and leadership shaped the U.S. National Cancer Institute’s 50-year journey to advance the evidence base of cancer control and cancer care delivery research. Health Policy Open 2020; 1: 100015. [DOI] [PMC free article] [PubMed] [Google Scholar]
- 21.List of Agents Available Under CTEP Collaborative Agreements for Clinical and Non-clinical Studies (https://ctep.cancer.gov/industryCollaborations2/agreements_agents_table.htm). 2021. https://ctep.cancer.gov/industryCollaborations2/agreements_agents_table.htm (accessed 05/30 2021).
- 22.Kim JH. Comparison of the RECIST 1.0 and RECIST 1.1 in patients treated with targeted agents: a pooled analysis and review. Oncotarget 2016; 7(12): 13680–7. [DOI] [PMC free article] [PubMed] [Google Scholar]
- 23.Zou GY, Donner A. Extension of the modified Poisson regression model to prospective studies with correlated binary data. Stat Methods Med Res 2013; 22(6): 661–70. [DOI] [PubMed] [Google Scholar]
- 24.Mackley MP, Fernandez NR, Fletcher B, Woolcott CG, Fernandez CV. Revisiting Risk and Benefit in Early Oncology Trials in the Era of Precision Medicine: A Systematic Review and Meta-Analysis of Phase I Trials of Targeted Single-Agent Anticancer Therapies. JCO Precision Oncology 2021; (5): 17–26. [DOI] [PubMed] [Google Scholar]
- 25.Adashek JJ, LoRusso PM, Hong DS, Kurzrock R. Phase I trials as valid therapeutic options for patients with cancer. Nature reviews Clinical oncology 2019; 16(12): 773–8. [DOI] [PMC free article] [PubMed] [Google Scholar]
- 26.Kam AE, Pendurti G, Shah UH, et al. Survival outcome and prognostic model of patients with colorectal cancer on phase 1 trials. Invest New Drugs 2019; 37(3): 490–7. [DOI] [PMC free article] [PubMed] [Google Scholar]
- 27.Parchment RE, Doroshow JH. Pharmacodynamic endpoints as clinical trial objectives to answer important questions in oncology drug development. Semin Oncol 2016; 43(4): 514–25. [DOI] [PMC free article] [PubMed] [Google Scholar]
- 28.Greenland S, Mansournia MA, Altman DG. Sparse data bias: a problem hiding in plain sight. BMJ 2016; 352: i1981. [DOI] [PubMed] [Google Scholar]
- 29.Paller CJ, Bradbury PA, Ivy SP, et al. Design of phase I combination trials: recommendations of the Clinical Trial Design Task Force of the NCI Investigational Drug Steering Committee. Clinical cancer research : an official journal of the American Association for Cancer Research 2014; 20(16): 4210–7. [DOI] [PMC free article] [PubMed] [Google Scholar]
- 30.Manji A, Brana I, Amir E, et al. Evolution of clinical trial design in early drug development: systematic review of expansion cohort use in single-agent phase I cancer trials. J Clin Oncol 2013; 31(33): 4260–7. [DOI] [PubMed] [Google Scholar]
Associated Data
This section collects any data citations, data availability statements, or supplementary materials included in this article.