

Abstract
The respiratory tract is an important route for beneficial drug aerosol or harmful particulate matter to enter the body. To assess the therapeutic response or disease risk, whole-lung deposition models have been developed, but were limited by compartment, symmetry or stochastic approaches. In this work, we proposed an imaging-based subject-specific whole-lung deposition model. The geometries of airways and lobes were segmented from computed tomography (CT) lung images at total lung capacity (TLC), and the regional air-volume changes were calculated by registering CT images at TLC and functional residual capacity (FRC). The geometries were used to create the structure of entire subject-specific conducting airways and acinar units. The air-volume changes were used to estimate the function of subject-specific ventilation distributions among acinar units and regulate flow rates in respiratory airway models. With the airway dimensions rescaled to a desired lung volume and the airflow field simulated by a computational fluid dynamics model, particle deposition fractions were calculated using deposition probability formulae adjusted with an enhancement factor to account for the effects of secondary flow and airway geometry in proximal airways. The proposed model was validated in silico against existing whole-lung deposition models, three-dimensional (3D) computational fluid and particle dynamics (CFPD) for an acinar unit, and 3D CFPD deep lung model comprising conducting and respiratory regions. The model was further validated in vivo against the lobar particle distribution and the coefficient of variation of particle distribution obtained from CT and single-photon emission computed tomography (SPECT) images, showing good agreement. Subject-specific airway structure increased the deposition fraction of 10.0-μm particles and 0.01-μm particles by approximately 10%. An enhancement factor increased the overall deposition fractions, especially for particle sizes between 0.1 and 1.0 μm.
1. Introduction
The human airways are the pathways for both inhaled noxious particulate matter and pharmacological aerosol. Due to genetic abnormalities, poor lung growth in early life, and lung diseases, alterations in airway structure may lead to differential deposition patterns of inhaled aerosol that could affect disease risk (Bourbeau et al., 2022) and therapeutic response (Vameghestahbanati et al., 2021). Thus, it is critical to understand the relationships of particle deposition patterns to airway structures and lung functions of individuals characterized by various risk factors and disease severities.
Several examples of airway-structure risk factors include airway-branch variation and dysanapsis. Airway variants are associated with an increase in chronic obstructive pulmonary disease (COPD) prevalence among non-smokers and smokers (Smith et al., 2018). Dysanapsis is associated with COPD incidence and lung functional decline (Smith et al., 2020; Tanabe et al., 2019). With large data acquired by multi-center studies, machine learning has been applied to identify disease subgroups (subpopulations, subtypes, or clusters) using computed tomography (CT) imaging metrics (Lin et al., 2018; Castaldi et al., 2020; Lin et al., 2021). For example, clusters have been identified from asthmatic subjects (Choi et al., 2017b), current smokers (Haghighi et al., 2018) and former smokers (Haghighi et al., 2019; Zou et al., 2021). In addition, lung-tissue latent traits have been extracted from CT lung images (Li et al., 2021). While the associations between clinical data and imaging phenotypes within clusters have been established, local and global mechanistic phenotypes, e.g. airway resistance and particle deposition derived by computational fluid and particle dynamics (CFPD), are yet to be investigated for the benefit-risk analysis of inhaled aerosols within clusters. While the cluster-guided high-fidelity three-dimensional (3D) CFPD subject-specific strategy has been employed to assess preferential particle deposition patterns in cluster-representative archetypes of severe asthmatics (Choi et al., 2019a; Rajaraman et al., 2020), the high computational cost of 3D CFPD limited its application to a few subjects with finite airway branches for site studies. Thus, there is a need to develop a computation-efficient one-dimensional (1D) subject-specific whole-lung deposition model that allows for assessment of lung structure-deposition relationships in individuals and subpopulations (Hofmann, 2011). This model would complement 3D CFPD by enabling organ-level deposition assessments and segment-level site studies in regions of interest under the notion of multi-scale simulations (Miyawaki et al., 2017). The rationale behind this work is also in alignment with the opinion piece on tackling multi-scale in silico models of the whole-lungs for large population studies (Koullapis et al., 2019).
Several theoretical models were developed to study particle deposition in human lungs. Yeh and Schum (1980) developed an 1D airway model based on a silicone rubber replica cast of human tracheobronchial airways from a 60 year old male Caucasian (Raabe et al., 1976). The model can be described as a typical path for the whole lung (typical-path symmetric) or 5 typical paths for lobes (5-lobe symmetric). The former assumes symmetry and dichotomy for all bifurcations, whereas the latter considers intra-subject variation only for main and lobar bronchi in the first few generations. The demarcation between conducting and respiratory airways is fixed at a specific generation of the entire lung for the typical-path symmetric model or each lobe for the 5-lobe symmetric model. The deposition probability is calculated using analytical formulae in a straight cylindrical pipe for three deposition mechanisms: diffusion, sedimentation, and impaction.
Hofmann et al. (Hofmann and Koblinger, 1990; Koblinger and Hofmann, 1990) developed a Monte-Carlo stochastic deposition model that randomly selects the geometry of branches one at a time along the path of an inhaled particle based on the statistics of morphometric data (Raabe et al., 1976) and computes the deposition probabilities (Yeh and Schum, 1980; Schum and Yeh, 1980). As a consequence, it avoids the reconstruction of the entire airway tree. Asgharian et al. (2001) developed a multiple-path particle dosimetry (MPPD) models consisting of ten asymmetric tracheobronchial tree models generated by the stochastic model (Hofmann and Koblinger, 1990; Koblinger and Hofmann, 1990). These models were used to represent individual healthy adult male subjects to study inter-subject deposition variability. It is noted that the above typical-path symmetric, 5-lobe symmetric, stochastic, and MPPD models were all based on the same morphometric data of an old male subject (Raabe et al., 1976).
Semi-empirical models introduced by the International Commission on Radiological Protection (ICRP) model (Bair, 1989) calculated radiation doses to the respiratory tract of workers resulting from the intake of airborne radionuclides. In the ICRP model, airway structure is divided into a multi-filter model, including nasopharyngeal and oropharyngeal region, bronchial region, bronchiolar region, and alveolar-interstitial region. Instead of calculation based on a detailed airway tree model, the ICRP model divides subjects into men, women, and children, providing a quick estimation of particle deposition in each region.
3D CFPD has been employed to study particle deposition in human airway models. For example, Hofemeier et al. (2018) created a detailed 3D sub-acinar structure generated by the algorithm of Koshiyama and Wada (2015) that would capture the statistics of human acinar morphometry (Ochs et al., 2004). Koullapis et al. (2018, 2020) introduced a 3D deep lung model to simulate particle deposition in conducting and acinar regions. The airway geometry in this model comprised ten distal generations of Yeh-Schum 5-lobe symmetric conducting airways coupled to multiple sub-acinar models – a variant of Hofemeier’s 10-generation sub-acinus model (Hofemeier et al., 2018). Tian et al. (2015) applied a stochastic individual path (SIP) model to generate an individual continuous pathway extending from the third bifurcation to a terminal bronchiole in each of the five lobes, based on Yeh-Schum 5-lobe symmetric model (Yeh and Schum, 1980). Kolanjiyil and Kleinstreuer (2017) developed a whole-lung airway model (WLAM) consisting of subject-specific upper airways from mouth/nose to generation 3, triple bifurcation units (TBUs) for generations 4-15, alveolated TBUs for generations 16-21 and a double bifurcation unit (DBU) for generations 22-23, where TBUs were based on morphometric measurements of human lung casts with symmetric branching (Weibel, 2009).
From in vitro and in vivo studies, Lippmann (2022) and Stahlhofen et al. (1989) derived simple analytical expressions for the deposition efficiencies of the nasal passages, larynx, and upper and lower thoracic airways. De Backer et al. (2010) compared the particle deposition from single-photon emission computed tomography (SPECT) with 3D CFPD in CT-based airway models of six asthmatic subjects. The authors showed good agreement between CFPD and CT/SPECT in lobar airflow distribution and concluded that heterogeneity in ventilation patterns could be detected with CT/SPECT and CFPD with appropriate boundary conditions.
In this work, we present a computation-efficient CT imaging-based subject-specific 1D whole-lung deposition model. This model is based on the framework of our previous 3D-1D CFPD subject-specific lung models Lin et al. (2018, 2021), which could predict 1D airflow distribution for the whole lungs (Yin et al., 2010; Yoon et al., 2020) and 3D airflow and particle deposition in airways of limited generation or pathway for site studies (Choi et al., 2019a, 2019b). The subject-specificity is achieved by incorporating CT-resolved airway trees and lobes (structure) and CT image-registration-derived regional airflow change/ventilation (function) into CFPD modeling. The current model consists of three new features: a registration-based respiratory tree model characterized by intra-acinar isotropic expansion/contraction and inter-acinar variability, rescaling of airway dimensions for transition from conducting to respiratory regions and from total lung capacity (TLC) to a desired lung volume (LV), and an empirically-determined enhancement factor that accounts for the effects of secondary flow and airway geometry to improve the accuracy of deposition prediction in proximal airways. The proposed model would be validated in silico against 1D whole-lung deposition models, 3D CFPD acinar simulations, and 3D deep lung simulations as well as in vivo against our combined CT and SPECT imaging human subject experiments.
2. Methods
2.1. Human subject data and image processing
CT lung image data of 7 non-smoking subjects acquired from the Multi-Ethnic Study of Atherosclerosis (MESA) study were used for model development, while CT and SPECT lung image data of 8 subjects with chronic obstructive pulmonary disease (COPD) acquired at the University of Iowa were used for model validation. The study protocols were approved by respective Institutional Review Boards. Each CT/SPECT subject had three visits at 0, 12, and 24 months, amounting to a total of 24 datasets with 6, 3, 10 and 5 in the Global Initiative for Chronic Obstructive Lung Disease (GOLD) stage 0, 1, 2 and 3, respectively. Because the sample size for GOLD 1 subjects was too small for statistical analysis, they were grouped into two subgroups of 9 nonsevere-mild subjects (GOLD 0-1) and 15 moderate-severe subjects (GOLD 2-3). CT images provide structural data, whereas SPECT images provide functional data. Each CT/SPECT subject had three static CT scans at TLC, functional residual capacity (FRC) and residual volume (RV), and one dynamic ventilation SPECT scan per visit. Technetium-99m (99mTc) sulfur colloid was used as the radiopharmaceutical for ventilation SPECT imaging. Since the size of sulfur colloid is below 1.0 μm (Krogsgaard, 2004), the aerosol is expected to travel deep into the lung (Sirr et al., 1985). The lobar deposition fractions were estimated by the distributions of the tracer activity of 99mTc sulfur colloid via co-registration of SPECT images and CT images at FRC whose lung volume is close to that of tidal breathing during SPECT imaging. Compared to a control group of 105 healthy non-smokers (Cho et al., 2022), the demography, post-bronchodilator pulmonary function tests and lung volumes for healthy controls and CT/SPECT subjects are: age (years) = 44.6±14.1, 62.3±11.4*, sex (female%) = 51.4, 37.5; BMI (kg/m2) = 25.7±3.6, 27.7±3.6*; height (cm) =176.4±8.6, 166.3±9.0*; FEV1% predicted = 99.5±10.7, 82.3±11.8*; TLC (L)= 5.8±1.3, 6.1±1.3*; RV (L)= 1.7±0.7, 2.0±0.7* (*, p < 0.05).
2.2. Airway models
2.2.1. Conducting airways
All CT scans were processed using VIDA Vision (VIDA Diagnostics, Coralville, Iowa), a commercial software, to segment the airways and lobes. A volume filling algorithm was employed to generate CT-based subject-specific conducting human airways (Tawhai et al., 2000, 2004). The airway models are host-shape dependent because this algorithm uses five CT-segmented lobes as host-shaped boundaries and CT-resolved terminal airways as starting host-specific segments at TLC scan that bifurcates repeatedly to approximately 30,000 acinar units distributed within five lobar cavities. The resulting airway models agreed with morphometric data for normal subjects such as length ratios, path lengths, numbers of branches, branching angles, and branching asymmetry (Tawhai et al., 2000, 2004). We employed a stochastic airway narrowing model for diseased lungs to determine the diameters of CT unresolved airways (Yoon et al., 2020; Choi et al., 2019b). Fig. 1 shows the probabilities of generation numbers of terminal bronchioles of the seven MESA subjects by lobe, which peak at around generation 16.
Fig. 1.
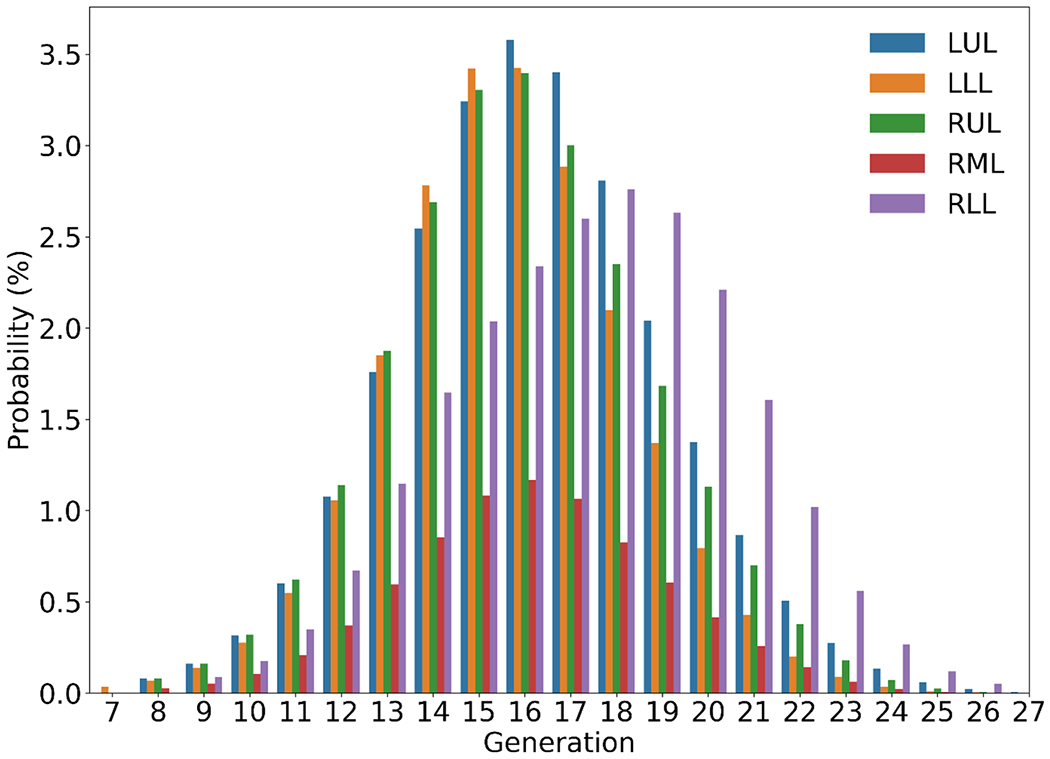
Probability distributions of subject-specific terminal bronchioles by generation (with trachea as generation 0) and by lobe: left upper lobe (LUL), left lower lobe (LLL), right upper lobe (RUL), right middle lobe (RML) and right lower lobe (RLL). Lobar probabilities peak at generation 16 except RLL at 18 where additional branches are needed to reach this lobe.
2.2.2. Respiratory airways with isotropic alveolar wall motion
The respiratory airway modeling process consists of two steps: choose an airway tree model and approximate alveolar wall motion. Here, we adopted an idealized typical-path acinar airway model based on the measurements of human acinar airways on casts by Weibel et al. (2005) (Table 1). The dichotomously regularized model consists of 8 generations of acinar airways starting with a transitional bronchiole as the zeroth generation (z’=0), followed by three generations of respiratory bronchioles, four generations of alveolar ducts, and one generation of terminal alveolar sacs with an average volume of 187 cm3. The mean lengths, inner diameters of airway segments, and the total alveolar surface at a given generation were used to derive the mean velocity inside each airway segment needed for the deposition formulae. The dashed lines outline the control volume inside an airway segment (Fig. 2). On inspiration, Qdi (or Qde) is the flow rate at the inlet (or outlet) of a segment of generation z’. Qa is the flow rate into all alveoli at generation z’. The number of airway segments is . Mass conservation at generation z’ yields Qde·N = Qdi·N – Qa. With normalization by the flow rate at the transitional bronchiole Qdi(z’=0), we obtain:
| (1) |
Table 1.
Regularized dichotomous model of acinar airways from the transitional bronchiole (generation z’= 0) and terminal alveolar sacs (generation z’=8) (Weibel et al., 2005).
| z’ | N | L (mm) | D (mm) | Salv (mm2) | qa | qdi | qde | |
|---|---|---|---|---|---|---|---|---|
| 0 | 1 | 1.40 | 0.50 | 7 | 1.30E-03 | 1.00E+00 | 9.99E-01 | 9.99E-01 |
| 1 | 2 | 1.33 | 0.50 | 23 | 4.28E-03 | 4.99E-01 | 4.97E-01 | 4.98E-01 |
| 2 | 4 | 1.12 | 0.49 | 67 | 1.25E-02 | 2.49E-01 | 2.45E-01 | 2.47E-01 |
| 3 | 8 | 0.93 | 0.40 | 129 | 2.40E-02 | 1.23E-01 | 1.20E-01 | 1.21E-01 |
| 4 | 16 | 0.83 | 0.38 | 219 | 4.07E-02 | 5.99E-02 | 5.73E-02 | 5.86E-02 |
| 5 | 32 | 0.70 | 0.36 | 349 | 6.49E-02 | 2.87E-02 | 2.66E-02 | 2.77E-02 |
| 6 | 64 | 0.70 | 0.34 | 661 | 1.23E-01 | 1.33E-02 | 1.17E-02 | 1.25E-02 |
| 7 | 125 | 0.70 | 0.31 | 1204 | 2.24E-01 | 5.84E-03 | 3.95E-03 | 4.89E-03 |
| 8 | 256 | 0.70 | 0.29 | 2720 | 5.06E-01 | 1.98E-03 | 2.22E-16 | 9.88E-04 |
z’, generation number in acinar airways; N, number of branches; L, mean length of segments; D, mean inner diameter of segments; Salv, total alveolar surface per generation (the sum of Salv over all z’ is ); qa(z’), normalized flow rate into all alveolar sacs per generation calculated by where and ; qdi(z \prime ), normalized flow rate at the inlet of an airway segment calculated by , normalized flow rate at the exit of an airway segment equaling ; the mean normalized flow rate inside an airway segment is . qa, qdi and qde are normalized flow rates by the flow rate at the transitional bronchiole .
Fig. 2.

Schematic of the first four generations for an acinar unit (see also Table 1).
where with k=di, de, and a; and hence qdi(z′ = 0) = 1.
Next, is estimated by assuming isotropic alveolar wall expansion/contraction.
| (2) |
where is the mean outward (or inward) normal velocity of the alveolar wall on expansion (or contraction) calculated by where . With obtained from Eq. (1), the mean normalized flow rate inside an airway segment and the normalized inlet flow rate for the next generation can be calculated. The flow rate at the inlet of a transitional bronchiole (or the exit of a terminal bronchiole) is location and acinus specific (Yin et al., 2010). Thus, while the alveolar wall velocity in an acinar unit is uniform, it varies across acinar units. The mean airway flow rate, the mean airway length and the inner airway diameter are then used to calculate the deposition probabilities.
2.2.3. Rescaling of airway dimensions
The airway dimensions segmented from TLC images are rescaled to a desired LV. The scaling factor below is calculated based on the assumption (Schum and Yeh, 1980) that both airway diameters and lengths in the respiratory region of the lung are proportional to the cube root of LV, while those in the conducting region are proportional to the square root of LV. The scaling factor for conducting airway diameters from TLC to LV reads:
| (3) |
where VD,Y is the volume of dead air space at lung volume Y (Schum and Yeh, 1980). The scaling factor for respiratory airway diameters from TLC to LV reads:
| (4) |
where VR,Y is the volume of respiratory airways at lung volume Y (VR,Y=Y-VD,Y).
The diameters of terminal bronchioles and the volumes of acinar units generated by a volume filling algorithm vary locally, while the diameters of acinar airways and the acinar volume are fixed. To ensure a smooth transition from terminal bronchioles to transitional bronchioles in Weibel’s acinar model, we assumed that the volume of an acinar unit is proportional to the cube of the diameter of its associated terminal bronchiole. The following scaling factors are then applied to adjust acinar airway diameters and acinar volumes from those of Weibel’s model.
| (5) |
| (6) |
where dterminal bronchiole is the diameter of a terminal bronchiole obtained by a volume filling algorithm and is the average diameter of terminal bronchioles. is the average volume of acinar units generated by a volume filling algorithm and VWeibel is the volume of Weibel’s acinar model. The formulae for rescaling the diameters (d) and lengths (l) of conducting and respiratory airways are:
| (7) |
| (8) |
| (9) |
2.3. Particle deposition and enhancement factor
First, we employed an in-house 1D CFD model (Yoon et al., 2020; Choi et al., 2019b) to calculate airflow velocity and pressure fields in subject-specific airways. Second, we calculated aerosol deposition probabilities for each airway segment due to turbulent/laminar/Brownian diffusion, sedimentation, and inertial impaction, using respective analytic formulae derived for flow in a straight cylindrical pipe (Yeh and Schum, 1980; Schum and Yeh, 1980) (supplementary materials; Fig. S1). It is known that a turbulent laryngeal jet is formed downstream of glottal constriction during inspiration. In a realistic non-cylindrical airway geometry, this jet flow can significantly increase particle deposition at bronchial bifurcations (Lin et al., 2007; Miyawaki et al., 2017). It was reported that the theoretically-derived analytical deposition probability formulae (Yeh and Schum, 1980; Schum and Yeh, 1980) under-predict particle deposition in the central airways (Hofmann and Martonen, 1988). Thus, an enhancement factor defined as the ratio of actual total deposition probability to formulae prediction is needed to improve the accuracy of 1D deposition models on inspiration (Hofmann and Koblinger, 1990).
Here, we used data generated by 3D CFPD simulations (Choi et al., 2019a) to develop a regression model for predicting enhancement factors in central/proximal airways. Specifically, we performed both 3D and 1D CFPD simulations on the seven MESA subjects. We then used 3D and 1D data to train a non-linear support vector regression (SVR) model to predict enhancement factors. Based on the correlations of several dimensionless parameters with the enhancement factor, we found that Reynolds number, Stokes number, Schmidt number, shape factor, and airway diameter-to-length ratio are good predictors for the enhancement of deposition in the first 8 airway generations. The shape factor measures the extent of twisting, bending, and branch narrowing of an airway segment. It is defined as the reciprocal of the percentage of the overlapping region between a CT-resolved airway branch and a cylindrical tube defined by the start and end centerline points and the average diameter of the former. The range of shape factors is from 1 (same as a cylindrical tube) to 4 (the overlapped volume is 25% of a tube volume). Some examples of low and high shape factors are shown in Fig. S2 (supplementary materials). In the SVR model, the variables are transformed into hyperplanes in a multidimensional space (feature space), and decision boundaries are found in the hidden layer to fit the data and predict the enhancement factor (Fig. S3).
2.4. Modeling process
The 1D CFPD modeling process consists of steps (a-f) below (Fig. 3).
Fig. 3.

Schematic of the workflow of the subject-specific 1D CFPD model.
Image processing: Segment airways and lobes from TLC images, and register TLC and FRC images to derive air volume change between the two volumes at the image-voxel level.
Airway modeling: Generate entire subject-specific conducting airways and acinar units using TLC images and associate each terminal bronchiole with an acinar unit.
Regional ventilation: Associate each acinar unit with its corresponding image voxels to calculate air volume change between two lung volumes for each unit.
Volume adjustment: Rescale dimensions of conducting airways and respiratory airways from TLC to a desired LV.
Airflow modeling: Perform 1D CFD flow simulations.
Deposition modeling: Perform 1D deposition simulations.
For step (a), we used the commercial software package VIDA Vision for segmentation and airway skeletonization and an in-house code (Yin et al., 2009; Haghighi et al., 2018) for image registration. For step (b), we employed a volume filling method (Tawhai et al., 2000, 2004). For step (c), we followed the subject-specific modeling strategy (Yin et al., 2010). Step (d) was described in a previous section. For step (e), we used our in-house 1D CFD code (Yoon et al., 2020; Choi et al., 2019b). Step (f) was described in a previous section (see also supplementary materials).
In this study, we first considered two sets of tidal (quiet) and deep breathing waveforms (Fig. S4) to compare with previous studies. One set was taken from Koullapis et al. (2020) for 3D CFPD deep lung simulations, including a tidal breathing with a breathing volume of 420 mL and a deep inhalation waveform with a breathing volume of 1680 mL without a breath hold. The other set was taken from Hofemeier et al. (2018) for 3D CFPD acinar simulations. The tidal breathing had a breathing volume of 500 mL and the deep maneuver completed rapid inhalation in 2 s to reach a volume of 1250 mL. The inspiration phase was followed by a breath hold of 4 s, which was then followed by the expiration phase of 4 s.
The tidal breathing waveform is defined as follows.
| (10) |
where Qpeak = (π /T)TV is flowrate at peak inspiration, T is breathing period and TV is tidal volume. For MESA and CT/SPECT subjects, TV is estimated using ideal body weight (IBW) (Fuller and Mohr, 2017).
| (11) |
where IBW = C + 0.9· (height [cm] – 152) with C = 45.5 for female, and 50.0 for male.
The number of replicates for validation against independent in silico data is 8, including 2 for Yeh and Schum (1980), 2 for Mimetikos Preludium (Koullapis et al., 2020), 2 for acinar simulations (Hofemeier et al., 2018) and 2 for deep lung simulations (Koullapis et al., 2020), where 2 corresponds to tidal and deep breathing waveforms.
2.5. Statistical analysis
A t-test was used to measure the difference between two data sets. A p value less than 0.05 (p < 0.05) was considered as statistically significant difference. For cases with p > 0.10, normalized root mean square deviation (NRMSD) was calculated to measure the similarity between them.
3. Results
3.1. Comparison of 3D and 1D CFPD computational times
The average computational times for 3D and 1D CFPD on the MESA subjects were 120.0 and 0.2 hours per subject for flow simulations, respectively, and 36.0 and 0.25 h per subject for particle simulations, respectively. Large-eddy simulation was adopted for 3D CFPD and was executed parallelly on 256 cores (4 compute nodes with 64 cores per node) of National Science Foundation (NSF) Extreme Science and Engineering Discovery Environment (XSEDE) clusters. 1D CFPD was run serially on a single node with 40 cores on the University of Iowa Argon cluster, allowing for simultaneous simulations of 10 particle sizes (capped by memory) for the same subject. The average branch numbers in 3D (from the trachea to around 8th-generation airways with 6 pathways extending to terminal bronchioles) and 1D (whole-lung) conducting airway models were 1,043 and 58,142, respectively. Thus, the total computational times for 3D CFPD (partial lung with one particle size) and 1D CFPD (whole lung with 10 particle sizes) were 156.0 and 0.45 h per subject, respectively.
3.2. Validation against 1D symmetric model simulations
To verify and validate the time-sequence calculation of three deposition mechanisms in human lungs, we replicated the 1D deposition simulations performed by Yeh and Schum (1980) using their typical-path symmetric airway model that excluded the mouth-throat region. We considered simulations at two tidal volumes, 750 mL, and 1450 mL, with the aerodynamic particle diameter ranging from 0.1 to 10.0 μm. A comparison between our simulations and Yeh and Schum (1980) shows good agreement (p > 0.10 and NRMSD = 0.00007 for 420 mL, p > 0.10 and NRMSD = 0.0001 for 1450 mL; Fig. S5). Moreover, we compared the 1D deposition simulations of Koullapis et al. (2020) calculated from a commercial software package Mimetikos Preludium, which was based on Yeh-Schum’s 5-lobe symmetric model. Our simulations are also in good agreement with theirs (Fig. S6) for 420 mL tidal breathing (p > 0.10 and NRMSD = 0.0013) and 1,680 mL deep inhalation (p > 0.10 and NRMSD = 0.0027).
3.3. Validation against 3D CFPD acinar simulations
To validate our 1D acinar model, we simulated the deposition fractions in a single acinar unit and compared with the 3D CFPD acinar simulations performed by Hofemeier et al. (2018). It is noteworthy that the 1D acinar model was based on Weibel’s morphometric data (Weibel et al., 2005), while Hofemeier et al. (2018) adopted a detailed 3D sub-acinar structure (Koshiyama and Wada, 2015). We varied the particle sizes and considered two waveforms of 500 mL tidal breathing and 1250 mL deep breathing with a pause of 4 s. A comparison between them shows good agreement for both waveforms despite the differences in acinar structure (p > 0.10 and NRMSD = 0.0085 for 500 mL; p > 0.10 and NRMSD = 0.015 for 1250 mL; see Fig. S7).
3.4. Validation against 3D CFPD deep lung model simulations
The 3D CFPD deep lung model developed by Koullapis et al. (2020) comprised the last ten generations of Yeh and Schum (1980) symmetric conducting airways coupled with multiple sub-acinus units based on a variant of Hofemeier et al. (2018)s acinar structure. In order to replicate their results for model validation, we adopted the geometrical model of Rajaraman et al. (2020) for the last ten generations of conducting airways with each terminal bronchiole connected to a Weibel-based acinar model. An enhancement factor was not used since the 3D CFPD deep lung model only included distal airways. Fig. 4 shows good agreement between our 1D results and those of the 3D CFPD deep lung model (Koullapis et al., 2020) over a wide range of particle sizes in conducting and respiratory regions during inspiration/expiration using both tidal breathing and deep inhalation (p > 0.10 and NRMSD = 0.028, 0.035, 0.016, 0.023, and 0.027 (tidal breathing) and NRMSD = 0.031, 0.049, 0.032, 0.025, and 0.029 (deep breathing) for conducting inspiration, respiratory inspiration, conducting expiration, respiratory expiration, and total, respectively).
Fig. 4.

Comparison of deposition fractions between 1D CFPD and 3D deep lung model (DLM) by Koullapis et al. (2020). IN=Inspiration, EX=Expiration. (a) 420 mL tidal breathing (p > 0.10, NRMSD = 0.027) and (b) 1250 mL deep breathing (p > 0.10, NRMSD = 0.029).
3.5. Enhancement factor
To assess and improve the accuracy of 1D model prediction, we calculated the ratio of 3D CFPD deposition fractions over 1D deposition fractions for all branches of the MESA subjects, called the “actual” enhancement factor. Fig. 5 shows the distributions of actual enhancement factors in the first 8-generation proximal airways (starting from the trachea as generation 0) by particle diameter, lung region, and airway generation. The results indicate that large enhancement factors center around particle diameters ranging between 0.1 and 1.0 μm. A comparison of SVR model-predicted enhancement factors with actual ones shows good agreement between them (Fig. S8) except for an enhancement factor > 150, where airway segments are twisted and/or narrowed as measured by a shape factor, with a correlation coefficient of r > 0.7 (or r > 0.9 by excluding the outliers having an actual enhancement factor > 150). With the data in Fig. 5, we further developed an empirical function, Eq. (12), to predict the enhancement factor for inspiratory flow in airways at generation j (≤7) based on particle size, shape factor, airway length-to-diameter ratio and Reynolds number.
Fig. 5.

Distributions of enhancement factors in proximal airways and by lobe. Left: (a) central airways such as trachea (generation 0), left main bronchus and right main bronchus (generation 1) and lobar bronchi (generation 2), (b) RUL, (c) LUL, (d) RML, (e) LLL, and (f) RLL.
| (12) |
where α, β, γ and η are model constants listed in Table 2. Repeak is the Reynolds number at peak inspiration with Repeak ≤ 4, 000, SF is shape factor, Dae is aerodynamic particle diameter and l/d is airway length/diameter ratio. This empirical function yields r > 0.6, compared to r > 0.7 of the SVR model.
Table 2.
Model constants used in Eq. (12) for calculating enhancement factors.
| Generation | α | β | γ | η |
|---|---|---|---|---|
| 0 | 9710 | −0.33 | 0.48 | 0.56 |
| 1 | 21,162 | −0.66 | 0.35 | 12.59 |
| 2 | 22,345 | −0.57 | 0.39 | 4.92 |
| 3 | 12,703 | −0.58 | 0.40 | 5.79 |
| 4 | 4986 | −0.23 | 0.52 | 5.33 |
| 5 | 1665 | −0.31 | 0.52 | 14.79 |
| 6 | 388 | −0.33 | 0.50 | 16.35 |
| 7 | 60 | −0.37 | 0.50 | 15.45 |
To inspect deposition mechanisms that are underestimated by probability formulae, Fig. 6 shows the breakdown of contributions by various mechanisms for the cases without and with enhancement. For large particles of around 10.0 μm, sedimentation is dominant, whereas, for small particles around 0.01 μm, diffusion plays a major role in distal airways. For particles between 0.1 and 1.0 μm, the enhancement factor contributes more to laminar diffusion in proximal airways. Since the critical Reynolds number for the transition of laminar flow to turbulent flow in a straight pipe was fixed to 2300, the deposition probability formula for laminar diffusion was used in most branches. This formula did not account for the effects of transient secondary flow in a branching network and realistic airway geometry, leading to underpredicted deposition fractions.
Fig. 6.

Contributions by different deposition mechanisms to total deposition for varying particle sizes predicted by 1D CFPD: (a) without enhancement factor and (b) with enhancement factor. “Brownian motion” and “Sedimentation at end” correspond to and , respectively, in Eq. (S2) (supplementary materials), referring to deposition probabilities of non-penetrating particles calculated by pause equations (Schum and Yeh, 1980).
3.6. Subject-specific model vs symmetric/stochastic model
To compare the deposition features in MESA subject-specific airway models with those of symmetric/stochastic models, Fig. 7 shows the total deposition fractions computed by the subject-specific 1D CFPD along with those of Yeh and Schum (1980)’s symmetric model and Asgharian’s MPPD model (Asgharian et al., 2001) for particle diameter ranging from 0.01 to 10.0 μm. The 1D CFPD deposition fractions without enhancement factor resemble those of Yeh and Schum’s (p > 0.10 and NRMSD = 0.048) and Asgharian’s models (p > 0.10 and NRMSD = 0.051) except for large (10.0 μm) and small (0.01 μm) particles having about 10% difference. The 1D CFPD results with enhancement show significant higher depositions than those without enhancement (p < 0.05), particularly for particle diameter within the range of 0.1 and 1.0 μm.
Fig. 7.

Comparison of total deposition fractions predicted by the subject-specific 1D CFPD with and without enhancement factor, Yeh and Schum (1980) symmetric model (against 1D CFPD without enhancement factor: p > 0.10, NRMSD = 0.048; against 1D CFPD with enhancement factor: p < 0.05) and Asgharian et al. MPPD stochastic model (Asgharian et al., 2001) (against 1D CFPD without enhancement factor: p > 0.10, NRMSD = 0.051; against 1D CFPD with enhancement factor: p < 0.05).
Fig. 8 shows a comparison of the 1D CFPD results with and without enhancement factor in conducting and respiratory airways during inspiration and expiration, respectively. The enhancement factor increases both the deposition in conducting airways on inspiration and the total deposition in the lungs. For 0.01-μm particles, the difference between total depositions with and without enhancement factor is insignificant (p > 0.10 and NRMSD = 0.02). For particle size ranging from 0.1 to 1.0 μm, the deposition in conducting airways on inspiration is enhanced due in large part to secondary flow and airway geometry in the CT-based proximal airways. The enhancement factor has the maximum effect for about 1.0-μm particles with a significant increase of deposition in conducting airways during inspiration (p < 0.05 and NRMSD = 6.72). This subsequently reduces the deposition in respiratory region on inspiration (p < 0.05 and NRMSD = 0.08) as well as expiration (p < 0.05 and NRMSD = 0.17). Since the increase in conducting region is much greater than the decrease in respiratory region, the total deposition of 1.0-μm particles increases about two-fold (p < 0.05 and NRMSD = 0.97). With increasing particle size to 10.0 μm, the total deposition fraction increases insignificantly by enhancement factor. Nonetheless, the deposition in conducting region on inspiration increases significantly from 62% to 78% (p < 0.05 and NRMSD = 0.2) due to sedimentation and impaction, while the deposition in respiratory region on inspiration decreases significantly due to fewer particles escaping conducting region (p < 0.05 and NRMSD = 0.58).
Fig. 8.

Comparison of deposition fractions of the subject-specific 1D CFPD results with and without enhancement factor during breathing phases of inspiration (IN) and expiration (EX) in conducting and respiratory (acinar) regions. Symbol ‘*’ indicates a significant difference (p < 0.05) in the same color-coded region and breathing phase. Symbol ‘*’ indicates a significant difference (p < 0.05) in the total deposition fraction.
Fig. 9 further shows the distributions of deposition fraction by generation in conducting airways and acinar (respiratory) units with and without enhancement factor for selected particle sizes of 10.0, 1.0 and 0.01 μm. Each acinar unit is assigned a single generation number with the generation number of its associated terminal bronchiole. The features of deposition distributions for particle size from 10.0 to 0.01 μm change from large-conducting-airway deposition dominance to large-conducting-airway and acinar deposition dominance, and then to small-conducting-airway and acinar deposition dominance. Most large 10.0-μm particles are deposited in proximal conducting airways, whereas small 0.01-μm particles are deposited in distal small airways and more are deposited in conducting region than acinar region.
Fig. 9.

Deposition fractions by generation for particle sizes of 0.01, 1.0 and 10.0 μm, predicted by the subject-specific 1D CFPD with and without enhancement factor.
3.7. Validation against CT/SPECT imaging data
Because the size of 99mTc sulfur colloid used in SPECT imaging is below 1.0 μm (Krogsgaard, 2004), the particle diameter for the 1D CFPD simulations of the CT/SPECT subjects was set as 0.5 <m. The breathing period was set as T = 4.8 s. Fig. 10 shows that the lobar deposition distributions predicted by the 1D CFPD model are highly correlated with those of the SPECT data (p > 0.10 and NRMSD = 0.08 (LUL), 0.12 (LLL), 0.05 (RUL), 0.06 (RML), and 0.03 (RLL)), while they are significantly different from those predicted by Yeh-Schum 5-lobe symmetric model (p < 0.05). Fig. 11 shows the coefficient of variation (CV) values of particle distributions obtained from CT/SPECT and 1D CFPD. The CV values from CT/SPECT and 1D CFPD are in good agreement (r > 0.8 and NRMSD = 0.094) and they are greater than that of the controls calculated by 1D CPFD (p < 0.05), indicating higher CV and more heterogeneity with increasing disease severity. In contrast, the CV value obtained by Yeh-Schum 5-lobe symmetric model is unpredicted and invariant to disease severity. To illustrate the heterogeneity of deposition with increasing disease severity, Fig. 12 shows the spatial deposition distributions in selected subgroup subjects.
Fig. 10.
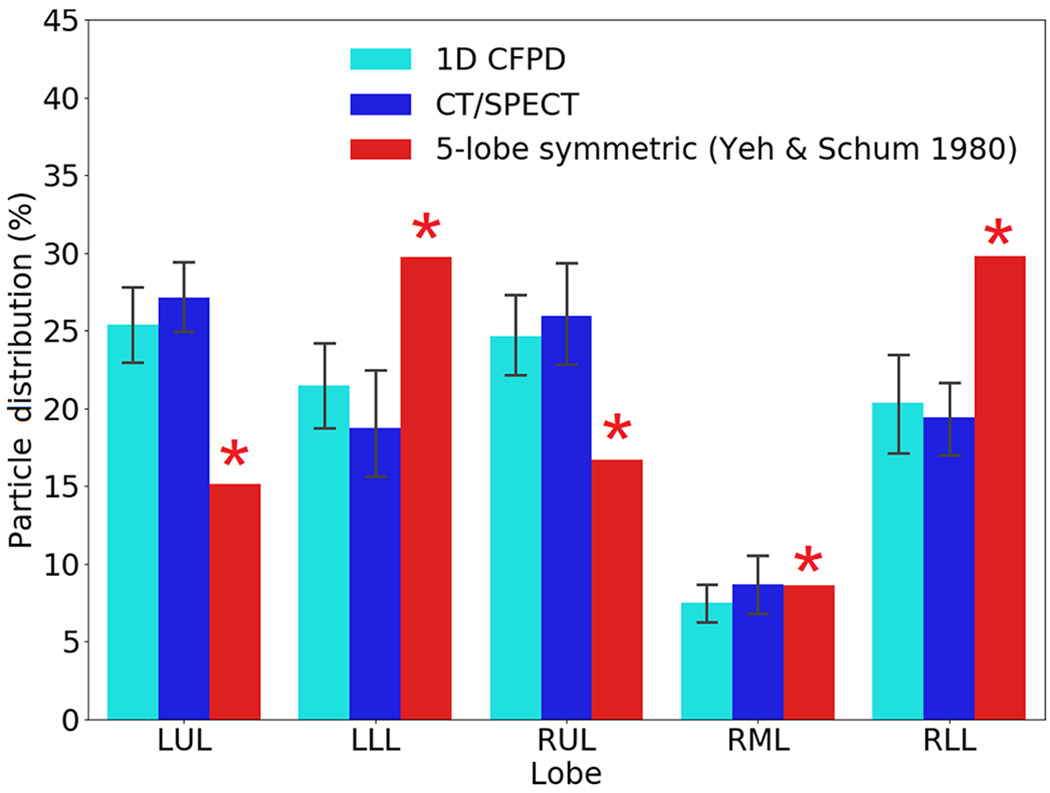
Comparison of lobar particle distributions between 1D CFPD and CT/SPECT data. p > 0.10 for all lobes, and NRMSD = 0.04 (LUL), 0.12 (LLL), 0.05 (RUL), 0.07 (RML), 0.04 (RLL). The results based on the 5-lobe symmetric model (Yeh and Schum, 1980) are also provided for comparison. Symbol ‘*’ indicates a significant difference from CT/SPECT (p < 0.05).
Fig. 11.
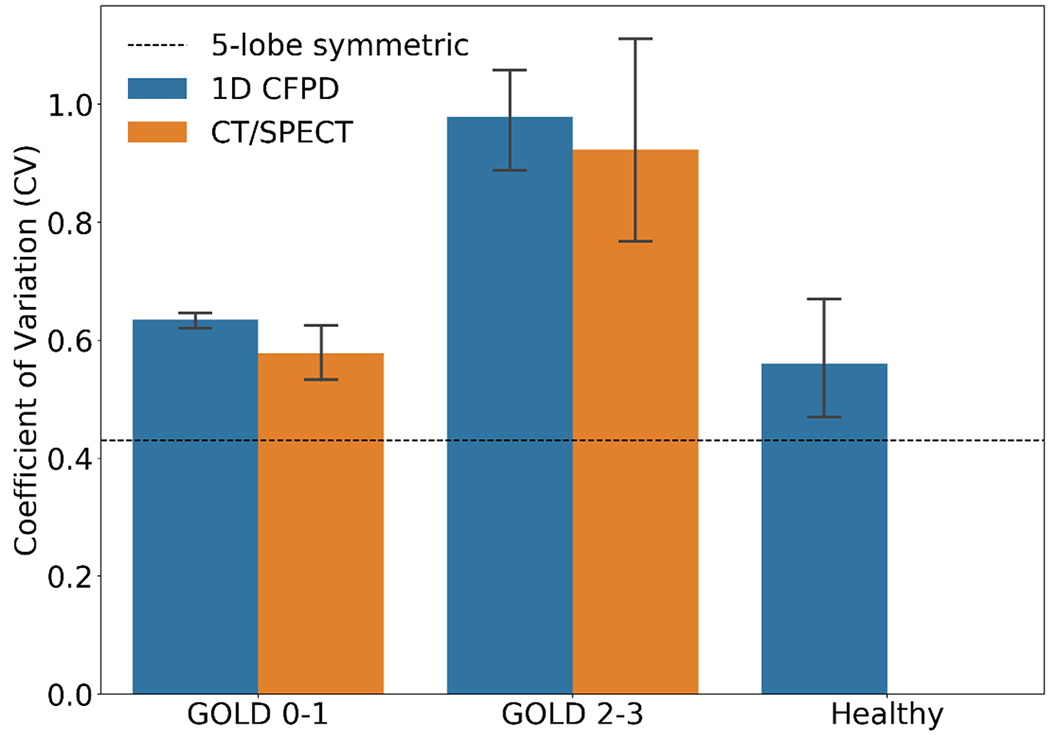
Comparison of the coefficient of variation (CV) values of particle distributions among subgroups. p > 0.10 between 1D CFPD and CT/SPECT for GOLD 0-1 (NRMSD = 0.09) and GOLD 2-3 (NRMSD = 0.10). p < 0.05 for any pairs of CV from the three subgroups, and p < 0.05 for CV between CT/SPECT and 5-lobe symmetric model (Yeh and Schum, 1980).
Fig. 12.

Comparison of the spatial distributions of 1D CFPD-predicted deposition fractions between a nonsevere-mild COPD subject and a moderate-severe COPD subject.
4. Discussion
Humans may breathe in particles of various size at any instant. For example, grain of pollen is about 15.0 μm in diameter, and dust particulate matters may vary from 2.5 to 10.0 μm in diameter as denoted by PM2.5 and PM10. Respiratory virus-laden aerosols generated during normal breathing, which can linger in air for hours and transmit diseases (Wang et al., 2021), are around 0.01–0.20 μm (Darquenne et al., 2022), and those generated by cough are around 1.0–10.0 μm (Wang et al., 2021, Darquenne et al., 2022; Madas et al., 2020). Pharmaceutical aerosols are 5.0 μm or less (Newman SP 2006). Bacterium is about 1.0-3.0 μm and coronavirus is about 0.1–0.5 μm. Wildfire smoke is about 0.4-0.7 μm, and electronic cigarette particles vary between 0.1-0.9 μm (Mulder et al., 2019). While the bulk knowledge of particle deposition in human lungs has been established (Darquenne, 2020), the ability to quantify deposition in a subject-specific manner is lacking, but desirable for the benefit-risk analysis of inhaled particles. In vivo and in vitro studies can provide real but limited data. In silico 3D CFPD is a popular method, however it is only limited to site studies, e.g. in an airway model of a few generations, due to high computational cost. The proposed 1D CFPD technique offers a computation-effective option that allows characterizing whole-lung depositions in individuals and subpopulations with distinct lung structural and functional features. 3D and 1D CFPD models should complement each other due to their respective limitations as discussed later.
Constructing airway structure is a key component in modeling 1D whole-lung particle deposition. Symmetric model, typical-path model and stochastic model are commonly used in 1D models. In the current 1D model, we employed a volume filling technique (Tawhai et al., 2000, 2004) to construct CT imaging-based subject-specific conducting airways and used image-registration to estimate airflow distributions to acinar units that provided initial airflow fraction to the 1D CFD model for calculation of airflow fraction to each acinar unit. With airway geometry and airflow fraction generated, the deposition fraction in the whole lung was calculated using deposition probability formulae along with an enhancement factor. Comparing with symmetric models, our model predicted higher deposition for two reasons. First, subject-specific airway structure and volume are different from those of a symmetric model, such as average branching angles in proximal airways (MESA, 37.24°±19.12° vs. Yeh-Schum, 28.32°±9.58°), generation numbers for terminal bronchioles (MESA, variable vs. Yeh-Schum, fixed), and conducting airway volumes (MESA, 111.35 ± 26.8 cm3 vs. Yeh-Schum, 227 cm3). Second, additional deposition due to the effects of secondary flow and airway geometry is accounted for by an enhancement factor. When particle diameter is relatively small (< 0.1 μm), particles are highly diffusive and can be easily deposited in airways. On the other side, when particles are relatively large (> 1.0 μm), deposition fraction is also high because of the effect of sedimentation and impaction. For relatively small or large particle diameters, both symmetric model and subject-specific model predict high deposition fraction. Nonetheless, the deposition fraction predicted by the subject-specific model is about 10% higher than that of symmetric model for 0.01-μm and 10.0-μm particles due in part to the differences in airway structurer and volume discussed before. It should be noted that Yeh-Schum symmetric model is based on the morphometric data of one subject. Due to subject-specific or gender-specific anatomies (Christou et al., 2021), there might exist subjects with deposition fraction lower than that of the symmetric model. Thus, it is essential to conduct large studies to better understand the relationships of particle deposition to airway structure and lung function.
The acinar model used in the current 1D CFPD model was based on Weibel’s typical-path acinar model with intra-acinar isotropic alveolar wall expansion/contraction (Weibel et al., 2005). The deformation of an acinar unit and airflow fraction to each acinar unit were calculated from image registration and 1D CFD simulation. Comparing with the 3D CFPD acinar simulations of Hofemeier et al. (2018), our acinar model captured the characteristics of deposition in respiratory region for tidal and deep breathing (Fig. S7). Our model also captured the features of deep inhalation in the 3D CFPD deep lung model simulations of Koullapis et al. (2020) that the fraction of aerosols retained in conducting region decreases and the major deposition occurs in acinar units, resulting in higher total deposition fraction than that of tidal breathing (Fig. 4). A comparison of the deep lung model in Fig. 4 and the subject-specific whole-lung model in Fig. 8 shows that the deposition in conducting region is dominant only in the latter. It is because the former simulated a single distal branch and associated higher-generation airways, while the latter considered the entire airways. Furthermore, Fig. 9 shows that with decreasing particle size to 0.01 μm, the deposition in conducting region remains significant, residing in distal small airways.
Comparing with CT/SPECT data, our 1D CFPD model captured deposition heterogeneity by lobe (Fig. 10) and by severity (Fig. 11). The discrepancy in the CV of deposition fraction between subgroups is correlated with the degree of air trapping, which is a disease phenotype in COPD (Zou et al., 2021). The CVs of air-trapped voxels (categorial variable) are 0.634±0.016 and 0.979±0.153 for GOLD 0-1 and GOLD 2-3 subgroups, respectively (p < 0.05). On the other hand, the symmetric model, by design, was not able to capture deposition heterogeneity in COPD patients.
The current 1D CFPD model has several limitations. For example, the model does not consider acinar morphology in diseased lungs. The CT/SPECT study cohort for validation is small and limited to COPD patients. Further validation based on large studies for various diseases, such as COPD and asthma, is needed. Since COPD and asthma exhibit different structural and functional characteristics (Choi et al., 2017a), it is important to assess the sensitivity of the model to capture differential deposition patterns between them. In comparison with 3D CFPD, 1D CFPD is inadequate to model accurately regional transport and biological processes from airway walls to tissues due to dimension reduction.
5. Conclusion
We proposed a CT imaging-based subject-specific 1D CFPD to predict whole-lung particle deposition in human lungs. We validated this model against in silico 1D and 3D CFPD data as well as in vivo CT/SPECT imaging data. Specifically, the proposed model could differentiate deposition heterogeneity by COPD subgroups. Thus, the model has the potential for the benefit-risk analysis of inhaled particles in human lungs, subject to various risk factors and disease severities, for large population studies.
Supplementary Material
Acknowledgment
The authors thank the Extreme Science and Engineering Discovery Environment (XSEDE) (allocation MCA07S015) sponsored by the National Science Foundation for computational time at San Diego Supercomputer Center (SDSC) and the Texas Advanced Computing Center (TACC).
Funding/Support
Supports for this study were provided, in part, by NIH grants U01-HL114494, R01-HL130506 and S10-RR022421, and the ED grant P116S210005. The MESA research was supported by contracts 75N92020D00001, HHSN268201500003I, N01-HC-95159, 75N92020D00005, N01-HC-95160, 75N92020D00002, N01-HC-95161, 75N92020D00003, N01-HC-95162, 75N92020D00006, N01-HC-95163, 75N92020D00004, N01-HC-95164, 75N92020D00007, N01-HC-95165, N01-HC-95166, N01-HC-95167, N01-HC-95168 and N01-HC-95169 from the National Heart, Lung, and Blood Institute, and by grants UL1-TR-000040, UL1-TR-001079, and UL1-TR-001420 from the National Center for Advancing Translational Sciences (NCATS). The authors thank the other investigators, the staff, and the participants of the MESA study for their valuable contributions. A full list of participating MESA investigators and institutions can be found at http://www.mesa-nhlbi.org.
Footnotes
Ethics approval and consent to participate
Ethics and consent were approved by respective IRB committees.
CRediT authorship contribution statement
Xuan Zhang: Conceptualization, Visualization, Formal analysis, Methodology, Writing – original draft, Writing – review & editing. Frank Li: Funding acquisition, Formal analysis, Methodology, Writing – original draft, Writing – review & editing. Prathish K. Rajaraman: Formal analysis, Methodology, Writing – original draft, Writing – review & editing. Jiwoong Choi: Formal analysis, Methodology, Writing – original draft, Writing – review & editing. Alejandro P. Comellas: Funding acquisition, Formal analysis, Methodology, Writing – original draft, Writing – review & editing. Eric A. Hoffman: Funding acquisition, Formal analysis, Methodology, Writing – original draft, Writing – review & editing. Benjamin M. Smith: Funding acquisition, Formal analysis, Methodology, Writing – original draft, Writing – review & editing. Ching-Long Lin: Conceptualization, Visualization, Funding acquisition, Formal analysis, Methodology, Writing – original draft, Writing – review & editing.
Competing Competing Interest
There is no conflict of interest for all authors.
Supplementary materials
Supplementary material associated with this article can be found, in the online version, at doi:10.1016/j.ejps.2022.106272.
Availability of data and material
Not applicable.
References
- Asgharian B, Hofmann W, Bergmann R, 2001. Particle deposition in a multiple-path model of the human lung. Aerosol. Sci. Technol 34 (4), 332–339. 10.1080/02786820119122. [DOI] [Google Scholar]
- Bair WJ, 1989. Human respiratory tract model for radiological protection: a revision of the ICRP dosimetric model for the respiratory system. Health Phys. 57 (Suppl 1), 249–252. 10.1097/00004032-198907001-00032 discussion 52-3. Epub 1989/01/01 [DOI] [PubMed] [Google Scholar]
- Bourbeau J, Doiron D, Biswas S, Smith BM, Benedetti A, Brook JR, Aaron SD, Chapman KR, Hernandez P, Maltais F, Marciniuk DD, O’Donnell D, Sin DD, Walker B, Dsilva L, Nadeau G, Coats V, Compton C, Miller BE, Tan WC, 2022. Ambient air pollution and dysanapsis: associations with lung function and COPD in the CanCOLD study. Am. J. Respir. Crit. Care Med 10.1164/rccm.202106-1439OC. Epub 2022/04/06 [DOI] [PMC free article] [PubMed] [Google Scholar]
- Castaldi PJ, Boueiz A, Yun J, Estepar RSJ, Ross JC, Washko G, Cho MH, Hersh CP, Kinney GL, Young KA, Regan EA, Lynch DA, Criner GJ, Dy JG, Rennard SI, Casaburi R, Make BJ, Crapo J, Silverman EK, Hokanson JE, 2020. Machine learning characterization of COPD subtypes: insights from the COPDGene study. Chest 157 (5), 1147–1157. 10.1016/j.chest.2019.11.039. Epub 2019/12/31 [DOI] [PMC free article] [PubMed] [Google Scholar]
- Cho JL, Villacreses R, Nagpal P, Guo J, Pezzulo AA, Thurman AL, Hamzeh NY, Blount RJ, Fortis S, Hoffman EA, Zabner J, Comellas AP, 2022. Quantitative chest CT assessment of small airways disease in post-acute SARS-CoV-2 infection. Radiology 304 (1), 185–192. 10.1148/radiol.212170. [DOI] [PMC free article] [PubMed] [Google Scholar]
- Choi S, Haghighi B, Choi J, Hoffman EA, Comellas AP, Newell JD, Wenzel SE, Castro M, Fain SB, Jarjour NN, Schiebler ML, Barr RG, Han MK, Bleecker ER, Cooper CB, Couper D, Hansel N, Kanner RE, Kazerooni EA, Kleerup EAC, Martinez FJ, O’Neal WK, Woodruff PG, Lin CL, 2017a. Differentiation of quantitative CT imaging phenotypes in asthma versus COPD. BMJ Open Respir. Res 4 (1), e000252 10.1136/bmjresp-2017-000252. [DOI] [PMC free article] [PubMed] [Google Scholar]
- Choi S, Hoffman EA, Wenzel SE, Castro M, Fain S, Jarjour N, Schiebler ML, Chen K, Lin CL, 2017b. Quantitative computed tomographic imaging–based clustering differentiates asthmatic subgroups with distinctive clinical phenotypes. J. Allergy Clin. Immunol 140 (3), 690–700. 10.1016/j.jaci.2016.11.053 e8. [DOI] [PMC free article] [PubMed] [Google Scholar]
- Choi J, LeBlanc LJ, Choi S, Haghighi B, Hoffman EA, O’Shaughnessy P, Wenzel SE, Castro M, Fain S, Jarjour N, Schiebler ML, Denlinger L, Delvadia R, Walenga R, Babiskin A, Lin CL, 2019a. Differences in particle deposition between members of imaging-based asthma clusters. J. Aerosol. Med. Pulm. Drug Deliv 32 (4), 213–223. 10.1089/jamp.2018.1487. [DOI] [PMC free article] [PubMed] [Google Scholar]
- Choi S, Yoon S, Jeon J, Zou C, Choi J, Tawhai MH, Hoffman EA, Delvadia R, Babiskin A, Walenga R, Lin CL, 2019b. 1D network simulations for evaluating regional flow and pressure distributions in healthy and asthmatic human lungs. J. Appl. Physiol 127 (1), 122–133. 10.1152/japplphysiol.00016.2019. [DOI] [PMC free article] [PubMed] [Google Scholar]
- Christou S, Chatziathanasiou T, Angeli S, Koullapis P, Stylianou F, Sznitman J, Guo HH, Kassinos SC, 2021. Anatomical variability in the upper tracheobronchial tree: sex-based differences and implications for personalized inhalation therapies. J. Appl. Physiol 130 (3), 678–707. 10.1152/japplphysiol.00144.2020. [DOI] [PubMed] [Google Scholar]
- Darquenne C, Borojeni AAT, Colebank MJ, Forest MG, Madas BG, Tawhai M, Jiang Y, 2022. Aerosol transport modeling: the key link between lung infections of individuals and populations. Front. Physiol 13, 923945 10.3389/fphys.2022.923945 Epub 2022/07/08. [DOI] [PMC free article] [PubMed] [Google Scholar]
- Darquenne C, 2020. Deposition mechanisms. J. Aerosol Med. Pulmonary Drug Deliv 33 (4), 181–185. 10.1089/jamp.2020.29029.cd. [DOI] [PubMed] [Google Scholar]
- De Backer JW, Vos WG, Vinchurkar SC, Claes R, Drollmann A, Wulfrank D, Parizel PM, Germonpre P, De Backer W, 2010. Validation of computational fluid dynamics in CT-based airway models with SPECT/CT. Radiology 257 (3), 854–862. 10.1148/radiol.10100322. . [DOI] [PubMed] [Google Scholar]
- Fuller BMFI, Mohr NM, et al. , 2017. Lung-protective ventilation initiated in the emergency department (LOV-ED): a quasi-experimental, before-after trial. Ann. Emerg. Med 10.1016/j.annemergmed.2017.01.013. [DOI] [PMC free article] [PubMed] [Google Scholar]
- Haghighi B, Choi S, Choi J, Hoffman EA, Comellas AP, Newell JD, Graham Barr R, Bleecker E, Cooper CB, Couper D, Han ML, Hansel NN, Kanner RE, Kazerooni EA, Kleerup EAC, Martinez FJ, O’Neal W, Rennard SI, Woodruff PG, Lin CL, 2018. Imaging-based clusters in current smokers of the COPD cohort associate with clinical characteristics: the SubPopulations and Intermediate Outcome Measures in COPD Study (SPIROMICS). Respir. Res 19 (1), 178. 10.1186/s12931-018-0888-7. [DOI] [PMC free article] [PubMed] [Google Scholar]
- Haghighi B, Choi S, Choi J, Hoffman EA, Comellas AP, Newell JD, Lee CH, Barr RG, Bleecker E, Cooper CB, Couper D, Han ML, Hansel NN, Kanner RE, Kazerooni EA, Kleerup EAC, Martinez FJ, O’Neal W, Paine R, Rennard SI, Smith BM, Woodruff PG, Lin CL, 2019. Imaging-based clusters in former smokers of the COPD cohort associate with clinical characteristics: the Sub Populations and intermediate outcome measures in COPD study (SPIROMICS). Respir. Res 20 (1), 153. 10.1186/s12931-019-1121-z. [DOI] [PMC free article] [PubMed] [Google Scholar]
- Haghighi BD, Ellingwood N, Yin Y, Hoffman EA, Lin CL, 2018. A GPU-based symmetric non-rigid image registration method in human lung. Med. Biol. Eng. Comput 56 (3), 355–371. 10.1007/sll517-017-1690-2. [DOI] [PMC free article] [PubMed] [Google Scholar]
- Hofemeier P, Koshiyama K, Wada S, Sznitman J, 2018. One (sub-)acinus for all: fate of inhaled aerosols in heterogeneous pulmonary acinar structures. Eur. J. Pharm. Sci 113, 53–63. 10.1016/j.ejps.2017.09.033. Epub 2017/09/28 [DOI] [PMC free article] [PubMed] [Google Scholar]
- Hofmann W, Koblinger L, 1990. Monte Carlo modeling of aerosol deposition in human lungs. Part II: deposition fractions and their sensitivity to parameter variations. J. Aerosol Sci 21 (5), 675–688. 10.1016/0021-8502(90)90122-E. [DOI] [Google Scholar]
- Hofmann W, Martonen TB, 1988. The significance of enhanced radionuclide deposition at bronchial bifurcations. Ann. Occup. Hyg 32 (inhaled_particles_VI), 1055–1065. 10.1093/annhyg/32.inhaled_partides_VI.1055. [DOI] [Google Scholar]
- Hofmann W, 2011. Modelling inhaled particle deposition in the human lung—a review. J. Aerosol Sci 42 (10), 693–724. 10.1016/j.jaerosci.2011.05.007. [DOI] [Google Scholar]
- Koblinger L, Hofmann W, 1990. Monte Carlo modeling of aerosol deposition in human lungs. Part I: simulation of particle transport in a stochastic lung structure. J. Aerosol Sci 21 (5), 661–674. 10.1016/0021-8502(90)90121-D. [DOI] [Google Scholar]
- Kolanjiyil AV, Kleinstreuer C, 2017. Computational analysis of aerosol-dynamics in a human whole-lung airway model. J. Aerosol Sci 114, 301–316. 10.1016/j.jaerosci.2017.10.001. [DOI] [Google Scholar]
- Koshiyama K, Wada S, 2015. Mathematical model of a heterogeneous pulmonary acinus structure. Comput. Biol. Med 62, 25–32. 10.1016/j.compbiomed.2015.03.032. [DOI] [PubMed] [Google Scholar]
- Koullapis P, Ollson B, Kassinos SC, Sznitman J, 2019. Multiscale in silico lung modeling strategies for aerosol inhalation therapy and drug delivery. Curr. Opin. Biomed. Eng 11, 130–136. 10.1016/j.cobme.2019.11.003. Epub 2019/09/01 [DOI] [PMC free article] [PubMed] [Google Scholar]
- Koullapis PG, Hofemeier P, Sznitman J, Kassinos SC, 2018. An efficient computational fluid-particle dynamics method to predict deposition in a simplified approximation of the deep lung.. Eur. J. Pharm. Sci 113, 132–144. 10.1016/j.ejps.2017.09.016. Epub 2017/09/18 [DOI] [PubMed] [Google Scholar]
- Koullapis PG, Stylianou FS, Sznitman J, Olsson B, Kassinos SC, 2020. Towards whole-lung simulations of aerosol deposition: a model of the deep lung. J. Aerosol Sci 144, 105541 10.1016/j.jaerosci.2020.105541. [DOI] [Google Scholar]
- Krogsgaard O, 2004. Technetium-99m-sulfur colloid. Eur. J. Nucl. Med 1, 31–35. [PubMed] [Google Scholar]
- Li F, Choi J, Zou C, Newell JD, Comellas AP, Lee CH, Ko H, Barr RG, Bleecker ER, Cooper CB, Abtin F, Barjaktarevic I, Couper D, Han M, Hansel NN, Kanner RE, Paine R, Kazerooni EA, Martinez FJ, O’Neal W, Rennard SI, Smith BM, Woodruff PG, Hoffman EA, Lin CL, 2021. Latent traits of lung tissue patterns in former smokers derived by dual channel deep learning in computed tomography images. Sci. Rep 11 (1), 4916. 10.1038/s41598-021-84547-5. [DOI] [PMC free article] [PubMed] [Google Scholar]
- Lin CL, Choi S, Haghighi B, Choi J, Hoffman EA, 2018. Cluster-guided multiscale lung modeling via machine learning. In: Andreoni W, Yip S (Eds.), Handbook of Materials Modeling: Applications: Current and Emerging Materials. Springer International Publishing, Cham, pp. 1–20. [Google Scholar]
- Lin CL, Hoffman EA, Kassinos S, 2021. In: Kassinos S, Bäckman P, Conway J, Hickey AJ (Eds.). Inhaled Medicines: Academic Press, pp. 375–390. [Google Scholar]
- Lin CL, Tawhai MH, McLennan G, Hoffman EA, 2007. Characteristics of the turbulent laryngeal jet and its effect on airflow in the human intra-thoracic airways. Respir. Physiol. Neurobiol 157 (2), 295–309. 10.1016/j.resp.2007.02.006. [DOI] [PMC free article] [PubMed] [Google Scholar]
- Lippmann M, 2022. Regional deposition of particles in the human respiratory tract. Comprehensive Physiology 213–232. [Google Scholar]
- Madas BG, Füri P, Farkas Á, Nagy A, Czitrovszky A, Balásházy I, Schay GG, Horváth A, 2020. Deposition distribution of the new coronavirus (SARS-CoV-2) in the human airways upon exposure to cough-generated droplets and aerosol particles. Sci. Rep 10 (1), 22430. 10.1038/s41598-020-79985-6. [DOI] [PMC free article] [PubMed] [Google Scholar]
- Miyawaki S, Hoffman EA, Lin C-L, 2017. Numerical simulations of aerosol delivery to the human lung with an idealized laryngeal model, image-based airway model, and automatic meshing algorithm. Comput. Fluids 148, 1–9. 10.1016/j.compfluid.2017.02.008. [DOI] [PMC free article] [PubMed] [Google Scholar]
- Miyawaki S, Tawhai MH, Hoffman EA, Wenzel SE, Lin CL, 2017. Automatic construction of subject-specific human airway geometry including trifurcations based on a CT-segmented airway skeleton and surface. Biomech. Model. Mechanobiol 16 (2), 583–596. 10.1007/s10237-016-0838-6. [DOI] [PMC free article] [PubMed] [Google Scholar]
- Mulder HA, Patterson JL, Halquist MS, Kosmider L, Turner JBM, Poklis JL, Poklis A, Peace MR, 2019. The effect of electronic cigarette user modifications and e-liquid adulteration on the particle size profile of an aerosolized product. Sci. Rep 9 (1), 10221. 10.1038/s41598-019-46387-2. [DOI] [PMC free article] [PubMed] [Google Scholar]
- Newman SP, 2006. AEROSOLS. In: Laurent GJ, Shapiro SD (Eds.), Encyclopedia of Respiratory Medicine. Academic Press, Oxford, pp. 58–64. [Google Scholar]
- Ochs M, Nyengaard JR, Jung A, Knudsen L, Voigt M, Wahlers T, Richter J, Gundersen HJ, 2004. The number of alveoli in the human lung. Am. J. Respir. Crit. Care Med 169 (1), 120–124. 10.1164/rccm.200308-1107OC. Epub 2003/09/27 [DOI] [PubMed] [Google Scholar]
- Raabe OG, Yeh HC, Schum GM, Phalen RF, 1976. Tracheobronchial Geometry Human, Dog, Rat, Albuquerque. New Mexico, USA. [Google Scholar]
- Rajaraman PK, Choi J, Hoffman EA, O’Shaughnessy PT, Choi S, Delvadia R, Babiskin A, Walenga R, Lin CL, 2020. Transport and deposition of hygroscopic particles in asthmatic subjects with and without airway narrowing. J. Aerosol Sci 146, 105581 10.1016/j.jaerosci.2020.105581. [DOI] [PMC free article] [PubMed] [Google Scholar]
- Schum M, Yeh HC, 1980. Theoretical evaluation of aerosol deposition in anatomical models of mammalian lung airways. Bull. Math. Biol 42 (1), 1–15. [DOI] [PubMed] [Google Scholar]
- Sirr SA, Juenemann PJ, Tom H, Boudreau RJ, Chandler RP, Loken MK, 1985. Effect of ethanol on droplet size, efficiency of delivery, and clearance characteristics of technetium-99m DTPA aerosol. J. Nucl. Med 26 (6), 643–646. Epub 1985/06/01. [PubMed] [Google Scholar]
- Smith BM, Kirby M, Hoffman EA, Kronmal RA, Aaron SD, Allen NB, Bertoni A, Coxson HO, Cooper C, Couper DJ, Criner G, Dransfield MT, Han MK, Hansel NN, Jacobs DR, Kaufman JD, Lin CL, Manichaikul A, Martinez FJ, Michos ED, Oelsner EC, Paine R 3rd, Watson KE, Benedetti A, Tan WC, Bourbeau J, Woodruff PG, Barr RG, 2020. Association of dysanapsis with chronic obstructive pulmonary disease among older adults. JAMA 323 (22), 2268–2280. 10.1001/jama.2020.6918. Epub 2020/06/10 [DOI] [PMC free article] [PubMed] [Google Scholar]
- Smith BM, Traboulsi H, Austin JHM, Manichaikul A, Hoffman EA, Bleecker ER, Cardoso WV, Cooper C, Couper DJ, Dashnaw SM, Guo J, Han MK, Hansel NN, Hughes EW, Jacobs DR, Kanner RE, Kaufman JD, Kleerup E, Lin CL, Liu K, Lo Cascio CM, Martinez FJ, Nguyen JN, Prince MR, Rennard S, Rich SS, Simon L, Sun Y, Watson KE, Woodruff PG, Baglole CJ, Barr RG, 2018. Lung ftM, investigators S. Human airway branch variation and chronic obstructive pulmonary disease. Proc. Natl. Acad. Sci 115 (5), E974–EE81. 10.1073/pnas.1715564115. [DOI] [PMC free article] [PubMed] [Google Scholar]
- Stahlhofen W, Rudolf G, James AC, 1989. Intercomparison of experimental regional aerosol deposition data. J. Aerosol Med 2 (3), 285–308. 10.1089/jam.1989.2.285. [DOI] [Google Scholar]
- Tanabe N, Sato S, Oguma T, Shima H, Sato A, Muro S, Hirai T, 2019. Associations of airway tree to lung volume ratio on computed tomography with lung function and symptoms in chronic obstructive pulmonary disease. Respir. Res 20 (1), 77. 10.1186/s12931-019-1047-5. [DOI] [PMC free article] [PubMed] [Google Scholar]
- Tawhai MH, Hunter P, Tschirren J, Reinhardt J, McLennan G, Hoffman EA, 2004. CT-based geometry analysis and finite element models of the human and ovine bronchial tree. J. Appl. Physiol (1985) 97 (6), 2310–2321. 10.1152/japplphysiol.00520.2004. Epub 2004/08/24 [DOI] [PubMed] [Google Scholar]
- Tawhai MH, Pullan AJ, Hunter PJ, 2000. Generation of an anatomically based three-dimensional model of the conducting airways. Ann. Biomed. Eng 28 (7), 793–802. 10.1114/1.1289457. [DOI] [PubMed] [Google Scholar]
- Tian G, Hindle M, Lee S, Longest PW, 2015. Validating CFD predictions of pharmaceutical aerosol deposition with in vivo data. Pharm. Res 32 (10), 3170–3187. 10.1007/s11095-015-1695-1. Epub 2015/05/07 [DOI] [PMC free article] [PubMed] [Google Scholar]
- Vameghestahbanati M, Kirby M, Maltais F, Jensen D, Doiron D, Tan WC, Bourbeau J, Smith BM, 2021. Dysanapsis and the spirometric response to inhaled bronchodilators. Am. J. Respir. Crit. Care Med 204 (8), 997–1001. 10.1164/rccm.202107-1574LE. Epub 2021/07/16 [DOI] [PMC free article] [PubMed] [Google Scholar]
- Wang CC, Prather KA, Sznitman J, Jimenez JL, Lakdawala SS, Tufekci Z, Marr LC, 2021. Airborne transmission of respiratory viruses. Science 373 (6558), eabd9149. 10.1126/science.abd9149. [DOI] [PMC free article] [PubMed] [Google Scholar]
- Weibel ER, Sapoval B, Filoche M, 2005. Design of peripheral airways for efficient gas exchange. Respir. Physiol. Neurobiol 148 (1-2), 3–21. 10.1016/j.resp.2005.03.005. Epub 2005/06/01 [DOI] [PubMed] [Google Scholar]
- Weibel ER, 2009. What makes a good lung? Swiss Med. Wkly. 139 (27-28), 375–386. Epub 2009/07/25. [DOI] [PubMed] [Google Scholar]
- Yeh HC, Schum GM, 1980. Models of human lung airways and their application to inhaled particle deposition. Bull. Math. Biol 42 (3), 461–480. 10.1016/S0092-8240(80)80060-7. [DOI] [PubMed] [Google Scholar]
- Yin Y, Choi J, Hoffman EA, Tawhai MH, Lin CL, 2010. Simulation of pulmonary air flow with a subject-specific boundary condition. J. Biomech 43 (11), 2159–2163. 10.1016/j.jbiomech.2010.03.048. [DOI] [PMC free article] [PubMed] [Google Scholar]
- Yin Y, Hoffman EA, Lin C-L, 2009. Mass preserving nonrigid registration of CT lung images using cubic B-spline. Med. Phys 36 (9), 4213–4222. 10.1118/1.3193526, 2009. [DOI] [PMC free article] [PubMed] [Google Scholar]
- Yoon S, Tam TM, Rajaraman PK, Lin CL, Tawhai M, Hoffman EA, Choi S, 2020. An integrated 1D breathing lung simulation with relative hysteresis of airway structure and regional pressure for healthy and asthmatic human lungs. J. Appl. Physiol 129 (4), 732–747. 10.1152/japplphysiol.00176.2020. [DOI] [PubMed] [Google Scholar]
- Zou C, Li F, Choi J, Haghighi B, Choi S, Rajaraman PK, Comellas AP, Newell JD, Lee CH, Barr RG, Bleecker E, Cooper CB, Couper D, Han M, Hansel NN, Kanner RE, Kazerooni EA, Kleerup EC, Martinez FJ, O’Neal W, Paine R, Rennard SI, Smith BM, Woodruff PG, Hoffman EA, Lin CL, 2021. Longitudinal imaging-based clusters in former smokers of the COPD cohort associate with clinical characteristics: the Sub Populations and intermediate outcome measures in COPD study (SPIROMICS). Int. J. Chron. Obstruct. Pulmon. Dis 16, 1477–1496. 10.2147/copd.S301466. Epub 2021/06/10 [DOI] [PMC free article] [PubMed] [Google Scholar]
Associated Data
This section collects any data citations, data availability statements, or supplementary materials included in this article.
Supplementary Materials
Data Availability Statement
Not applicable.