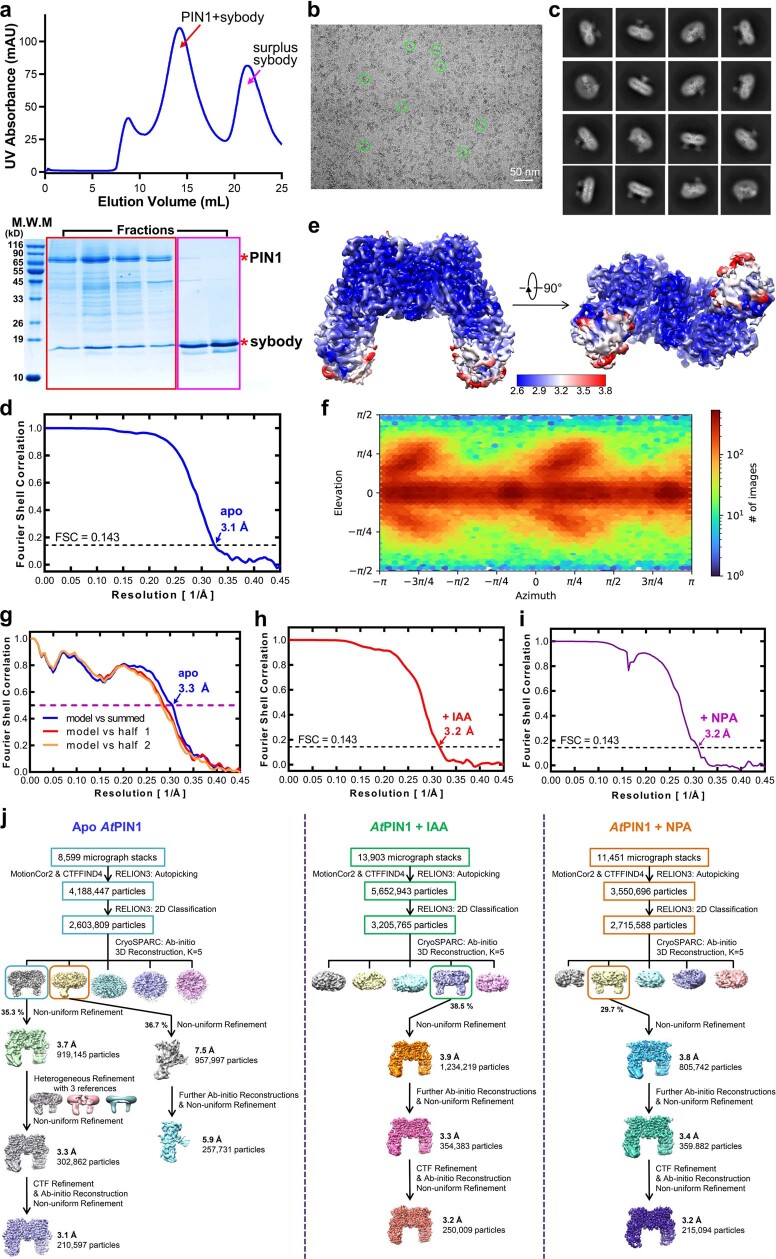
Extended Data Fig. 3. Cryo-EM analysis of PIN1 with Sybody-21.
a, Representative gel filtration and Coomassie-blue-staining SDS-PAGE results of WT PIN1 bound to Sybody-21. Peaks corresponding to PIN1 plus Sybody-21 and the redundant Sybody-21 are indicated by red and pink arrows, respectively. Independent experiments have been repeated for five times with similar results. b, A typical cryo-EM image of the apo PIN1 plus Sybody-21. c, Typical 2D classification images of the apo PIN1 plus Sybody-21. d, The gold-standard Fourier shell correlation curves for the overall map of the apo PIN1 plus Sybody-21. e, The local resolution maps of apo PIN1 plus Sybody-21 sample calculated using ResMap. f, Euler angle distribution of the apo PIN1 plus Sybody-21 map. g, FSC model curves of the apo PIN1 plus Sybody-21 map. h, The gold-standard Fourier shell correlation curves for the overall map of the PIN1 plus IAA and Sybody-21 sample. i, The gold-standard Fourier shell correlation curves for the overall map of the PIN1 plus NPA and Sybody-21 sample. j, Flowchart for cryo-EM data processing. Full version of all gels and blots are provided in Supplementary Fig. 1.

