Abstract
How specificity is conferred within gene regulatory networks is an important problem in biology. The basic helix–loop–helix PHYTOCHROME-INTERACTING FACTORs (PIFs) and single zinc-finger CYCLING DOF FACTORs (CDFs) mediate growth responses of Arabidopsis to light and temperature. We show that these two classes of transcription factor (TF) act cooperatively. CDF2 and PIF4 are temporally and spatially co-expressed, they interact to form a protein complex and act in the same genetic pathway to promote hypocotyl cell elongation. Furthermore, PIF4 substantially strengthens genome-wide occupancy of CDF2 at a subset of its target genes. One of these, YUCCA8, encodes an auxin biosynthesis enzyme whose transcription is increased by PIF4 and CDF2 to contribute to hypocotyl elongation. The binding sites of PIF4 and CDF2 in YUCCA8 are closely spaced, and in vitro PIF4 enhances binding of CDF2. We propose that this occurs by direct protein interaction and because PIF4 binding alters DNA conformation. Thus, we define mechanisms by which PIF and CDF TFs cooperate to achieve regulatory specificity and promote cell elongation in response to light.
Subject terms: Plant molecular biology, Plant morphogenesis, Light responses
Hypocotyl cell elongation is promoted by combinatorial action of PIF4 and CDF2. This occurs because PIF4 enhances binding of CDF2 to common target genes increasing their transcription. These genes include the auxin biosynthesis gene YUCCA8.
Main
Cellular responses to environmental and developmental signals require activation of gene regulatory networks by recruitment of transcription factors (TFs) to specific genes1. Plant genomes encode relatively large numbers of TFs2, emphasizing the importance of transcriptional regulation, and recruitment of combinations of TFs to the same gene can integrate different signals and enhance specificity3–5. Nevertheless, TFs usually recognize simple DNA sequences in vitro, and it remains unclear how they are recruited to specific genes and implement unique functions in vivo. In plants, DOF (DNA-binding with one finger) TFs, which contain a conserved CX2CX21CX2C motif, regulate a wide range of developmental and environmental responses by binding to specific target genes in vivo6, but their DNA-binding site has only been described by a simple consensus motif, AAAG or [T/A]AAAG7,8, which occurs very widely in plant genomes. Within this family, CYCLING DOF FACTORS (CDF) are temporally regulated by the circadian clock to repress photoperiodic flowering and tuberisation9–11, and they also promote hypocotyl elongation and regulate abiotic stress responses12–14, but how they are recruited to specific target genes is unknown.
Combinatorial action of TFs can confer specificity in vivo and multiprotein TF complexes can exhibit new recognition properties and enhanced specificity for selected genes in vivo15. Some DOF proteins interact with other TFs or proteins to regulate gene transcription6, but it remains unclear how these interactions influence binding-site selection. Here we use a combination of in vivo and in vitro approaches to show that in Arabidopsis, CDF2 physically interacts with PHYTOCHROME-INTERACTING 4 (PIF4), an intensively studied basic helix–loop–helix (bHLH) TF with well-established functions in promoting growth in response to light and temperature16–20. PIF4 interacts directly with phytochrome and cryptochrome photoreceptors18,19,21,22, which regulate its activity in response to red/far-red and blue light, respectively. We find that PIF4 and CDF2 promote hypocotyl cell elongation, that the proteins directly interact and that PIF4 binding increases the strength and alters the specificity of CDF2 binding to a subset of target genes in vivo and in vitro. Therefore, combinatorial functions of PIF4 and CDF2 increase transcription of their mutual target genes, and provide a mechanism by which PIF4 enables CDF2 to activate specific target genes to promote hypocotyl cell growth.
Results
PIF4 and CDFs promote elongation of hypocotyl cells
Under short-day (SD) photoperiods, the hypocotyl of Arabidopsis seedlings grows rhythmically with a peak in growth rate at dawn23,24. CDF and PIF TFs promote hypocotyl elongation under SDs23,25,26. Inactivation of the partially redundant CDF1, CDF2, CDF3 and CDF5 genes in the cdf1235 quadruple (cdfq) mutant or of the PIF4 and PIF5 genes in the pif4 pif5 double mutant reduces hypocotyl growth under SDs14,23,25,26. To test whether CDFs and PIF4 promote growth in the same genetic pathway, the cdfq pif4 quintuple mutant was generated. In SDs, no differences were observed in hypocotyl length among the pif4, cdfq and cdfq pif4 genotypes, although they all produced shorter hypocotyls than those of wild-type (Col-0) plants (Extended Data Fig. 1a). After germination in the dark, the length of the hypocotyl of pif4, cdfq and cdfq pif4 mutants was indistinguishable from that of Col-0 (Extended Data Fig. 1b–d). Therefore, CDFs and PIF4 promote hypocotyl elongation under SDs in a non-additive, light-dependent manner, suggesting that they promote growth in the same genetic pathway.
Extended Data Fig. 1. CDF1, 2, 3 and 5 function in the same genetic pathway with PIF4 to induce hypocotyl elongation.
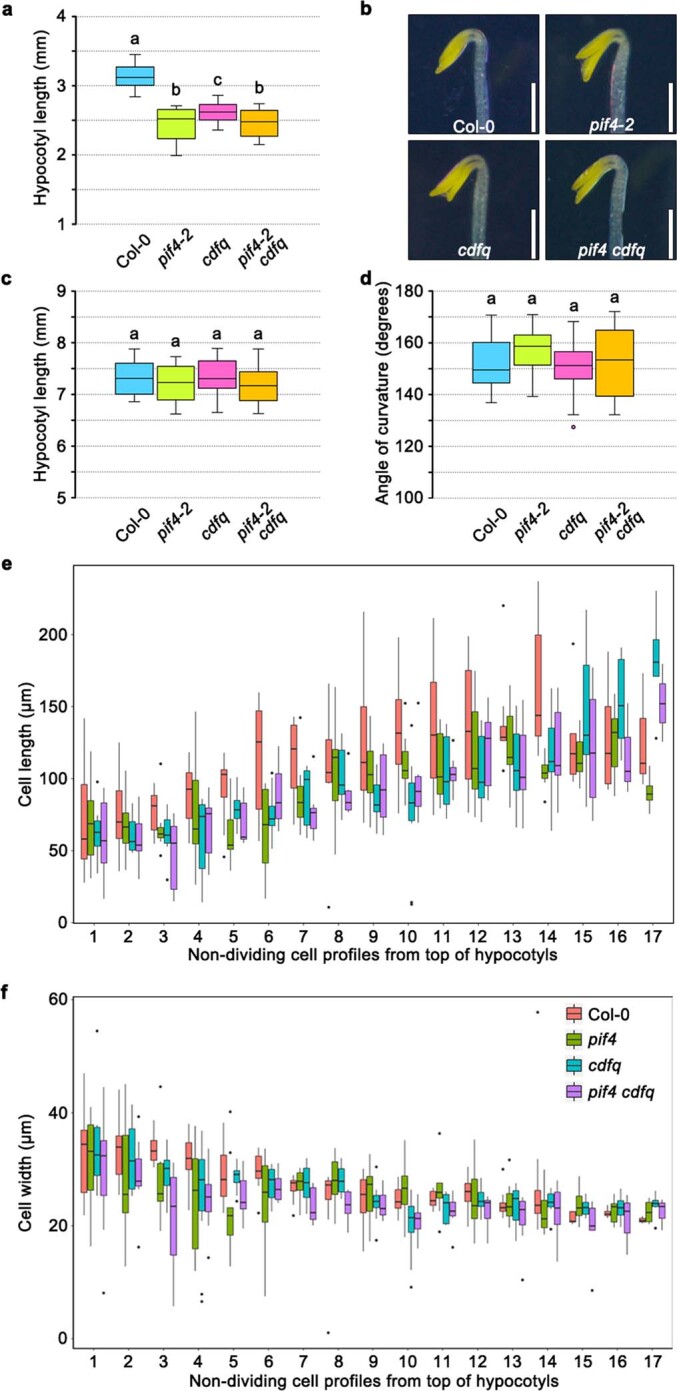
CDF1, 2, 3 and 5 function in the same genetic pathway with PIF4 to induce hypocotyl elongation. a, Hypocotyl length of 9-day-old seedlings of wild type, pif4, cdfq and pif4 cdfq in short-day conditions. b, Photographs of 4-day-old dark-grown seedlings. Scale bar = 1 mm. c, Hypocotyl length and d, hook curvature of 4-day-old dark-grown seedlings of WT, pif4, cdfq and pif4 cdfq. e, Length and f, width of cells in the non-dividing cell files of hypocotyls. Box plots in panel a, b, d, e and f show the minimum, 25th percentile, median, 75th percentile and maximum of data points. In a and c, n = 29 and 28 hypocotyls. n = 37 seedling hooks in d and n = 8 cell files examined over four hypocotyls (cell numbers are presented in Fig. 1b) in e and f. Letters a–c in panels a, b and d show significant differences between genotypes (P < 0.05, using one-way ANOVA followed by Tukey test, two sided), P = 1.96*10−28 in a, P = 0.16 in b and P = 0.067 in d.
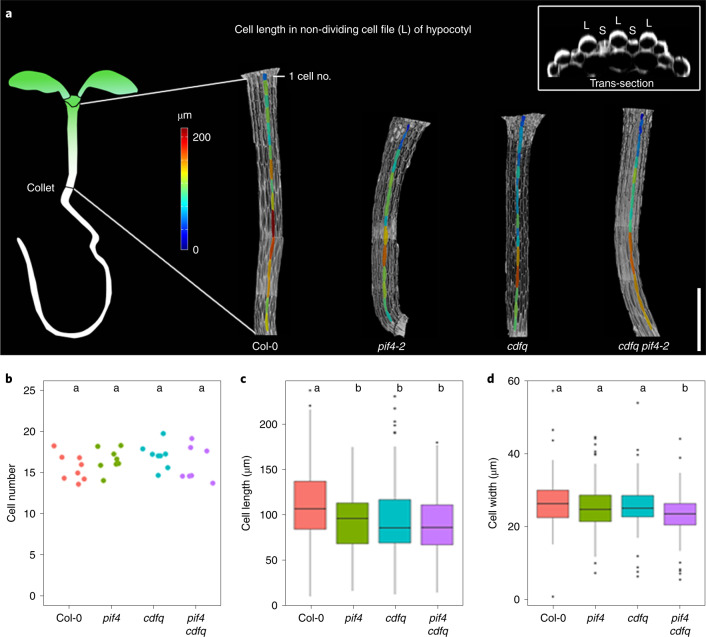
To understand the histological differences underlying variation in hypocotyl length among these genotypes, the size and number of cells in the epidermis were measured. Non-dividing cell files were examined to assess the effect of the mutations on cell growth27 (Fig. 1a). Analysis of confocal microscopy images showed that the numbers of cells in the non-dividing files were highly similar among all genotypes (Fig. 1b), although the hypocotyls of pif4, cdfq and pif4 cdfq mutants were shorter than those of Col-0 (Extended Data Fig. 1a). In each genotype, the length of cells in the non-dividing files increased basipetally from the shoot apical meristem to the collet, particularly between cells 8 and 14 (Fig. 1a and Extended Data Fig. 1e), as described for dark-grown Col-0 seedlings27. In pif4, cdfq and pif4 cdfq mutants, the mean cell length in these files was shorter than in Col-0, particularly between cells 5 and 10 (Extended Data Fig. 1e), and there was no significant difference in cell length among the mutants (Fig. 1c). The cell width of the non-dividing files decreased basipetally (Extended Data Fig. 1f). The mean cell width in the non-dividing files in pif4 cdfq was slightly narrower than that of Col-0, cdfq and pif4 plants (Fig. 1d). These histological analyses suggest that PIF4 and the CDFs act in the same genetic pathway to promote elongation of hypocotyl cells in non-dividing files.
Fig. 1. Analysis of epidermal cells in non-dividing cell files of Arabidopsis hypocotyls.
a, Heatmap quantification of cell length in the non-dividing cell files of Col-0, pif4-2, cdfq and pif4-2 cdfq grown under SDs for 7 days. Scale bar, 500 µm. Caption image shows representative transversal section of Col-0 hypocotyl. L, large non-dividing cell file; S, small dividing cell file. b,c,d, The mean cell number (b), cell length (c) and cell width (d) of the non-dividing cell files of hypocotyls. Box plots in panels c and d show the minimum, 25th percentile, median, 75th percentile and maximum of data points. Different letters in panels b, c and d represent significant differences among genotypes (P < 0.05), using ANOVA followed by Tukey’s pairwise multiple comparison, P = 0.325, 7.99 × 10⁻⁷ and 9.64 × 10⁻⁵ in b, c and d, respectively); n = 8 cell files examined over 4 hypocotyls, cell numbers are presented in Fig. 1b.
CDF2 and PIF4 are co-expressed and physically interact
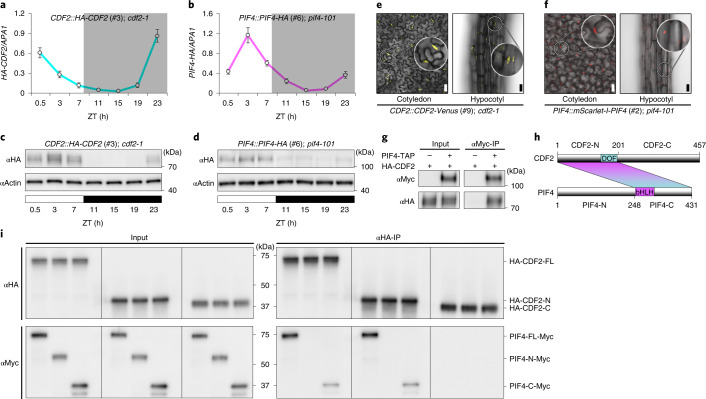
The temporal and spatial expression patterns of PIF4 and CDF2 were then compared. In a functional transgenic CDF2::HA-CDF2 cdf2-1 line (Extended Data Fig. 2a–c) grown under SDs, HA-CDF2 messenger RNA (mRNA) and protein exhibited similar diurnal cycles to those described for endogenous CDF2 (ref. 11), reaching maximum levels early in the light period (Fig. 2a,c). Under the same conditions, PIF4-HA mRNA and protein in transgenic PIF4::PIF4-HA pif4-101 plants28 also showed diurnal rhythms (Fig. 2b,d). Notably, the diurnal patterns of PIF4-HA and HA-CDF2 overlapped early in the light period, and were subsequently co-expressed for several hours (Fig. 2c,d).
Extended Data Fig. 2. Flowering time and hypocotyl length of transgenic plants carrying CDF2::HA-CDF2.
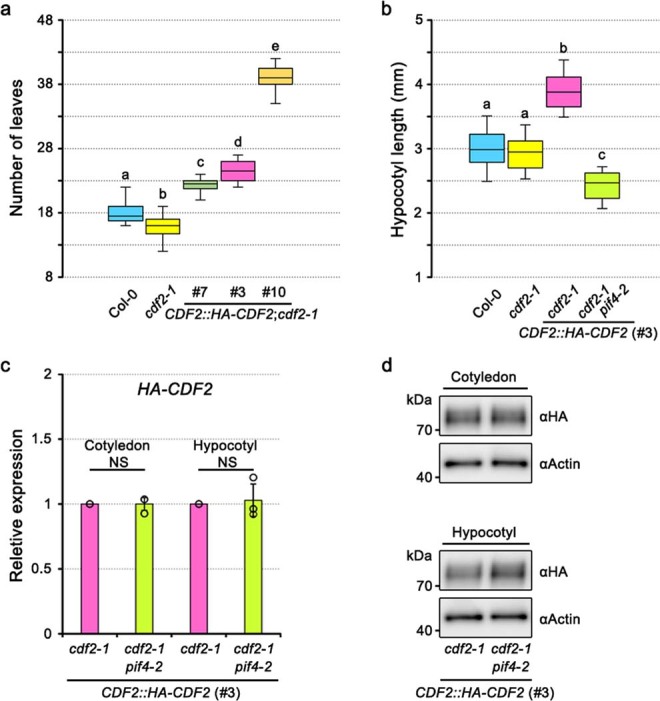
Flowering time and hypocotyl length of transgenic plants carrying CDF2::HA-CDF2. a, Flowering time of WT, cdf2-1 and CDF2::HA-CDF2 transgenic lines in long-day conditions. The total leaf number was counted for plants of WT, cdf2-1, and T3 homozygous populations of three independent transgenic lines. Data are presented as means ± SEM; n = 14 for WT, cdf2-1, #7 and #3 and n = 13 for #10 in a. Box plots in panel a show the minimum, 25th percentile, median, 75th percentile and maximum of data points. n = (14, 14, 14, 14, 14). Letters in panels a show significant differences between genotypes (P < 0.05, using one-way ANOVA followed by Tukey test, two sided), P = 7.254*10−45. b, Hypocotyl length of 9-day-old seedlings of WT, cdf2-1, CDF2::HA-CDF2 (#3), cdf2-1 and CDF2::HA-CDF2 (#3) cdf2-1 pif4-2 in short-day conditions. Box plots in panel b show the minimum, 25th percentile, median, 75th percentile and maximum of data points. n = (30, 29, 29, 30). Letters in panels b show significant differences between genotypes (P < 0.05, using one-way ANOVA followed by Tukey test, two sided), P = 1.298*10−42. c, RT-qPCR analysis of HA-CDF2 mRNA levels in cotyledons and hypocotyls of cdf2-1 or cdf2-1 pif4-2 mutants. All values are normalized to APA1 levels. Data are presented as mean values ± SEM of three biological replicates. Statistical significance was determined by pairwise one-sided t-test (P = 0.4964 and 0.3869 in cotyledon and hypocotyl, respectively). Significant P < 0.05. NS, not significant. d, Western blotting analysis of the abundance of HA-CDF2 protein in cotyledons and hypocotyls in cdf2-1 or cdf2-1 pif4-2 mutants. Actin was used as the loading control. Western blots represent one of three independent biological replicates. Tissues were harvested at ZT-0.5 to ZT-1 from 7-day-old SD-grown seedlings in c and d.
Fig. 2. Spatio-temporal expression patterns of CDF2 and PIF4, and physical interaction between the two proteins.
a,b, RT–qPCR analysis of levels of HA-CDF2 (a) and PIF4-HA (b) mRNA. Data are represented as means ± SEM of three independent amplifications. All values are normalized to APA1 levels. c,d, Western blots comparing the accumulation of HA-CDF2 (c) and PIF4-HA (d) proteins. Time (h) is expressed as hours from dawn (ZT, zeitgeber). Actin served as the loading control. RNA and protein were extracted throughout a SD in 6-day-old seedlings. Western blots in b and c were performed twice with similar results. e,f, Confocal microscopy analysis of epidermal cells of 6-day-old CDF2::CDF2-mVenus (e) and PIF4::mScarlet-I-PIF4 (f) transgenic plants grown under SD. Scale bars, 30 μm. g, HA-CDF2 protein co-immunoprecipitates with PIF4-TAP (9×Myc-6×His-3×Flag) from 6-day-old SD-grown seedlings. Co-IP experiments in b and c were performed twice with similar results. h, Box diagram of various fragments of CDF2 and PIF4 used in i. i, PIF4-Myc (C-terminal) interacts with HA-CDF2 (N-terminal) in vitro in the light. PIF4-Myc, HA-CDF2 and their truncation proteins were synthesized in a cell-free system. In vitro pull-down assays in i were performed three times with similar results.
To visualize the spatial accumulation of CDF2 and PIF4, transgenic lines expressing CDF2-mVenus and mScarlet-I-PIF4 fluorescent protein fusions from their native gene promoters were generated in cdf2-1 and pif4-2 mutants, respectively. Signals of both CDF2-mVenus and mScarlet-I-PIF4 were detected in the nuclei of epidermal cells of cotyledons and hypocotyls (Fig. 2e,f), consistent with the induction of hypocotyl growth by the epidermal-specific expression of PIF4 (ref. 17).
Whether PIF4 could physically interact with CDF2 in vivo was then tested. Plants that co-expressed 35S::PIF4-TAP (9Myc-6His-3Flag)22 and CDF2::HA-CDF2 were generated, and HA-CDF2 was co-immunoprecipitated with PIF4-TAP at ZT-0.5 in nuclear extracts from SD-grown seedlings (Fig. 2g). To understand the interaction domains between the two TFs, full-length CDF2 and PIF4 proteins as well as truncated versions were synthesized in a cell-free system attached to epitope tags (Fig. 2h). In vitro, PIF4-Myc and PIF4-C-Myc were co-immunoprecipitated with HA-CDF2-FL (full length) and HA-CDF2-N using an anti-HA antibody (αHA-IP). However, no immunoprecipitation was detected using HA-CDF2-C or PIF4-N-Myc. These results indicate that direct physical interaction occurred through the PIF4-C and CDF2-N-terminal regions, which contained the PIF4bHLH and CDF2Dof DNA binding domains, respectively (Fig. 2i). Collectively, these experiments demonstrate that CDF2 and PIF4 are spatially and temporally co-expressed, and that they interact in vivo and in vitro.
PIF4 and CDF2 bind to and co-regulate common target genes
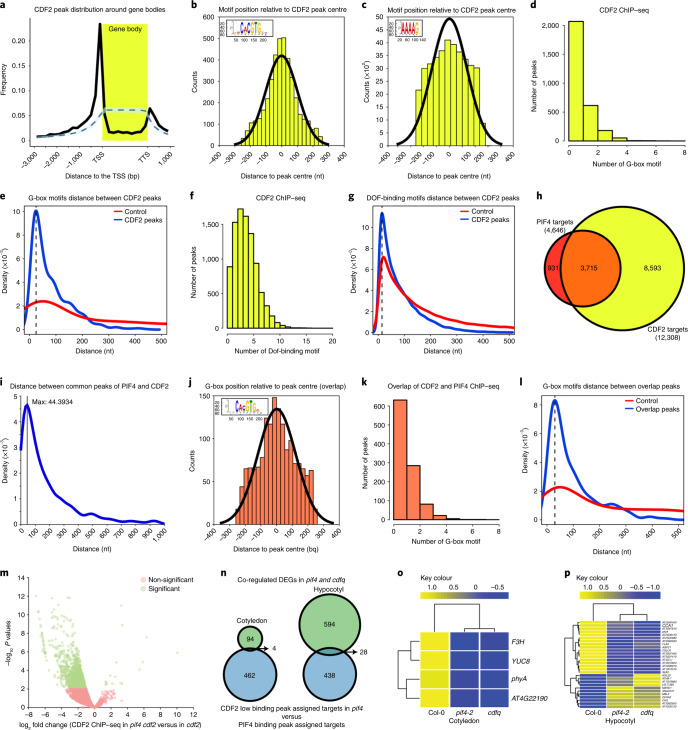
PIF4 directly interacts with other TFs through their DNA-binding domains to recognize promoters of common target genes4,29. We performed chromatin immunoprecipitation sequencing (ChIP–seq) to identify the in vivo binding sites of HA-CDF2 and to compare these with previously identified PIF4 binding sites21. A total of 9,027 CDF2 binding peaks were identified and associated with 12,308 neighbouring genes (Supplementary information, Extended Data Fig. 3a and Supplementary Table 1). The majority (81.6%) of the peaks were within 3 kb of sequence 5′ to the transcription start site of a gene (Fig. 3a), consistent with the action of CDF2 as a transcriptional regulator. The canonical DOF-binding motif AAAAG was overrepresented (E value 1.7 × 10⁻¹⁸) in the centre of the ChIP–seq peaks (Fig. 3b,c), but the G-box (CACGTG), which is recognized by PIF419,21, and closely related sequences were identified as the most enriched motifs (E value 8.5 × 10−258). About 20% of CDF2-binding peaks contained one G-box and approximately 9% contained more than one (Fig. 3d), with a peak in spacing distance of 25 bp (Fig. 3e). Similarly, 87% of CDF2-binding peaks contained two or more DOF-binding motifs, with a maximum of three per peak (Fig. 3f), and a most frequent spacing distance of 15 bp (Fig. 3g). To test whether PIF4 recognizes the G-boxes at CDF2 targets, we reanalyzed ChIP–seq data of PIF421 (Supplementary Table 2). Similar to the findings of previous studies4,21, the highest frequency (88.19%) of PIF4 occupancy was located within 3 kb of sequence 5′ to the transcription start sites of genes (Extended Data Fig. 4a), and G-boxes were remarkably enriched (E value 3.5 × 10−39) in the centre of PIF4-occupancy regions (Extended Data Fig. 4b). More than 480 (19%) PIF4 peaks contained at least two closely spaced G-boxes (Extended Data Fig. 4c), and these motifs showed a most frequent spacing distance of 30 bp, similar to the arrangement of G-boxes found in CDF2 targets (Extended Data Fig. 4d and Fig. 3e).
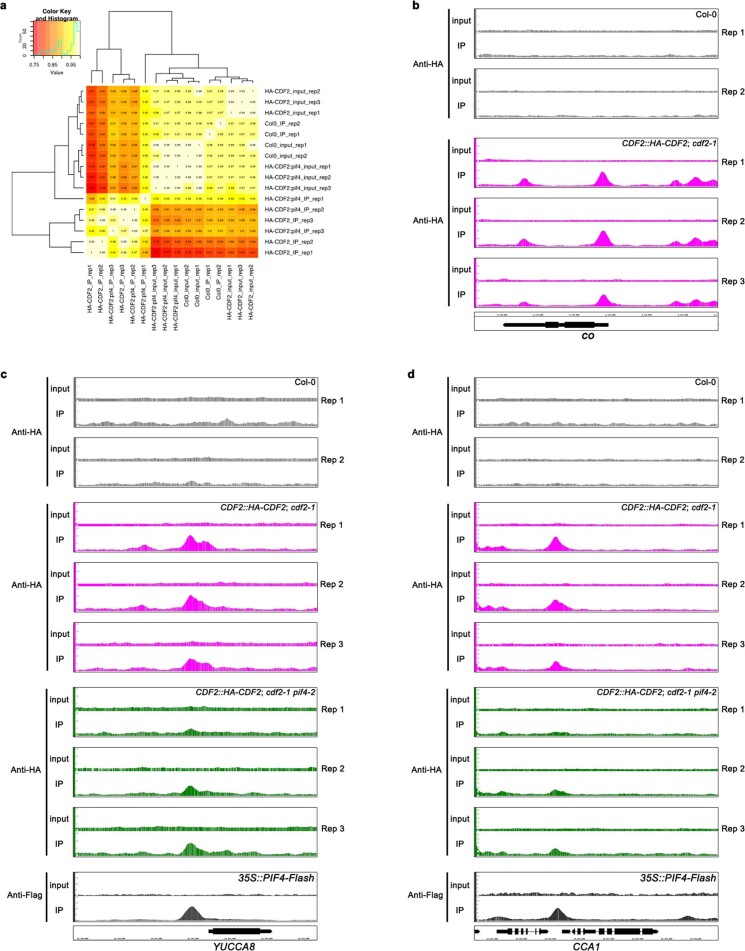
Extended Data Fig. 3. High reproducibility among the three biological replicates of ChIP-seq experiments with CDF2::HA-CDF2 in cdf2-1 and cdf2-1 pif4-2 backgrounds.
High reproducibility among the three biological replicates of ChIP-seq experiments with CDF2::HA-CDF2 in cdf2-1 and cdf2-1 pif4-2 backgrounds. a, Pearson correlation between the read coverage along the genome for input and chromatin-immunoprecipitated (IP) samples. b, CDF2-binding profile for the CONSTANS (CO) gene. The panels display two biological replicates for the ChIP-seq control in Col-0 and three biological replicates for ChIP-seq of CDF2 to the CO locus, visualized with the Integrated Genome Browser (IGB). c, CDF2- and PIF4-binding profiles to YUCCA8 and d to CIRCADIAN CLOCK ASSOCIATED1 (CCA1). Each set of panels displays two biological replicates for the ChIP-seq control in Col-0, three biological replicates for ChIP-seq of CDF2 in cdf2-1 and cdf2-1 pif4-2 backgrounds, and a single biological replicate for ChIP-seq of PIF421, visualized with the IGB.
Fig. 3. PIF4 and CDF2 bind to overlapping genomic targets and cooperatively regulate their expression.
a, Positional distribution of CDF2 ChIP–seq peaks relative to the gene body. The observed distribution (black), the 95% confidence interval (shaded blue) and mean (dashed line) of 1,000 random peak sets are shown. b, Position distribution of G-box motifs relative to the CDF2 ChIP–seq peak centres. c, Position distribution of DOF-binding motifs relative to the centre of CDF2 ChIP–seq peaks. d, Frequency distribution of the number of G-box motifs observed in CDF2 ChIP–seq peaks. e, Density plots of the distance between consecutive G-box motifs in the observed CDF2 ChIP–seq peaks (blue) and the promoters of all non-CDF2 targets (red). f, Frequency distribution of the number of DOF motifs observed in CDF2 ChIP–seq peaks. g, Density of the distances between consecutive DOF motifs in observed CDF2 ChIP–seq peaks (blue) and the promoters of non-CDF2 targets (red). h, Overlap between target genes of CDF2 and PIF4. i, Density plot showing the distribution of distances between PIF4 and CDF2 ChIP–seq peaks. j, Positional distribution of G-box motifs relative to centres of PIF4/CDF2 common ChIP–seq peaks. k, Frequency of G-box motifs observed in ChIP–seq peaks shared between PIF4 and CDF2. l, Density distribution of the distances between consecutive G-box motifs in ChIP–seq peaks common to the PIF4 and CDF2 peak sets (blue). The distribution is compared with that obtained by examining the promoters of all non-targets (red). m, Volcano plot describing the differential binding analysis of DiffBind package, by plotting the log2 fold change in binding strength against the −log10 P value of the differential binding test. The confidence threshold: false discovery rate ≤ 0.05. n, Venn diagram consistency in the direction of gene expression change in cdfQ and pif4 mutants relative to that in Col-0. o,p, Heatmap showing the z-score normalized expression values of selected genes in the cotyledon (o) and hypocotyl (p) of Col-0, cdfQ and pif4-2 mutants.
Extended Data Fig. 4. Re-analysis of PIF4 ChIP seq data.
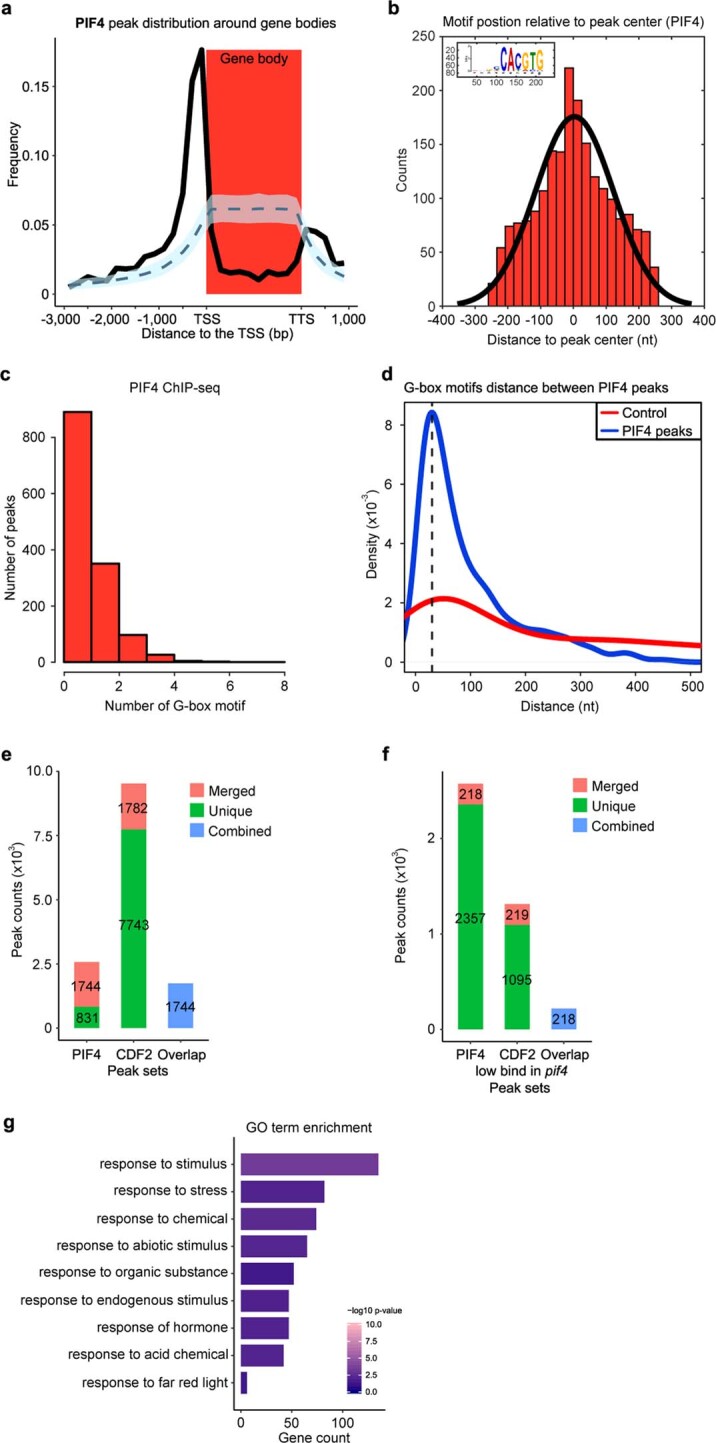
Re-analysis of PIF4 ChIP seq data. a, Positional distribution of PIF4-binding peaks on Arabidopsis genes. The observed distribution (black), the 95% confidence interval (shaded blue) and mean (dashed line) of 1,000 random peak sets are shown. b, Histogram showing the positional distribution of G-boxes relative to the peak centre (E-value = 3.5e-39). c, Histogram showing the number of PIF4 peaks with different numbers of G-box motifs. d, The distance between consecutive G-box motifs in a single PIF4 peak. The density of the distance between consecutive G-boxes in the promoters of all non-PIF targets was used as a control. e, Overlapping gene set between PIF4 and CDF2 peaks. Note that in a limited number of cases, multiple peaks in a single sample (merged peaks) overlap with a single peak in the other sample. f, Overlapping gene set between PIF4 peaks and CDF2 peaks with significantly reduced binding affinity in the pif4 mutant. Similar to in e, multiple peaks in a single sample can overlap with a single peak in the other sample. g, GO-term enrichment based on the gene set between PIF4 peaks and CDF2 peaks with significantly reduced binding affinity in the pif4 mutant. Enrichment tests were performed with topGO for each GO term separately using the Fisher Exact test. Raw p-values were adjusted using the Benjamini-Hochberg procedure. GO terms with adjusted p-values < 0.05 were considered significantly enriched.
The target genes and occupancy regions of these two TFs were then compared. The overlap among CDF2 and PIF4 target genes was highly significant (Fig. 3h and Supplementary Table 3) (P value < 2.2 × 10⁻¹⁶). In total, 1,744 common peaks of CDF2 and PIF4 were identified (Extended Data Fig. 4e), and were closely spaced (Fig. 3i). Within these common peaks, G-box motifs were significantly enriched (E value 6.1 × 10−180) in their centre (E value 2.8 × 10⁻²⁰) (Fig. 3j), at a similar number and spacing to what was observed in all PIF4 peaks (Fig. 3k,l). Therefore, CDF2- and PIF4-binding sites are closely spaced in a common set of target genes.
To test whether genome occupancy by CDF2 requires PIF4, HA-CDF2 ChIP–seq was performed in the pif4-2 mutant (Extended Data Fig. 3). A strong bias towards weaker binding of HA-CDF2 was detected in pif4-2 cdf2-1 mutants compared with that in cdf2-1 (Fig. 3m), which was not due to lower levels of mRNA or protein expression of the HA-CDF2 transgene in pif4-2 cdf2-1 (Extended Data Fig. 2d). We identified 1,314 peaks, of which 1,274 were assigned to 2,404 neighbouring genes (Supplementary Table 4) that showed differential binding of HA-CDF2 in pif4-2 cdf2-1 compared with that in cdf2-1 as determined using the DiffBind package (Methods). Approximately 16.6% (218 out of 1,314) of those peaks (Extended Data Fig. 4f), which were assigned to 466 genes (Supplementary Table 5), were also identified as being bound in the PIF4 ChIP–seq. Gene Ontology analysis of the differentially bound genes identified enrichment in several biological processes, including response to abiotic stimulus, response to far-red light, and response to hormones (Extended Data Fig. 4g), which were previously identified as highly represented in PIF4-mediated responses4,17,21.
To address how binding of PIF4–CDF2 regulates gene expression, we compared the transcriptomes of cotyledons and hypocotyls in Col-0, and in pif4 and cdfq mutants grown under SDs by RNA-sequencing (RNA-seq) (Extended Data Fig. 5). Differentially expressed genes (DEGs) in pif4-2 (Supplementary Table 6) or cdfq (Supplementary Table 7) mutants compared with Col-0 were identified using a threshold of 1.5-fold change with an adjusted P value < 0.05. Overall, more DEGs were identified in hypocotyls than in cotyledons (Extended Data Fig. 5d). Among the DEGs, 113 (P = 4.882719 × 10−74) in cotyledons and 643 (P = 0) in hypocotyls were shared between pif4-2 and cdfq mutants (Extended Data Fig. 5e,f). In both tissues and genotypes, co-regulated genes were upregulated and downregulated at similar frequencies and only 13% of DEGs in cotyledons and 3% in hypocotyls showed opposite expression patterns in the two genotypes (Extended Data Fig. 5e,f and Supplementary Tables 8 and 9).
Extended Data Fig. 5. Transcriptome gene-expression profiling in experiments performed with different genetic backgrounds and tissues.
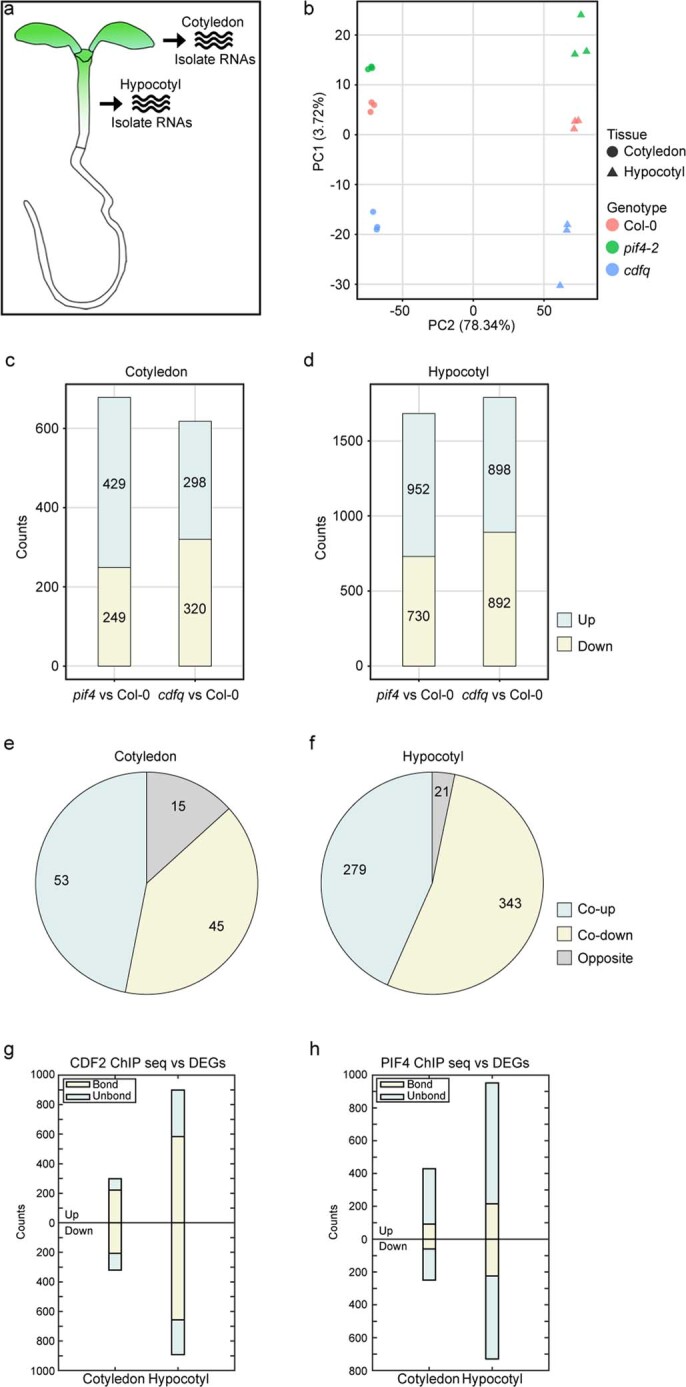
Transcriptome gene-expression profiling in experiments performed with different genetic backgrounds and tissues. a, Twenty cotyledons and fifty hypocotyls were sampled for RNA-seq. b, The two major principal components (PC) from a PC analysis of the log2(FPKM + 1)-transformed gene expression levels in the different samples. c and d, The number of significantly up- and downregulated genes in the cotyledons (c) and hypocotyls (d) of pif4 and cdfq mutants relative to the wild type. e and f, The number of genes showing the same and opposite directions of regulation in the cotyledon (e) and hypocotyls (f) of pif4 and cdfq mutants relative to the wild type. A hypergeometric test showed that the probability of the overlap between the differentially expressed genes (DEGs) in pif4 and cdfq for cotyledons and hypocotyls was 4.882719e-74 and 0, respectively, indicating that the difference in the expression level of genes in these transcriptomes is higher than expected by chance. g, Overlapping gene set between CDF2 targets and DEGs in the cdfq mutant relative to the wild type. h, Overlapping gene set between PIF4 targets and differentially expressed genes in the pif4 mutant relative to the wild type.
The target genes of CDF2 or PIF4 identified by ChIP–seq were compared with the DEGs in cotyledons and hypocotyls of each mutant (Extended Data Fig. 5g,h). Common DEGs that were bound by both PIF4 and CDF2 and that were bound less strongly by CDF2 in the pif4 mutant background were then extracted. In this way, a stringent list was identified, containing 32 genes (4 in cotyledons and 28 in hypocotyls) that were considered with high confidence to be cooperatively regulated by PIF4 and CDF2 (Fig. 3n and Supplementary Table 10). Notably, they included YUCCA8 (YUC8) (Fig. 3o and Extended Data Fig. 3c), which encodes an enzyme involved in rapid auxin biosynthesis in response to light signals and whose expression has been linked to the function of PIF TFs19,30, and in hypocotyls of CIRCADIAN CLOCK ASSOCIATED 1 (CCA1) (Fig. 3p and Extended Data Fig. 3d), which encodes a MYB-related TF that acts in the morning to mediate circadian clock-regulated hypocotyl elongation31. Both of these genes were downregulated in pif4 and cdfq mutants (Fig. 3o,p). The PIF4–CDF2 module therefore regulates different target genes in hypocotyls and cotyledons, and PIF4 enhances the strength of CDF2 association with DNA in vivo.
Open chromatin at common targets of PIF4 and CDF2
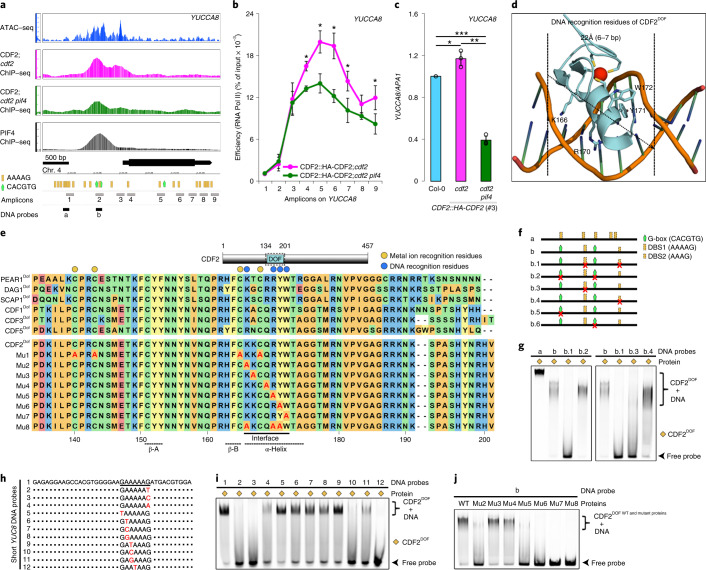
To understand in more detail how PIF4 and CDF2 coordinate transcriptional regulation, we focused on YUC8. Assay for Transposase-Accessible Chromatin using sequencing analysis showed that the binding peaks of PIF4 and CDF2 on YUC8 (ref. 32) were located in an open chromatin region (Fig. 4a). By contrast, the G-box (CACGTG) in the coding region and other DOF-binding sites (AAAAG) located throughout the whole gene body were within closed chromatin regions and were not detected in the ChIP–seq of PIF4 and CDF2, respectively (Fig. 4a). The binding affinity of CDF2 in the YUC8 promoter region was much reduced when PIF4 was absent (Fig. 4a and Supplementary Table 4), supporting the notion that PIF4 recruits CDF2 to their common targets. To initiate gene transcription, RNA polymerase II (Pol II) assembles with general initiation factors at the promoter regions of genes to form the pre-initiation complex. During pre-initiation complex assembly, the Mediator coactivator complex bridges upstream TFs and RNA Pol II33, and in tomato, PIF4 induces transcription via interaction with the Mediator subunit 25 (MED25)34. Similarly, the enrichment of RNA Pol II along the transcribed region of YUC8 showed a significant decrease when PIF4 was absent (Fig. 4b), consistent with the lower level of YUC8 mRNA in the CDF2::HA-CDF2 pif4-2 cdf2-1 mutant (Figs. 3o and 4c).
Fig. 4. Mapping and functional cooperation of PIF4 and CDF2 binding in the YUCCA8 promoter in vivo and overall structure modelling of the CDF2DOF–DNA complex.
a, Windows for Assay for Transposase-Accessible Chromatin using sequencing (ATAC–seq) analysis31 and CDF2 and PIF421 binding profile to the YUCCA8 gene. The DOF-binding sites and G-boxes are shown through the whole gene body. The locations of amplicons for ChIP–qPCR analysis in b and probes for EMSA experiments in f and g are also shown. b, ChIP–qPCR analysis of RNAPII enrichment in the transcribed regions of YUCCA8 in transgenic plants carrying CDF2::HA-CDF2 in cdf2 and cdf2 pif4 backgrounds. The transcribed region of YUCCA8 is marked with the black box that matches with positions of the analyzed amplicons in a. Data are represented as means ± SEM of three independent amplifications. Statistical significance was determined by pairwise one-sided t-test (for amplicons 1-8 in CDF2::HA-CDF2; cdf2 versus CDF2::HA-CDF2; cdf2 pif4, P = 0.396, 0.112, 0.306, 0.047, 0.017, 0.024, 0.156 and 0.03). Asterisks mark significant differences, ∗P < 0.05. c, RT–qPCR analysis of YUCCA8 mRNA levels in Col-0 WT (wild type) and transgenic plants carrying CDF2::HA-CDF2 in cdf2 and cdf2 pif4 backgrounds. Data are represented as means ± SEM of three independent amplifications. All values are normalized to APA1 levels. Statistical significance was determined by pairwise one-sided t-test (Col-0 versus CDF2::HA-CDF2; cdf2, P = 0.0328085, Col-0 versus CDF2::HA-CDF2; cdf2 pif4, P = 0.0010115 and CDF2::HA-CDF2; cdf2 versus CDF2::HA-CDF2; cdf2 pif4, P = 0.0004875). Asterisks mark significant differences, ∗P < 0.05, ∗∗P < 0.01, ∗∗∗P < 0.001. d, Modelled structure of the CDF2DOF–DNA complex. e, DOF domain architecture of CDF2 and alignment of the DOF domain among CDF1, 2, 3, 5 and PEAR1, DAG1 and SCAP1 proteins in Arabidopsis. f, Overview of the long WT and mutant DNA probes (95 bp) for EMSA experiments for analysis of CDF2DOF DNA-binding specificity and affinity. g, Interactions between CDF2DOF protein and DNA probes analyzed by EMSA. h,i, Overview of short WT (h) and mutant DNA probes (38 bp) (i) within the long YUCCA8 DNA probe, and interactions between CDF2DOF and DNA probes analyzed by EMSA. j, Mutations in the predicted residues of the CDF2DOF domain for DNA binding. Alignment among some Arabidopsis DOF TFs is shown in e. Interactions between DNA and CDF2DOF WT and mutant proteins in the predicted residues of CDF2DOF domain analyzed by EMSA. EMSA assays in g, i and j were performed three times with similar results.
Molecular basis for CDF2DOF binding to the YUCCA8 promoter
CDF2 is predicted to be highly disordered and apart from the DOF DNA-binding domain, which is highly conserved in all members of the family (Fig. 4e)6, no other structured domain(s) were predicted by AlphaFold35 and I-TASSER Suite36 (Extended Data Fig. 6a–c). Therefore, to understand in more detail how it binds to DNA, a structural model of the CDF2DOF domain was made based on the crystal structure of a zinc-finger (Zif268)–DNA complex37 (Methods and Fig. 4d). Similar to what is generally found in classical zinc-finger (ZF) proteins, one α-helix, which is inferred to contribute to DNA binding, and two β-sheets were also predicted in the CDF2DOF domain (Fig. 4d,e). Similar to the results of previous studies8, our modelling of the CDF2DOF domain showed that four cysteine residues (C140, C143, C165 and C168) in the conserved CX2CX21CX2C motif are likely to bind a metal ion (probably Zn) (Fig. 4d,e and Extended Data Fig. 7a). To stabilize the CDF2 DOF DNA-binding domain (CDF2DOF), an N-terminal maltose binding protein (MBP) was fused with it and the MBP-CDF2DOF protein was purified from Escherichia coli (Methods). Gel-filtration results showed that MBP-CDF2DOF protein was purified as a monomer (Extended Data Fig. 7b). To address the specific binding of CDF2DOF to DNA, electrophoretic mobility shift assays (EMSA) were performed using DNA probes from the YUC8 promoter (Fig. 4a,f). Fragment ‘a’, which contains five AAAAG motifs, was not bound by CDF2 in vivo (Fig. 4a), but was strongly bound by CDF2DOF in vitro (Fig. 4f,g), supporting the notion that an in vivo open chromatin status is critical for accessibility of CDF2 to DNA. Fragment ‘b’, which is within the CDF2- and PIF4-binding peak regions on YUC8 (Fig. 4a) and contains two G-boxes in addition to one AAAAG and one AAAG motif, was also bound by CDF2DOF (Fig. 4f,g). Mutation of the G-boxes did not affect binding of CDF2DOF (Fig. 4f,g), indicating that CDF2DOF does not interact with the G-box directly in vitro. By contrast, mutation of both the AAAAG and AAAG motifs abolished CDF2DOF binding, whereas mutation of the single motifs demonstrated that AAAAG was bound by CDF2DOF much more strongly than AAAG (Fig. 4f,g). The EMSA assay was then used to further identify the base pairs that are bound by CDF2DOF. The results indicated that the 5-bp core of the DOF-binding motif [T/A]AAAG led to the maximum binding affinity, explaining why the AAAAG motif in YUC8 is recognized more efficiently than the AAAG motif, and that the position of the 3′ G nucleotide is critical for the strength of binding of CDF2DOF to DNA in vitro (Fig. 4h,i).
Extended Data Fig. 6. The predicted CDF2 and PIF4 protein structure.
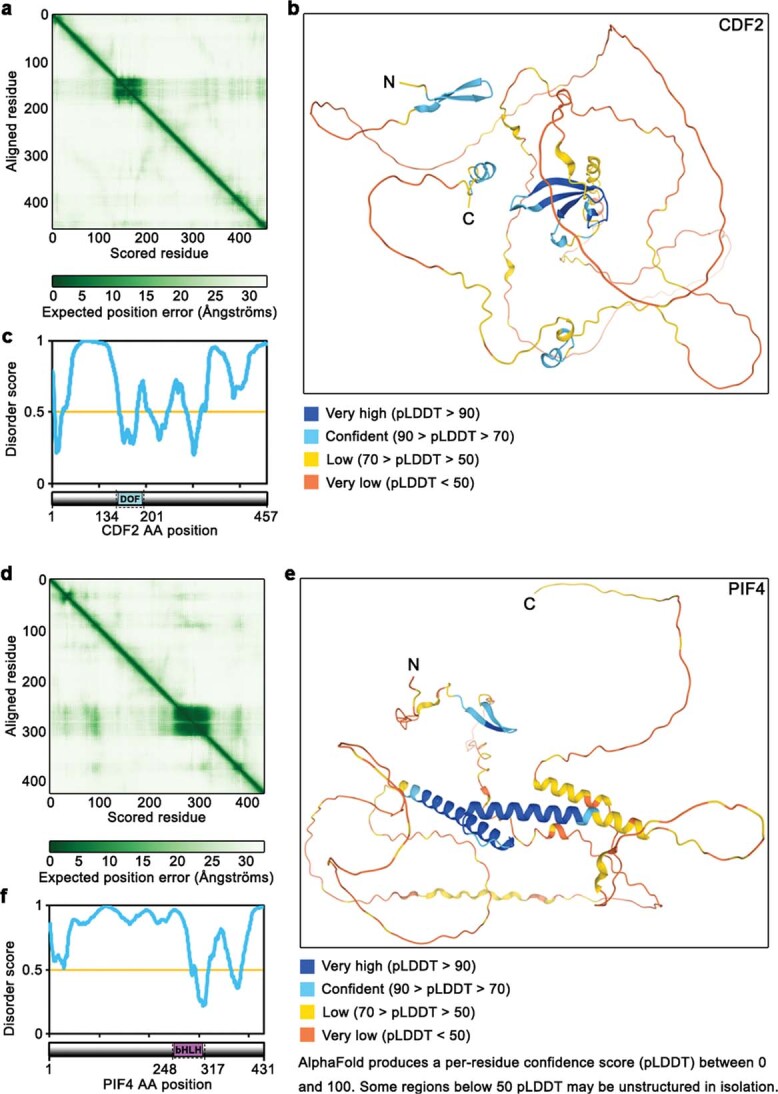
The predicted CDF2 and PIF4 protein structure. a, Predicted aligned error of CDF2. The colour at position (x, y) indicates AlphaFold’s expected position error at residue x, when the predicted and true structures are aligned on residue y. b, Overall view of predicted CDF2 protein with model confidence. c, Prediction of intrinsically disordered tendency of CDF2 (http://www.pondr.com/). d, Predicted aligned error of PIF4. The colour at position (x, y) indicates AlphaFold’s expected position error at residue x, when the predicted and true structures are aligned on residue y. e, Overall view of predicted PIF4 protein with model confidence. f, Prediction of the intrinsically disordered tendency of PIF4.
Extended Data Fig. 7. The putative interaction between a metal ion and the four cysteine residues stabilizes the structure of the CDF2DOF domain in an appropriate conformation for DNA binding.
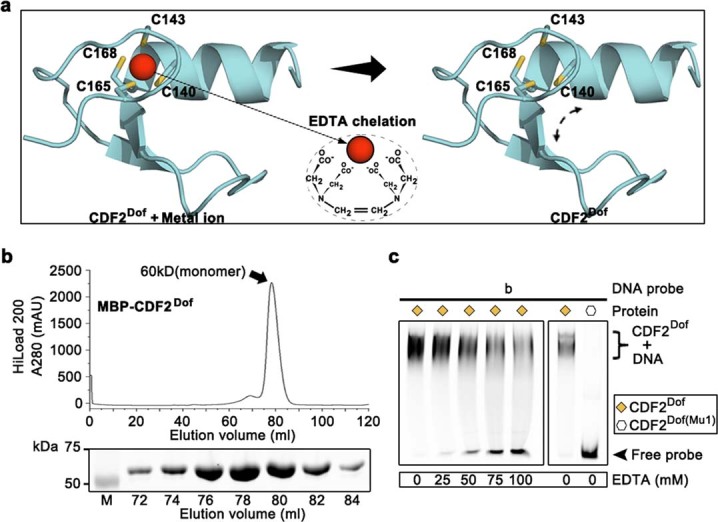
The putative interaction between a metal ion and the four cysteine residues stabilizes the structure of the CDF2DOF domain in an appropriate conformation for DNA binding. a, Modelled structure of the CDF2DOF domain with the four cysteine residues (C140, C143, C165 and C168) highlighted. Removal of the metal ion by adding a divalent metal chelator destabilizes the structure. b, Size-exclusion chromatography analysis of CDF2DOF WT protein. The CDF2DOF domain is fused with an MBP tag at the N terminus. The x-axis and y-axis indicate the elution volume and the protein absorption at 280 nm, respectively. c, Gel-shift analysis of the interactions between CDF2DOF WT, Mu1 proteins and DNA in various concentrations of EDTA. Size-exclusion chromatography analysis in b and EMSA assays in c were performed twice with similar results.
We then tested the structural model by mutating the CDF2DOF protein sequence. Binding of the metal ion to the four cysteines was predicted to strongly stabilize the CDF2DOF domain in an appropriate conformation for DNA interaction. Consistent with this, adding divalent metal chelator ethylenediaminetetraacetic acid (EDTA) or mutating the four cysteines (C140, C143, C165 and C168) to alanine (CDF2DOF (Mu1)) diminished or abolished interaction between CDF2DOF and DNA (Fig. 4e and Extended Data Fig. 7c). The structural model showed that the α-helix of CDF2DOF could fit into the DNA major groove (22 Å), and contribute to DNA binding. Mutations in Y171 (Mu6: Y171A) and W172 (Mu7: W172A) within the α-helix abolished DNA binding (Fig. 4d,e,j), as observed previously for conserved residues in DOF AOBP (ascorbate oxidase promoter-binding protein)38, and consistent with these residues contributing to DNA recognition. However, our modelled CDF2DOF–DNA complex suggested that additional residue(s) in the putative α-helix might interact with DNA (Fig. 4d). Mutation of K167 (Mu3: K167A) and Q169 (Mu4: Q169A) had no detectable effect on binding, but mutation of K166 (K166A: Mu2) and R170 (R177A: Mu5) strongly reduced DNA binding (Fig. 4e,j). These two conserved residues, which were recently identified to be important for DNA binding, are very close to C165 and C168 and conformational changes induced by metal binding might influence their accessibility to DNA. Similar to Mu7, mutation of the three residues in the α-helix of the CDF2DOF domain (Mu8: K166, R170 and Y171) abolished its DNA-binding function (Fig. 4d,e,j). Taken together, these data confirmed the known residues (Y171 and W172) and identified additional residues (K166 and R170) involved in DNA binding, extending the interface necessary for DNA binding in vitro and supporting the structural model, which indicated that these residues of CDF2DOF interact with the five-nucleotide AAAAG motif within the major groove.
Molecular basis for PIF4bHLH binding to the YUCCA8 promoter
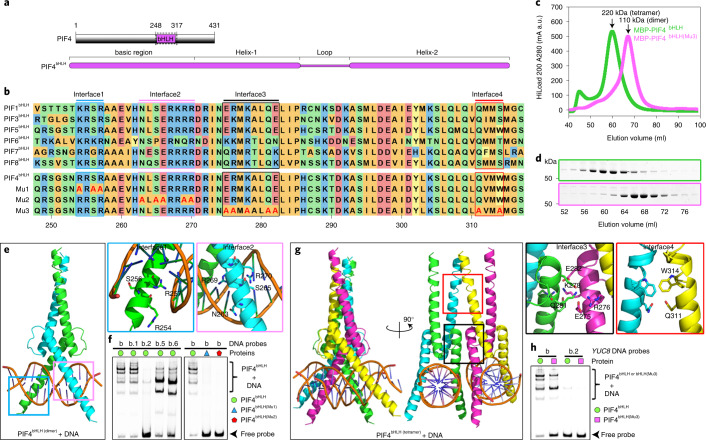
Similar to CDF2, structural modelling predicted that PIF4 protein is not well ordered (Extended Data Fig. 6d–f), except for the bHLH–DNA-binding domain, which showed a strong preference for binding the G-box (5′-CACGTG-3′)4,18,19,21 (Fig. 5a,b). To further understand the molecular basis of the interaction between the DNA-binding domain of PIF4 (PIF4bHLH) and DNA, we performed protein structure modelling based on the crystal structure of the MYC2 bHLH–DNA complex with G-box39 (Methods). This approach predicted that PIF4bHLH binds DNA as a homodimer and two interfaces in the basic region of PIF4bHLH bind DNA (Fig. 5b,e). To verify our structural modelling, PIF4bHLH was purified via an N-terminal MBP fusion that conferred greater solubility on the protein. EMSA experiments were performed with fragment ‘b’ that was used previously for the CDF2Dof experiments (Fig. 4f,i), and complexes of PIF4bHLH bound to DNA of several different sizes were detected (Fig. 5f). This complexity was largely due to the presence of two G-boxes in the fragment because it could be reduced by using shorter DNA fragments containing only one G-box (Extended Data Fig. 8) or by mutation of single G-boxes (Fig. 5f). Mutation of both G-boxes in fragment ‘b’ demonstrated that PIF4bHLH bound specifically to the G-boxes in the YUC8 promoter (Fig. 5f). Moreover, mutations in Interface 1 (R254A, S256A and R257A; PIF4bHLH (Mu1)) or Interface 2 (N263A, S265A, S266A, R269A and R270AA; PIF4bHLH (Mu2)) prevented binding to DNA (Fig. 5b,e,f), consistent with the results of previous studies on PIF3 (ref. 40). The HLH domain induces homo- and heterodimerization between different PIFs41. Gel-filtration experiments demonstrated that MBP-PIF4bHLH tended to form a homotetramers in solution (Fig. 5c,d). Previously, MYC2, a bHLH TF that functions in jasmonate signalling, was shown to form tetramers that enhanced DNA-binding strength, whereas MYC3 only formed dimers39. A multiple sequence alignment of the bHLH domains of PIFs, MYC2 and MYC3 was constructed to compare residues involved in dimerization. Most of the MYC2 bHLH residues involved in dimer formation are conserved in PIF bHLH domains, although a similar degree of conservation was observed in MYC3 and several residues varied at the C-terminus of the bHLH domains (Extended Data Fig. 9). No conserved residues associated with tetramerization could therefore be identified. To examine further the tetramerization of PIF4bHLH in solution, we modelled PIF4 bHLH homotetramer based on MYC2–DNA complex structure39 (Fig. 5g), and a mutant protein (PIF4bHLH (Mu3)) was designed to impair interaction between the two dimers of PIF4bHLH and thereby prevent tetramerization. Gel-filtration results showed that simultaneously mutating Interface 3 (E275A, R276A, K278A, Q281A and E282A) and Interface 4 (Q311A and W314A) abolished tetramerization of PIF4bHLH such that the protein formed exclusively dimers (Fig. 5b–d,g), and this caused a reduction in DNA-binding affinity (Fig. 5h). Therefore, tetramerization between two PIF4bHLH dimers enhances their DNA-binding affinity, probably because the tetramer can bind two adjacent G-boxes and bend DNA, as described previously for MYC2 (ref. 39).
Fig. 5. Overall structure modelling of the PIF4bHLH–DNA complex.
a,b, Domain architecture of PIF4 (a) and alignment of bHLH domain among PIF1, 3, 4, 5, 6, 7 and 8 proteins (b) of Arabidopsis. The dotted box on PIF4 indicates the protein boundaries used for structure modelling and gel-shift assays. c, Size-exclusion chromatography analysis of PIF4bHLH WT and mutant (Mu1) proteins. PIF4bHLH domains were fused with an MBP tag at the N terminus. The x axis and y axis indicate the elution volume and protein absorption at 280 nm. The WT PIF4bHLH and Mu1 proteins are coloured in green and pink, respectively. a.u., arbitrary units. d, Eluted protein samples from the same peak fractions of WT PIF4bHLH and Mu3 proteins from c, were subjected to SDS–PAGE followed by Coomassie blue staining. Size-exclusion chromatography analysis in d was performed twice with similar results. e, Modelled structure of the DNA-bound PIF4bHLH homodimer and zoom-in of the predicted PIF4bHLH residues that interact with DNA are coloured in blue (Interface 1) and pink (Interface 2). f, Gel-shift analysis of the interactions between PIF4bHLH WT, Mu1 and Mu2 proteins and DNA probes (as described in Fig. 4f). g, Modelled structure of the DNA-bound PIF4bHLH homotetramer and a zoom-in of the predicted PIF4bHLH residues that contribute to tetramer formation are coloured in black (Interface 3) and red (Interface 4). h, Gel-shift analysis of the interactions between PIF4bHLH WT, Mu3 proteins and DNA probes (as in Fig. 4f). Alignment of the two predicted DNA-interacting interfaces and the two protein-interacting interfaces among the Arabidopsis PIF proteins and residue mutations of those interfaces on PIF4bHLH are shown in b. EMSA assays in f and h were performed three times with similar results.
Extended Data Fig. 8. Gel-shift analysis of the interactions between PIF4bHLH WT protein and different length of DNA probes.
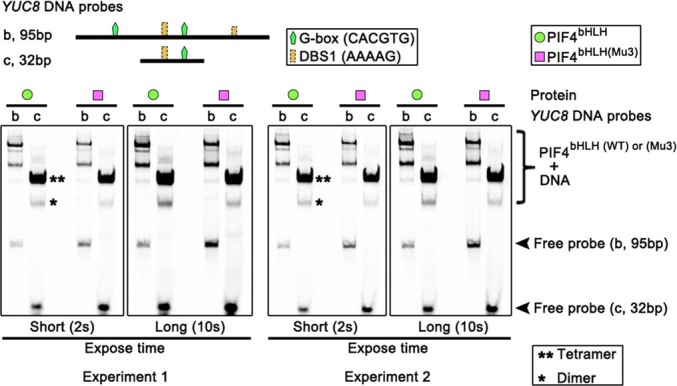
Gel-shift analysis of the interactions between PIF4bHLH WT protein and different length of DNA probes (as described in Fig. 4f). Several different sizes of complexes of PIF4bHLH bound to the longer DNA fragment, ‘b’ could be reduced using shorter DNA fragments (fragment ‘c’) containing only one G-box. EMSA assays were performed twice with similar results.
Extended Data Fig. 9. A multiple sequence alignment for PIFs and MYC2 and MYC3 proteins.
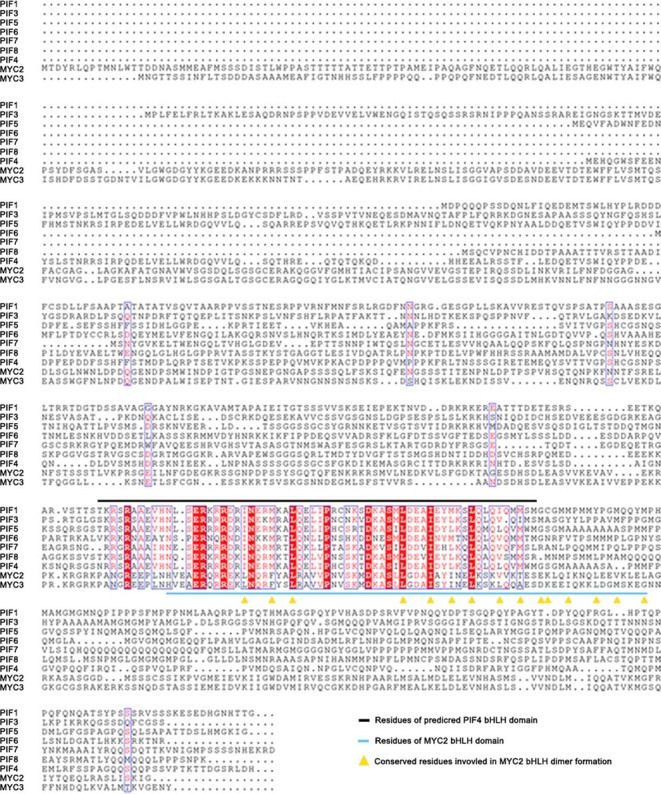
A multiple sequence alignment for PIFs and MYC2 and MYC3 proteins (https://espript.ibcp.fr/ESPript/ESPript/). Black bar, residues of predicted PIF4bHLH domain. Light blue bar, residues of MYC2 bHLH domain. Yellow triangle, residues involved in MYC2bHLH dimer formation.
Binding of PIF4bHLH to YUCCA8 enhances CDF2DOF binding
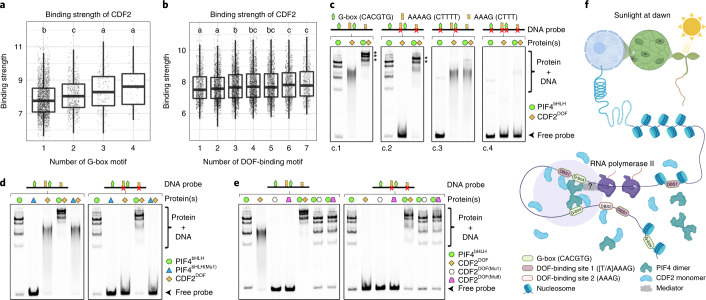
ZF proteins usually contain several tandemly arranged ZF motifs that strengthen interaction of the protein with DNA. CDF2 and other DOF proteins contain only a single ZF motif. However, the ChIP–seq analysis showed that CDF2 binding was highly correlated with the presence of G-boxes (Fig. 6a) but less so with AAAAG motifs (Fig. 6b), suggesting that PIF4 may enhance binding of CDF2 to adjacent AAAAG motifs, and thereby strengthen its specificity for particular genomic regions. On the other hand, PIF4 might also alter CDF2 specificity, because not all CDF2-binding regions that contained G-boxes also contained an adjacent AAAAG motif. Although the precise mechanism remains unknown, interaction between the two TFs might have a role in both scenarios. The involvement of protein interaction is consistent with the CDF2–PIF4 interaction observed in vivo and in vitro, which could occur through CDF2-N-terminal (1–201 amino acids (aa)) and PIF4-C-terminal (248–431 aa) regions (Fig. 2i). However, interaction between the CDF2DOF (134–201 aa) and PIF4bHLH (248–317 aa) domains used in the EMSA experiments was not detected by gel-filtration in vitro (Extended Data Fig. 10) indicating that the DNA-binding domains alone do not interact or do so very weakly. To test whether PIF4bHLH enhanced binding of CDF2DOF in vitro independently of strong interaction between them, EMSA was performed with the PIF4bHLH and CDF2DOF domains in combination. A supershift was detected with both proteins (Fig. 6c.1), indicating that they can bind to the same YUCCA8 fragment. Unexpectedly, a supershift was still detected when the AAAAG and AAAG motifs were mutated, although to a lesser extent (Fig. 6c.2). By contrast, the supershift was strongly reduced when both CACGTG G-boxes were mutated (Fig. 6c.3). No shift or supershift was detected when both G-boxes and DOF-binding motifs were mutated (Fig. 6c.4). These results indicate that PIF4bHLH binding to G-boxes is a determinant for the supershift, but that the DOF-binding motifs are not required. Consistently, the supershift was significantly reduced when mutant PIF4bHLH (Mu1) protein that cannot bind DNA was combined with wild-type DNA probe and CDF2DOF (Figs. 5 and 6d,left). Also, use of PIF4bHLH (Mu1) abolished the supershift observed with PIF4bHLH and CDF2DOF on the mutated DOF-binding motif DNA (Fig. 6d, panel right). Furthermore, no supershift was detected when PIF4bHLH was combined with CDF2DOF (Mu1) or CDF2DOF (Mu8), regardless of the presence of the DOF-binding motif (Fig. 4 and Extended Data Fig. 6). Therefore, the α-helix that is required for DNA binding by CDF2DOF (Fig. 4) is required for the supershift with PIF4bHLH, even for DNA fragments that do not contain the AAAAG and AAAG motifs, and although these two truncated proteins do not detectably interact in vitro. These results suggest that binding of PIF4bHLH to DNA induces other potential DNA interaction interface(s) of CDF2DOF to access DNA, a process related to DNA allostery that was previously described42.
Fig. 6. Binding of PIF4 on the G-boxes enhances CDF2-binding strength on DNA.
a, Binding strengths for CDF2 peaks varied significantly with the numbers of G-box motifs (CACGTG, Kruskal–Wallis test, P = 4.588 × 10⁻¹⁵). b, Binding strengths for peaks with different numbers of DOF-binding motifs (AAAAG, Kruskal–Wallis test, P = 1.964 × 10⁻⁷). Box plots in panel a and b show the minimum, 25th percentile, median, 75th percentile and maximum of data points. Letters in panels a and b show significant differences among groups (adjusted P < 0.05) using pairwise Wilcox tests. Groups that share at least one identical letter are not significantly different. c, Gel-shift analysis of the interactions between single PIF4bHLH or CDF2DOF or combination of PIF4bHLH and CDF2DOF WT proteins with WT or mutant DNA probes. d, Gel-shift analysis of the interactions between single PIF4bHLH or CDF2DOF or combination of PIF4bHLH WT or PIF4bHLH (Mu1) mutant proteins and CDF2DOF WT protein with WT or mutant DNA probes. e, Interactions between single PIF4bHLH or CDF2DOF or combinations of PIF4bHLH WT and CDF2DOF WT or CDF2DOF (Mu1 and Mu8) mutant proteins with WT or mutant DNA probes analyzed by EMSA. EMSA assays in c, d and e were performed three times with similar results. f, Proposed model for the role of the PIF4–CDF2 module in regulating gene transcription in the light. Upon chromatin opening, the E-box and DOF-binding motifs are accessible. Binding of the G-boxes by PIF4, and the DOF-binding motifs near those G-boxes by CDF2 occurs. Interaction between PIF4 and CDF2 can occur when they are bound to DNA. Binding of PIF4 to the G-boxes strengthens CDF2 binding and allows it to bind to DNA independently of the DOF-binding sites. Therefore, PIF4 recruits CDF2 to the YUCCA8 promoter. After binding of the PIF4–CDF2 module to chromatin, RNA polymerase II is recruited by PIF4 via the Mediator complex to induce gene transcription.
Extended Data Fig. 10. Size-exclusion chromatography analysis of CDF2DOF and PIF4bHLH WT proteins.
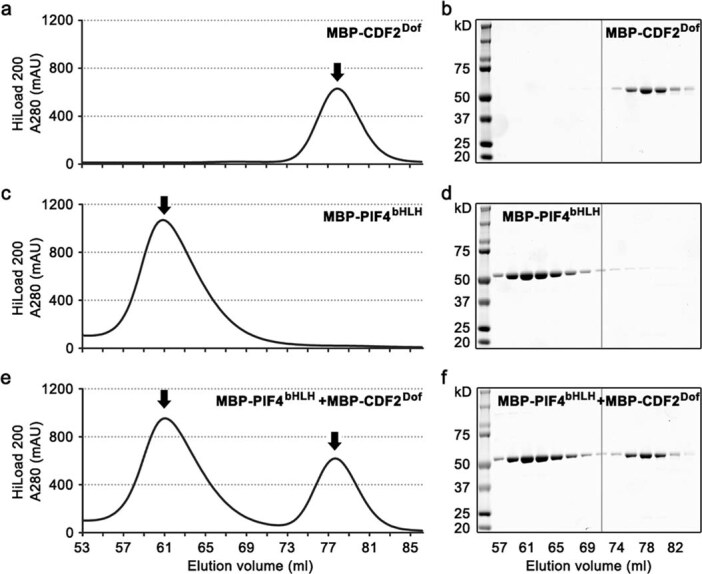
Size-exclusion chromatography analysis of CDF2DOF and PIF4bHLH WT proteins. a and b, Size-exclusion chromatography and gel analysis of CDF2DOF WT protein. c and d, Size-exclusion chromatography and gel analysis of PIF4bHLH WT protein. e and f, Size-exclusion chromatography and gel analysis of CDF2DOF and PIF4bHLH WT proteins. The CDF2DOF domain or PIF4bHLH was fused with an MBP tag at the N terminus. The x-axes and y-axes for a, c and e indicate the elution volume and the protein absorption at 280 nm, respectively. Size-exclusion chromatography analysis in b, d and f were performed twice with similar results.
Discussion
Hypocotyl cell elongation in the light requires cooperation between CDF2 and PIF4 to strongly activate transcription of YUC8 in cotyledons, consistent with the previous observation that increased auxin biosynthesis in cotyledons through the action of YUCCA enzymes promotes hypocotyl growth43. We show that in vivo, CDF2binding strength and specificity are increased in the presence of PIF4 at a subset of common target genes, including YUC8, and this probably involves direct interaction between the proteins. Furthermore, in vitro, in the presence of PIF4bHLH, CDF2DOF binds to a DNA fragment in which both DOF-binding sites are mutated, and as interaction of these two truncated proteins was undetectable by gel-filtration, this suggests that the binding of PIF4bHLH may enhance the general affinity of CDF2DOF for PIF4bHLH–DNA complex by DNA allostery42. TFs recognize their binding sites by directly interacting with specific bases, and by recognizing features of local DNA shape, such as DNA bending or unwinding5. Thus, we propose that PIF4 increases the strength and specificity of CDF2 DNA binding through protein–protein interactions that enhance sequence-specific DNA binding, and by altering local DNA shape. Whether CDFs influence PIF4 binding in vivo remains to be tested. We demonstrated that PIF4 forms tetramers and these may facilitate DNA looping, as demonstrated for MYC2 tetramers39, and thereby strengthen CDF2 binding at adjacent sites. The combinatorial interactions between PIF4 and CDF2 that we elucidated contribute to auxin biosynthesis and hypocotyl elongation in the light. Our results also enhance understanding of the transcriptional code that regulates plant gene expression in response to light and how this contributes to cell elongation.
Methods
Plant material and growth conditions
The Arabidopsis thaliana Columbia (Col-0) ecotype was used as the main experimental organism. Seeds of Col-0, pif4-2 (SAIL_1288_E07), cdf1i,2,3,5 (cdfq)11 and pif4-2 cdfq were surface-sterilized with 70% ethanol for 10 min, rinsed with 99% ethanol for 5 min, air-dried and stratified at 4 °C for 3 days. Plants were grown on soil under SD conditions (8 h light/16 h dark cycles) or were grown vertically on plates containing 1% agar supplemented with half-strength Murashige and Skoog medium (pH 5.7) at 22 °C with a light intensity of 160–180 μmol m−2 s−1 provided by LED bulbs (Philips F17T8/TL841 17 W). cdf2-1 mutant plants were grown in the greenhouse under long-day conditions (16 h light/8 h dark cycles) and were transformed by the floral dip method using Agrobacterium tumefaciens strain GV3101.
Hypocotyl length measurement
After stratification at 4 °C for 3 days, seeds were exposed to white light (at 160–180 μmol m−2 s−1) for 4 h to stimulate germination. Dark-grown plants were then kept in the dark for 4 days and SD plants were grown for 9 days before photos were taken for hypocotyl length measurements.
Confocal imaging and cell segmentation
Hypocotyls of 7-day-old seedlings grown in SDs were dissected and fixed with 4% paraformaldehyde. The fixed samples were washed twice for 5 min in phosphate-buffered saline and cleared with ClearSee solution44 for 5 days in the dark at room temperature. The cell wall was stained with Renaissance 2200 (0.1% (v/v) in ClearSee)45 for 2 days. Confocal microscopy was performed using a TSC SP8 confocal microscope (Leica) as described previously46. The Renaissance excitation and image collection wavelengths were 405 nm and 410–503 nm, respectively. The interval between z-stack sections was 1 µm for maximum intensity projections and optical sections. The z-stacks of hypocotyl images were converted to .tiff files with Fiji. The surface of the hypocotyl was extracted using MorphoGraphX (MGX) software (https://morphographx.org/)47 and the Renaissance signal of the cell wall from the outer cell layer (L1) was projected and used to segment the images. Cells were automatically segmented and then corrected manually and the geometry of the surface was displayed as Gaussian curvatures.
Generation of transgenic plants
To generate pCDF2::3HA-CDF2, the CDF2 promoter and the full-length coding region were amplified from Col-0 genomic DNA and 3HA was amplified from plasmid pALLIGATOR2 using PrimeSTAR GXL DNA Polymerase (Takara Bio), then overlap PCR was performed using CDF2 promoter, 3HA and CDF2 coding-region fragments. The pCDF2::3HA-CDF2 fragments were cloned into the binary vector PER8-GFP by SpeI and XhoI digestion using an In-Fusion HD Cloning Kit (Takara Bio). The construct was delivered into cdf2-1 via Agrobacterium GV3101 transformation using the floral dip method.
Immunoblot assays
For SD time-course western blots, about 20 mg of tissue from 6-day-old seedlings was ground into fine powder in liquid nitrogen with a TissueLyser system (QIAGEN). Total proteins were extracted using denaturing buffer (100 mM Tris-HCl pH 7.5, 100 mM NaCl, 30 mM EDTA (ethylenedinitrilotetraacetic acid, Sigma-Aldrich) pH 8.0, 4% SDS (sodium dodecyl sulfate, Sigma-Aldrich), 20% glycerol, 20 mM β-mercaptoethanol (Sigma-Aldrich), 20 mM DTT (DL-dithiothreitol, Sigma-Aldrich), 2 mM PMSF (phenylmethylsulfonyl fluoride, Sigma-Aldrich), 1× Protease Inhibitor Cocktail (Sigma-Aldrich), 80 μM MG132 (Sigma-Aldrich), 1% Halt Phosphatase Inhibitor Cocktail (Thermo Fisher Scientific) and 0.01% bromophenol blue) in a 1:5 tissue:buffer (w/v) ratio by boiling for 10 min at 90 °C. Samples were centrifuged at 16,000g for 5 min at room temperature and the supernatants were electrophoresed on a sodium dodecyl sulfate–polyacrylamide gel electrophoresis (SDS–PAGE) mini-gel to separate the proteins.
For immunoblotting the separated proteins were transferred onto a polyvinylidene fluoride membrane by the Trans-Blot Turbo Transfer System (Bio-rad). Blots were probed with anti-HA (12013819001, Roche) or anti-Actin (sc-47778, Santa Cruz) antibodies conjugated to horseradish peroxidase (HRP). The blots were developed with a 1:1 mix of SuperSignal West Femto Maximum Sensitivity and SuperSignal West Dura Extended Duration Substrates and signals were detected on a ChemiDoc MP Imaging System (Bio-rad). Anti-HA (HRP) and anti-Actin (HRP) antibodies were used at 1:2,000 and 1:4,000-fold dilutions, respectively.
In vitro pull-down assays
To express proteins in a cell-free system, 2HA-CDF2, PIF4-6Myc and the truncated DNA fragments were amplified by overlap PCR, then cloned into EcoRI-digested pTnT vector with the In-Fusion HD Cloning Kit (Takara Bio). For each construct (2HA-CDF2, PIF4-6Myc and truncated proteins (CDF2-N, 1–201 aa; CDF2-C, 202–457 aa; PIF4-N, 1–248 aa; PIF4-C, 249–431 aa)), 1.0 μg plasmid was expressed via the SP6 promoter in a cell-free system at 30 °C for 2 h in a thermocycler using the TnT Coupled Wheat Germ Extract System (Promega), according to the manufacturer’s instructions. A small amount of the reaction (2 μl) was used to verify expression of the target proteins by western blotting and the remaining extract (48 μl) was ‘snap-frozen’ in liquid nitrogen and stored at −80 °C.
For protein pull-downs, 60 μl extract (30 μl of 2HA-CDF2 or 30 μl of 2HA-CDF2 and 30 μl of PIF4-6Myc) was mixed with 540 μl IP buffer (22 mM Tris-HCl, pH 7.5; 84 mM NaCl; 1.1 mM EDTA; 0.11% Triton X-100 and 1× Plant Protease Inhibitor Cocktail (Sigma)) and rotated in the dark at 4 °C for 30 min. To pull down proteins, 30 μl of Dynabeads Protein G beads (Thermo Fisher Scientific) coated with 10 μl anti-Myc antibody (Cell Signaling Technology) was added to the diluted protein solution and was rotated for 30 min at 4 °C. The beads were washed five times with wash buffer (20 mM Tris-HCl, pH 7.5; 150 mM NaCl; 1 mM EDTA; 0.5% Triton X-100 and 0.1× Plant Protease Inhibitor Cocktail). Proteins were eluted from the beads with 2× SDS–PAGE sample buffer and then subjected to immunoblotting analysis. Anti-HA (HRP) and anti-Myc (HRP-conjugated, 2040S, CST) antibodies were used at 1:5,000-fold dilution.
In vivo co-immunoprecipitation assays
The in vivo co-immunoprecipitation (Co-IP) assays were performed as previously described, with minor modifications48. In brief, 1 g of 6-day-old SD-grown F1 seedlings (35 S::PIF4-TAP x CDF2::3HA-CDF2) was harvested at ZT-1. The seedlings were ground to fine powder in liquid nitrogen, semi-pure nuclei extractions were performed and nuclear proteins were released by a short sonication.
For co-immunoprecipitation, 30 μl of Dynabeads Protein G beads coated with 10 μl anti-Myc antibody was added to the diluted nuclear protein solution (0.5% Triton X-100, 1 mM EDTA, 20 mM Tris-HCl, pH 7.5, and 100 mM NaCl and 1× Protease Inhibitor Cocktail (Sigma-Aldrich)) and rotated for 45 min at 4 °C. The beads were washed five times with IP buffer. Proteins were eluted from the beads with 2× SDS–PAGE sample buffer and then subjected to immunoblotting analysis. For immunoblotting, anti-HA (HRP) and anti-Myc (HRP) antibodies were used at 1:2,500-fold dilution.
Chromatin immunoprecipitation
ChIP methods were described previously with minor modifications48. For ChIP–seq of CDF2, 9 g above-ground tissue of 6-day-old SD-grown seedlings was harvested at ZT-1 and cross-linked for 10 min by vacuum filtration in phosphate-buffered saline solution containing 1% formaldehyde. For chromatin immunoprecipitation, 50 μl Dynabeads Protein G beads (Thermo Fisher Scientific) coated with 20 μl anti-HA antibody (ab9110, Abcam) was incubated for 4 h with 3 ml of the diluted chromatin solution (1% Triton X-100, 1 mM EDTA, 0.08% SDS, 15 mM Tris-HCl, pH 8.0, and 150 mM NaCl). After washing three times with wash buffer (1% NP-40, 1 mM EDTA, 0.1% SDS, 0.1% DOC (sodium deoxycholate, Sigma-Aldrich), 20 mM Tris-HCl, pH 8.0, and 150 mM NaCl), the immune complex was eluted from the beads in 400 μl elution buffer (1% SDS and 0.1 M NaHCO3). Next, samples were reverse cross-linked with 5 μl Proteinase K and 20 μl 5 M NaCl at 65 °C overnight and DNA was purified by a MinElute PCR Purification Kit (QIAGEN). Amounts of input DNA were quantified by fluorometry (Quantus, Promega) and the size of the fragments was analyzed by ultra-sensitive capillary electrophoresis (Agilent FEMTOpulse). ChIP–seq libraries were generated according to Ovation Ultralow Library Systems v2 (Tecan Genomics) with an adjusted cycle number that reflected the input amount. Sequencing-by-synthesis was performed on a HiSeq 3000 device at the Max Planck Genome-Centre Cologne in 150-bp single-read mode.
Raw single-end reads were preprocessed by removing potential sequencing adapters using cutadapt49 and trimming low quality bases at both ends with Trimmomatic50. The processed reads were mapped to the Arabidopsis thaliana genome version TAIR10 with Bowtie2 (ref. 51). Alignments with mapping quality less than 30 were discarded using SAMtools52. For initial peak calling using MACS v.2 (ref. 53), the resulting alignment files were fed in pairs consisting of ChIP–seq and corresponding input samples. For consistency with the differential binding assays, final merged peak calling was obtained with the DiffBind R package54. ChiPpeakAnno55 was used to assign peaks to genes if they were within 3 kb and 1 kb upstream or downstream from the transcription start or end site, respectively. The position of peaks relative to gene bodies was compared with a positional distribution obtained from 1,000 random peak sets with equal peak-size distributions as the observed set. Motif discovery was performed using MEME–ChIP56. CentriMo57 was used to determine the enrichment of motifs in the centre of peaks. Distances between consecutive motifs and the number of motifs per peak were obtained using custom python scripts. Differential binding assays of CDF2 peak locations between CDF2::HA-CDF2; cdf2-1 and CDF2::HA-CDF2; cdf2-1 pif4-2 were performed with DiffBind (Bioconductor, https://bioconductor.org/packages/release/bioc/html/DiffBind.html).
For ChIP–qPCR of RNA polymerase II, 9 g of above-ground tissue from 6-day-old SD-grown seedlings was harvested at ZT-1, cross-linked with 1 mM DSG (di(N-succinimidyl) glutarate, SYNCHEM) by vacuum filtration in phosphate-buffered saline solution for 10 min and then cross-linked for another 10 min with 1% formaldehyde. Chromatin immunoprecipitations were performed as described above with 30 μl Dynabeads Protein G beads coated with 10 μl anti-RNA polymerase II (ab5131, Abcam) and the resulting DNA was used for ChIP–qPCR. The primers used for ChIP–qPCR are listed in Supplementary Table 11.
Gene expression and whole-transcriptomic RNA-sequencing analysis
To quantify PIF4 and CDF2 mRNA and protein accumulation in diurnal conditions, 6-day-old seedlings were harvested every 3 h and were flash-frozen in liquid nitrogen. Total RNA was extracted with an RNeasy plant Mini Kit (QIAGEN) with an on-column DNase (QIAGEN) treatment. cDNA was synthesized from 0.8 μg RNA using a QuantiTect Reverse Transcription Kit (QIAGEN). Real-time PCR was performed with iQ SYBR Green Supermix (Bio-rad) in a CFX384 Touch Real-Time PCR Detection System (Bio-rad). Two reference genes, PP2A and APA1, were used for normalization. Three technical replicates for each of three independent biological replicates were performed for each experiment and representative results are presented. The primers used for reverse transcription with quantitative PCR (RT–qPCR) are listed in Supplementary Table 1.
For RNA-seq, cotyledons and hypocotyls were dissected from 6-day-old seedlings at ~ZT-1–ZT-1.5 and were flash-frozen in liquid nitrogen. RNA was extracted as above and RNA quality was assessed by capillary electrophoresis (NanoChip, Agilent Bioanalyser). Poly-A RNA was enriched from 500 ng total RNA by the Poly(A) mRNA Magnetic Isolation Module (New England Biolabs). RNA-seq libraries were prepared using the Ultra II Directional RNA Library Prep Kit for Illumina (New England Biolabs). Thirteen cycles were applied to enrich library concentration. Sequencing-by-synthesis was performed on a HiSeq 3000 device at the Max Planck Genome-Centre Cologne in 2 × 150 bp paired-end read mode. Raw paired-end RNA-seq reads were cleaned using the same work-flow as for the ChIP–seq reads. The cleaned reads were used to quantify the expression levels of Arabidopsis thaliana transcripts in the AtRTD258 and dataset using Salmon59. Differential expression analyses at the gene level were performed with the DESeq2 R package60. Principle component analysis of gene expression was performed with values of log2(FPKM + 1) expression level using the prcomp function R. All Gene Ontology-term enrichment analyses related to the ChIP–seq and RNA-seq datasets were performed using the TopGO R package61. All statistical tests related to the NGS (next-generation sequencing) data were performed in R.
Protein expression and purification
Codons of the coding sequences of CDF2DOF and PIF4bHLH domains from Arabidopsis thaliana were optimized to E. coli and cloned into pMAL-c5X-His Vector (NEB). CDF2DOF domain was between 133 and 201 aa, whereas the PIF4bHLH domain was between 248 and 317 aa. The wild-type CDF2DOF, PIF4bHLH and mutant proteins were induced by 0.7 mM IPTG (Sigma) and expressed in ArcticExpress cells (Agilgent Technologies) at 12 °C, overnight. The E. coli cells were collected by centrifugation, resuspended in wash buffer (25 mM Bis-Tris pH 8.0, 150 mM NaCl and 15 mM imidazole) and sonicated to prepare cell lysates. The proteins were purified using Ni-NTA beads (GE), the bound proteins were washed five times with wash buffer and eluted using elution buffer (25 mM Bis-Tris pH 8.0, 150 mM NaCl and 250 mM imidazole). The eluted proteins were further purified by size-exclusion chromatography (HiLoad 200, GE Healthcare) in buffer containing 25 mM Bis-Tris pH 8.0, and 150 mM NaCl.
Structural modelling
The structures of CDF2 and PIF4 full length, and CDF2 DOF domain and PIF4 bHLH domain were predicted using AlphaFold35 and I-TASSER Suite36, respectively. The modelled structure of CDF2 DOF–DNA complex was based on the zif268–DNA complex (PDB ID 1ZAA)37. The dimer and tetramer modelled structures of PIF4 bHLH were based on MYC2 bHLH–DNA complex with G-box (PDB ID 5GNJ)39. The structure data were processed using the program Coot and PyMOL softwares.
Gel-shift assay (EMSA)
The long double-stranded DNA probe (95 bp) covering the two G-boxes and two DOF-binding sites was synthesized by PCR using 5′-Cy5-labelled oligo primers. the short double-stranded DNA probe (38 bp) covering one G-box and one DOF-binding site was synthesized by annealing single-stranded 5′-Cy5-labelled oligo in annealing buffer (10 mM Tris (pH 8.0), 50 mM NaCl, and 1 mM EDTA (pH 8.0)). Binding reactions were carried out in buffer containing 10 mM Tris, 50 ng μl−1 Poly (dI-dC), 50 mM KCl, 10 mM KCl, 1 mM DTT, 5% glycerol and 0.1% NP-40. Samples were kept in the light on ice for 30 min and were then loaded onto 6% DNA Retardation Gels (Thermo Fisher Scientific) and run in 0.5× Tris/Borate/EDTA buffer at room temperature for 90 min at 70 V. Binding signals were visualized using a ChemiDoc MP Imaging System (Bio-Rad). The primers used for DNA probes are listed in Supplementary Table 11.
Reporting summary
Further information on research design is available in the Nature Research Reporting Summary linked to this article.
Supplementary information
Supplementary Tables 1–11: 1, CDF2 ChIP–seq binding peaks assigned to neighbouring genes; 2, PIF4 ChIP–seq binding peaks assigned to neighbouring genes; 3, Common binding peaks of CDF2 and PIF4 assigned to neighbouring genes; 4, ChIP–seq differential binding of CDF2 in pif4 assigned to neighbouring genes; 5, Common genes assigned by differential binding peaks of CDF2 in pif4 and PIF4-binding peaks; 6, Differentially expressed genes (DEGs) in cotyledons and hypocotyls of pif4; 7, Differentially expressed genes (DEGs) in cotyledons and hypocotyls of cdfq; 8, Co-regulated genes in cotyledons of pif4 and cdfq; 9, Co-regulated genes in hypocotyls of pif4 and cdfq; 10, Common DEGs that were bound by both PIF4 and CDF2, and were bound less strongly by CDF2 in pif4; 11, Primers used in this study.
Acknowledgements
We thank H. Liu (SIPPE, Shanghai, CHN) for 35S::PIF4-TAP and C. Fankhauser for providing PIF4::PIF4-citrine-3HA pif4-101 transgenic lines. We thank F. Turck, A. Pajoro, M. Cerise, V. Falavigna and J. Chandler for critical reading of the article. This work was funded by the Deutsche Forschungsgemeinschaft through Cluster of Excellence CEPLAS (EXC 2048/1 Project ID: 390686111). The laboratory of G.C. receives core funding from the Max Planck Society.
Extended data
Source data
Statistical source data.
Unprocessed western blots and gels.
Statistical source data.
Unprocessed western blots and gels.
Statistical source data.
Statistical source data.
Unprocessed western blots and gels.
Unprocessed western blots and gels.
Author contributions
H.G., W.S., J.C. and G.C. designed the experiments. H.G. and G.C. initiated the project and wrote the article. H.G., W.S., A.V, R.F., B.H. and R.R. conducted the experiments. W.S. contributed the modelling of protein structures. E.S. contributed to the bioinformatic data analysis.
Peer review
Peer review information
Nature Plants thanks Enamul Huq and Xiao-Dong Su for their contribution to the peer review of this work.
Funding
Open access funding provided by Max Planck Society
Data availability
All data needed to evaluate the conclusions in the paper are present in the paper or the supplementary materials. Mutants, transgenic plants and all plasmid constructions using CDF2 and PIF4 are available from G.C. under a material transfer agreement with the Max Planck Institute for Plant Breeding Research. Raw data are available from RNA-seq series PRJNA747146 and ChIP–seq series PRJNA747820. Source data are provided with this paper.
Competing interests
The authors declare no competing interests.
Footnotes
Publisher’s note Springer Nature remains neutral with regard to jurisdictional claims in published maps and institutional affiliations.
These authors contributed equally: Wen Song, Edouard Severing.
Extended data
is available for this paper at 10.1038/s41477-022-01213-y.
Supplementary information
The online version contains supplementary material available at 10.1038/s41477-022-01213-y.
References
- 1.Stathopoulos A, Levine M. Genomic regulatory networks and animal development. Dev. Cell. 2005;9:449–462. doi: 10.1016/j.devcel.2005.09.005. [DOI] [PubMed] [Google Scholar]
- 2.Riechmann JL, et al. Arabidopsis transcription factors: genome-wide comparative analysis among eukaryotes. Science. 2000;290:2105–2110. doi: 10.1126/science.290.5499.2105. [DOI] [PubMed] [Google Scholar]
- 3.Zinzen RP, Girardot C, Gagneur J, Braun M, Furlong EE. Combinatorial binding predicts spatio-temporal cis-regulatory activity. Nature. 2009;462:65–70. doi: 10.1038/nature08531. [DOI] [PubMed] [Google Scholar]
- 4.Oh E, Zhu JY, Wang ZY. Interaction between BZR1 and PIF4 integrates brassinosteroid and environmental responses. Nat. Cell Biol. 2012;14:802–809. doi: 10.1038/ncb2545. [DOI] [PMC free article] [PubMed] [Google Scholar]
- 5.Slattery M, et al. Absence of a simple code: how transcription factors read the genome. Trends Biochem. Sci. 2014;39:381–399. doi: 10.1016/j.tibs.2014.07.002. [DOI] [PMC free article] [PubMed] [Google Scholar]
- 6.Ruta V, et al. The DOF transcription factors in seed and seedling development. Plants (Basel) 2020;9:218. doi: 10.3390/plants9020218. [DOI] [PMC free article] [PubMed] [Google Scholar]
- 7.Yanagisawa S, Schmidt RJ. Diversity and similarity among recognition sequences of Dof transcription factors. Plant J. 1999;17:209–214. doi: 10.1046/j.1365-313X.1999.00363.x. [DOI] [PubMed] [Google Scholar]
- 8.Yanagisawa S. Dof domain proteins: plant-specific transcription factors associated with diverse phenomena unique to plants. Plant Cell Physiol. 2004;45:386–391. doi: 10.1093/pcp/pch055. [DOI] [PubMed] [Google Scholar]
- 9.Kloosterman B, et al. Naturally occurring allele diversity allows potato cultivation in northern latitudes. Nature. 2013;495:246–250. doi: 10.1038/nature11912. [DOI] [PubMed] [Google Scholar]
- 10.Imaizumi T, Schultz TF, Harmon FG, Ho LA, Kay SA. FKF1 F-box protein mediates cyclic degradation of a repressor of CONSTANS in Arabidopsis. Science. 2005;309:293–297. doi: 10.1126/science.1110586. [DOI] [PubMed] [Google Scholar]
- 11.Fornara F, et al. Arabidopsis DOF transcription factors act redundantly to reduce CONSTANS expression and are essential for a photoperiodic flowering response. Dev. Cell. 2009;17:75–86. doi: 10.1016/j.devcel.2009.06.015. [DOI] [PubMed] [Google Scholar]
- 12.Martin G, et al. Circadian waves of transcriptional repression shape PIF-regulated photoperiod-responsive growth in Arabidopsis. Curr. Biol. 2018;28:311–318. doi: 10.1016/j.cub.2017.12.021. [DOI] [PubMed] [Google Scholar]
- 13.Corrales AR, et al. Characterization of tomato Cycling Dof Factors reveals conserved and new functions in the control of flowering time and abiotic stress responses. J. Exp. Bot. 2014;65:995–1012. doi: 10.1093/jxb/ert451. [DOI] [PubMed] [Google Scholar]
- 14.Fornara F, et al. The GI-CDF module of Arabidopsis affects freezing tolerance and growth as well as flowering. Plant J. 2015;81:695–706. doi: 10.1111/tpj.12759. [DOI] [PMC free article] [PubMed] [Google Scholar]
- 15.Slattery M, et al. Cofactor binding evokes latent differences in DNA binding specificity between Hox proteins. Cell. 2011;147:1270–1282. doi: 10.1016/j.cell.2011.10.053. [DOI] [PMC free article] [PubMed] [Google Scholar]
- 16.Lee S, Wang WL, Huq E. Spatial regulation of thermomorphogenesis by HY5 and PIF4 in Arabidopsis. Nat. Commun. 2021;12:3656. doi: 10.1038/s41467-021-24018-7. [DOI] [PMC free article] [PubMed] [Google Scholar]
- 17.Kim S, et al. The epidermis coordinates thermoresponsive growth through the phyB-PIF4-auxin pathway. Nat. Commun. 2020;11:1053. doi: 10.1038/s41467-020-14905-w. [DOI] [PMC free article] [PubMed] [Google Scholar]
- 18.Huq E, Quail PH. PIF4, a phytochrome-interacting bHLH factor, functions as a negative regulator of phytochrome B signaling in Arabidopsis. EMBO J. 2002;21:2441–2450. doi: 10.1093/emboj/21.10.2441. [DOI] [PMC free article] [PubMed] [Google Scholar]
- 19.Hornitschek P, et al. Phytochrome interacting factors 4 and 5 control seedling growth in changing light conditions by directly controlling auxin signaling. Plant J. 2012;71:699–711. doi: 10.1111/j.1365-313X.2012.05033.x. [DOI] [PubMed] [Google Scholar]
- 20.Koini MA, et al. High temperature-mediated adaptations in plant architecture require the bHLH transcription factor PIF4. Curr. Biol. 2009;19:408–413. doi: 10.1016/j.cub.2009.01.046. [DOI] [PubMed] [Google Scholar]
- 21.Pedmale UV, et al. Cryptochromes interact directly with PIFs to control plant growth in limiting blue light. Cell. 2016;164:233–245. doi: 10.1016/j.cell.2015.12.018. [DOI] [PMC free article] [PubMed] [Google Scholar]
- 22.Ma DB, et al. Cryptochrome 1 interacts with PIF4 to regulate high temperature-mediated hypocotyl elongation in response to blue light. Proc. Natl Acad. Sci. USA. 2016;113:224–229. doi: 10.1073/pnas.1511437113. [DOI] [PMC free article] [PubMed] [Google Scholar]
- 23.Nozue K, et al. Rhythmic growth explained by coincidence between internal and external cues. Nature. 2007;448:358–361. doi: 10.1038/nature05946. [DOI] [PubMed] [Google Scholar]
- 24.Greenham K, McClung CR. Integrating circadian dynamics with physiological processes in plants. Nat. Rev. Genet. 2015;16:598–610. doi: 10.1038/nrg3976. [DOI] [PubMed] [Google Scholar]
- 25.Martin G, et al. The photoperiodic response of hypocotyl elongation involves regulation of CDF1 and CDF5 activity. Physiol. Plant. 2020;169:480–490. doi: 10.1111/ppl.13119. [DOI] [PubMed] [Google Scholar]
- 26.Nomoto Y, Kubozono S, Yamashino T, Nakamichi N, Mizuno T. Circadian clock- and PIF4-controlled plant growth: a coincidence mechanism directly integrates a hormone signaling network into the photoperiodic control of plant architectures in Arabidopsis thaliana (vol 53, pg 1950, 2012) Plant Cell Physiol. 2013;54:643–643. doi: 10.1093/pcp/pcs137. [DOI] [PubMed] [Google Scholar]
- 27.Bou Daher F, et al. Anisotropic growth is achieved through the additive mechanical effect of material anisotropy and elastic asymmetry. eLife. 2018;7:e38161. doi: 10.7554/eLife.38161. [DOI] [PMC free article] [PubMed] [Google Scholar]
- 28.Yamashino T, et al. Verification at the protein level of the PIF4-mediated external coincidence model for the temperature-adaptive photoperiodic control of plant growth in Arabidopsis thaliana. Plant Signal Behav. 2013;8:e23390. doi: 10.4161/psb.23390. [DOI] [PMC free article] [PubMed] [Google Scholar]
- 29.Zhu JY, Oh E, Wang T, Wang ZY. TOC1-PIF4 interaction mediates the circadian gating of thermoresponsive growth in Arabidopsis. Nat. Commun. 2016;7:13692. doi: 10.1038/ncomms13692. [DOI] [PMC free article] [PubMed] [Google Scholar]
- 30.Li L, et al. Linking photoreceptor excitation to changes in plant architecture. Gene Dev. 2012;26:785–790. doi: 10.1101/gad.187849.112. [DOI] [PMC free article] [PubMed] [Google Scholar]
- 31.Wang ZY, Tobin EM. Constitutive expression of the CIRCADIAN CLOCK ASSOCIATED 1 (CCA1) gene disrupts circadian rhythms and suppresses its own expression. Cell. 1998;93:1207–1217. doi: 10.1016/S0092-8674(00)81464-6. [DOI] [PubMed] [Google Scholar]
- 32.Lu Z, et al. The prevalence, evolution and chromatin signatures of plant regulatory elements. Nat. Plants. 2019;5:1250–1259. doi: 10.1038/s41477-019-0548-z. [DOI] [PubMed] [Google Scholar]
- 33.Osman S, Cramer P. Structural biology of RNA polymerase II transcription: 20 years on. Annu. Rev. Cell Dev. Biol. 2020;36:1–34. doi: 10.1146/annurev-cellbio-042020-021954. [DOI] [PubMed] [Google Scholar]
- 34.Sun W, et al. Mediator subunit MED25 physically interacts with PHYTOCHROME INTERACTING FACTOR4 to regulate shade-induced hypocotyl elongation in tomato. Plant Physiol. 2020;184:1549–1562. doi: 10.1104/pp.20.00587. [DOI] [PMC free article] [PubMed] [Google Scholar]
- 35.Jumper J, et al. Highly accurate protein structure prediction with AlphaFold. Nature. 2021;596:583–589. doi: 10.1038/s41586-021-03819-2. [DOI] [PMC free article] [PubMed] [Google Scholar]
- 36.Yang J, et al. The I-TASSER Suite: protein structure and function prediction. Nat. Methods. 2015;12:7–8. doi: 10.1038/nmeth.3213. [DOI] [PMC free article] [PubMed] [Google Scholar]
- 37.Pavletich NP, Pabo CO. Zinc finger-DNA recognition: crystal structure of a Zif268-DNA complex at 2.1 A. Science. 1991;252:809–817. doi: 10.1126/science.2028256. [DOI] [PubMed] [Google Scholar]
- 38.Shimofurutani N, Kisu Y, Suzuki M, Esaka M. Functional analyses of the Dof domain, a zinc finger DNA-binding domain, in a pumpkin DNA-binding protein AOBP. FEBS Lett. 1998;430:251–256. doi: 10.1016/S0014-5793(98)00670-X. [DOI] [PubMed] [Google Scholar]
- 39.Lian TF, Xu YP, Li LF, Su XD. Crystal structure of tetrameric Arabidopsis MYC2 reveals the mechanism of enhanced interaction with DNA. Cell Rep. 2017;19:1334–1342. doi: 10.1016/j.celrep.2017.04.057. [DOI] [PubMed] [Google Scholar]
- 40.Al-Sady B, Kikis EA, Monte E, Quail PH. Mechanistic duality of transcription factor function in phytochrome signaling. Proc. Natl Acad. Sci. USA. 2008;105:2232–2237. doi: 10.1073/pnas.0711675105. [DOI] [PMC free article] [PubMed] [Google Scholar]
- 41.Leivar P, Monte E. PIFs: systems integrators in plant development. Plant Cell. 2014;26:56–78. doi: 10.1105/tpc.113.120857. [DOI] [PMC free article] [PubMed] [Google Scholar]
- 42.Kim S, et al. Probing allostery through DNA. Science. 2013;339:816–819. doi: 10.1126/science.1229223. [DOI] [PMC free article] [PubMed] [Google Scholar]
- 43.Kohnen MV, et al. Neighbor detection induces organ-specific transcriptomes, revealing patterns underlying hypocotyl-specific growth. Plant Cell. 2016;28:2889–2904. doi: 10.1105/tpc.16.00463. [DOI] [PMC free article] [PubMed] [Google Scholar]
- 44.Kurihara D, Mizuta Y, Sato Y, Higashiyama T. ClearSee: a rapid optical clearing reagent for whole-plant fluorescence imaging. Development. 2015;142:4168–4179. doi: 10.1242/dev.127613. [DOI] [PMC free article] [PubMed] [Google Scholar]
- 45.Musielak TJ, Schenkel L, Kolb M, Henschen A, Bayer M. A simple and versatile cell wall staining protocol to study plant reproduction. Plant Reprod. 2015;28:161–169. doi: 10.1007/s00497-015-0267-1. [DOI] [PMC free article] [PubMed] [Google Scholar]
- 46.Kinoshita A, et al. Regulation of shoot meristem shape by photoperiodic signaling and phytohormones during floral induction of Arabidopsis. eLife. 2020;9:e60661. doi: 10.7554/eLife.60661. [DOI] [PMC free article] [PubMed] [Google Scholar]
- 47.de Reuille PB, et al. MorphoGraphX: a platform for quantifying morphogenesis in 4D. eLife. 2015;4:05864. doi: 10.7554/eLife.05864. [DOI] [PMC free article] [PubMed] [Google Scholar]
- 48.Hyun Y, et al. Multi-layered regulation of SPL15 and cooperation with SOC1 integrate endogenous flowering pathways at the Arabidopsis shoot meristem. Dev. Cell. 2016;37:254–266. doi: 10.1016/j.devcel.2016.04.001. [DOI] [PubMed] [Google Scholar]
- 49.Kechin A, Boyarskikh U, Kel A, Filipenko M. cutPrimers: a new tool for accurate cutting of primers from reads of targeted next generation sequencing. J. Comput Biol. 2017;24:1138–1143. doi: 10.1089/cmb.2017.0096. [DOI] [PubMed] [Google Scholar]
- 50.Bolger AM, Lohse M, Usadel B. Trimmomatic: a flexible trimmer for Illumina sequence data. Bioinformatics. 2014;30:2114–2120. doi: 10.1093/bioinformatics/btu170. [DOI] [PMC free article] [PubMed] [Google Scholar]
- 51.Langmead B, Salzberg SL. Fast gapped-read alignment with Bowtie 2. Nat. Methods. 2012;9:357–359. doi: 10.1038/nmeth.1923. [DOI] [PMC free article] [PubMed] [Google Scholar]
- 52.Li H, et al. The Sequence Alignment/Map format and SAMtools. Bioinformatics. 2009;25:2078–2079. doi: 10.1093/bioinformatics/btp352. [DOI] [PMC free article] [PubMed] [Google Scholar]
- 53.Zhang Y, et al. Model-based analysis of ChIP-Seq (MACS) Genome Biol. 2008;9:R137. doi: 10.1186/gb-2008-9-9-r137. [DOI] [PMC free article] [PubMed] [Google Scholar]
- 54.Ross-Innes CS, et al. Differential oestrogen receptor binding is associated with clinical outcome in breast cancer. Nature. 2012;481:389–393. doi: 10.1038/nature10730. [DOI] [PMC free article] [PubMed] [Google Scholar]
- 55.Zhu LJ, et al. ChIPpeakAnno: a Bioconductor package to annotate ChIP-seq and ChIP-chip data. BMC Bioinformatics. 2010;11:237. doi: 10.1186/1471-2105-11-237. [DOI] [PMC free article] [PubMed] [Google Scholar]
- 56.Ma W, Noble WS, Bailey TL. Motif-based analysis of large nucleotide data sets using MEME-ChIP. Nat. Protoc. 2014;9:1428–1450. doi: 10.1038/nprot.2014.083. [DOI] [PMC free article] [PubMed] [Google Scholar]
- 57.Bailey TL, Machanick P. Inferring direct DNA binding from ChIP-seq. Nucleic Acids Res. 2012;40:e128. doi: 10.1093/nar/gks433. [DOI] [PMC free article] [PubMed] [Google Scholar]
- 58.Zhang R, et al. A high quality Arabidopsis transcriptome for accurate transcript-level analysis of alternative splicing. Nucleic Acids Res. 2017;45:5061–5073. doi: 10.1093/nar/gkx267. [DOI] [PMC free article] [PubMed] [Google Scholar]
- 59.Patro R, Duggal G, Love MI, Irizarry RA, Kingsford C. Salmon provides fast and bias-aware quantification of transcript expression. Nat. Methods. 2017;14:417–419. doi: 10.1038/nmeth.4197. [DOI] [PMC free article] [PubMed] [Google Scholar]
- 60.Love MI, Huber W, Anders S. Moderated estimation of fold change and dispersion for RNA-seq data with DESeq2. Genome Biol. 2014;15:550. doi: 10.1186/s13059-014-0550-8. [DOI] [PMC free article] [PubMed] [Google Scholar]
- 61.Alexa A, Rahnenfuhrer J, Lengauer T. Improved scoring of functional groups from gene expression data by decorrelating GO graph structure. Bioinformatics. 2006;22:1600–1607. doi: 10.1093/bioinformatics/btl140. [DOI] [PubMed] [Google Scholar]
Associated Data
This section collects any data citations, data availability statements, or supplementary materials included in this article.
Supplementary Materials
Supplementary Tables 1–11: 1, CDF2 ChIP–seq binding peaks assigned to neighbouring genes; 2, PIF4 ChIP–seq binding peaks assigned to neighbouring genes; 3, Common binding peaks of CDF2 and PIF4 assigned to neighbouring genes; 4, ChIP–seq differential binding of CDF2 in pif4 assigned to neighbouring genes; 5, Common genes assigned by differential binding peaks of CDF2 in pif4 and PIF4-binding peaks; 6, Differentially expressed genes (DEGs) in cotyledons and hypocotyls of pif4; 7, Differentially expressed genes (DEGs) in cotyledons and hypocotyls of cdfq; 8, Co-regulated genes in cotyledons of pif4 and cdfq; 9, Co-regulated genes in hypocotyls of pif4 and cdfq; 10, Common DEGs that were bound by both PIF4 and CDF2, and were bound less strongly by CDF2 in pif4; 11, Primers used in this study.
Data Availability Statement
All data needed to evaluate the conclusions in the paper are present in the paper or the supplementary materials. Mutants, transgenic plants and all plasmid constructions using CDF2 and PIF4 are available from G.C. under a material transfer agreement with the Max Planck Institute for Plant Breeding Research. Raw data are available from RNA-seq series PRJNA747146 and ChIP–seq series PRJNA747820. Source data are provided with this paper.


