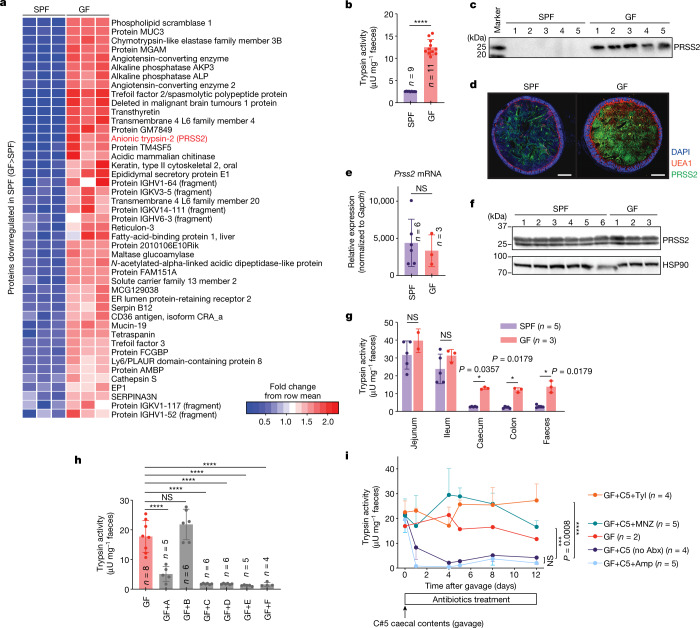
Fig. 1. Microbiota-mediated regulation of trypsin in the large intestine.
a, Proteins with reduced levels in the caecum of SPF mice compared with in the caecum of GF mice, as determined by proteome analysis. b, Faecal trypsin activity in SPF mice compared with in GF mice. c, Western blot analysis of trypsin (PRSS2) in the faeces of SPF and GF mice. d, Immunostaining of colon sections of SPF and GF mice. Blue, DAPI; green, PRSS2; red, UEA1 (mucus). e,f, Prss2 expression levels in the pancreas of SPF or GF mice measured using quantitative PCR with reverse transcription (RT–qPCR) (e) and western blotting (f). Heat-shock protein 90 (HSP90) was the loading control. g, Trypsin activity of intestinal contents at the indicated locations. h, Faecal trypsin activity of GF mice or GF mice inoculated with faecal samples from the indicated healthy donors (A–F). i, Trypsin activity in faeces of GF mice after inoculation with the caecal contents of mouse C5 and concomitant treatment with antibiotics (Abx) or vehicle control. For b, e and g–i, data are mean ± s.d. Each dot represents one mouse (b, e, g and h). Statistical analysis was performed using two-sided Mann–Whitney U-tests with Welch’s correction (nonparametric) (b, e and g) and one-way analysis of variance (ANOVA) with Tukey’s test (h and i); ****P < 0.0001, ***P < 0.001, *P < 0.05; NS, not significant. For d, scale bar, 500 μm. For c, a representative image from two independent experiments with similar results is shown. For f, images from one experiment including all of the mice used in e are shown. Blot source data are provided in Supplementary Fig. 1.

