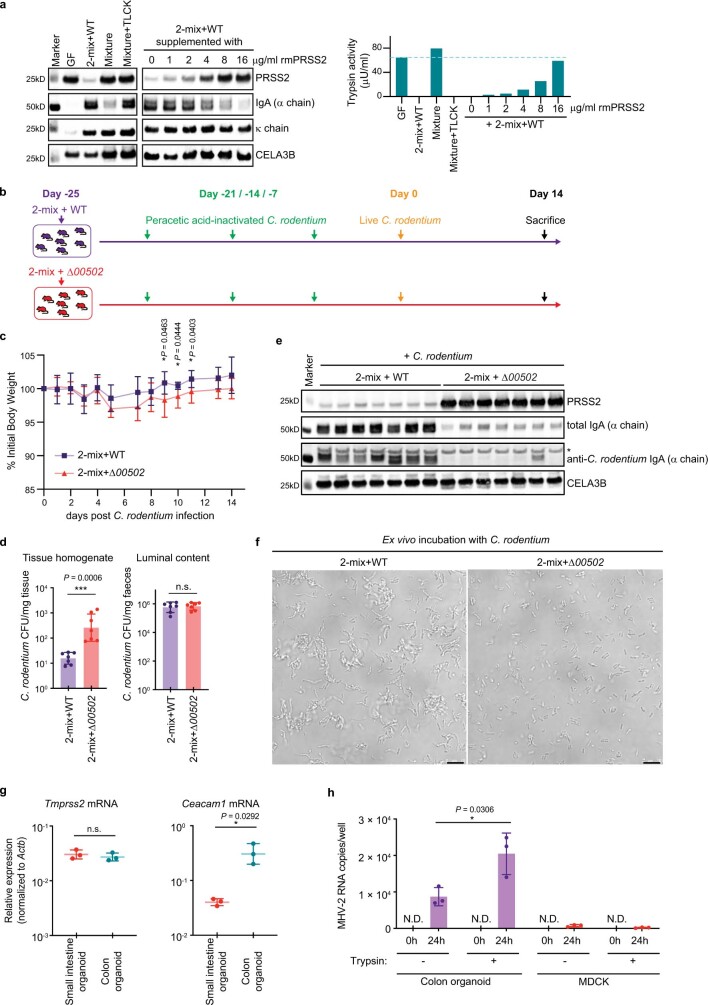
Extended Data Fig. 10. Low trypsin levels enhanced the effectiveness of oral vaccines against Citrobacter rodentium in vivo and reduced MHV-2 infection in mouse intestinal organoids.
a, Ex vivo degradation of IgA heavy chain by trypsin: faeces from the 2-mix+WT P. clara-colonized mice (2-mix+WT) and germ-free mice (GF) were diluted and filtered, incubated alone, mixed together (Mixture), or mixed in the presence of trypsin-specific inhibitor TLCK (Mixture+TLCK). Alternatively, faeces from the 2-mix+WT P. clara-colonized mice (2-mix+WT) were incubated with the indicated concentrations of recombinant mouse trypsin (rmPRSS2). After incubation at 37 °C for 24 h the indicated proteins were analysed by Western Blot (left panel, anti-mouse PRSS2 antibody was used to detect both faecal and recombinant mouse PRSS2). Right panel: trypsin activity of the loaded samples (left panel). b, Schematic of the experimental setup for C. rodentium vaccination and infection (c–f). GF mice were inoculated with WT or Δ00502 P. clara JCM14859 strains (together with the 2-mix), orally vaccinated with peracetic acid-inactivated C. rodentium once per week for three weeks, followed by C. rodentium infection via oral gavage. c, Changes in body weight of mice following C. rodentium infection. d, Caecal patches and luminal contents were collected on day 14 post infection and analysed for C. rodentium CFU. e, Western Blot analysis for the indicated proteins in the caecal luminal contents following C. rodentium vaccination and infection. * non-specific band. See Materials & Methods for detection of total and C. rodentium-specific IgA. f, Agglutination effect of the filtered caecal suspension from 2-mix+WT P. clara- and 2-mix+Δ00502 P. clara-colonized mice (following C. rodentium vaccination and infection), as demonstrated by incubation with an in vitro culture of live C. rodentium. g, Relative expression of transmembrane protease, serine 2 (TMPRSS2) and CEA cell adhesion molecule 1 (CEACAM1) in the organoids derived from mouse small intestine and colon was determined by RT-qPCR using β-Actin (ACTB) as the reference gene. h, Colon organoids were infected with MHV-2 at MOI (multiplicity of infection) = 1 in the presence or absence of bovine trypsin for 2 h and washed with DMEM/F12 medium to remove uninfected virus. The viral RNA was quantified by RT-qPCR at 24 hrs post infection. MDCK cell line expressing the canine CEACAM1 with low homology to rodent CEACAM1 was used as the negative control. c, d, n = 7 mice per group. Data shown as mean ± s.d. (c) and geometric mean ± geometric s.d. (d); *** p < 0.001; * p < 0.05; n.s., not significant. Two-sided multiple unpaired t-tests (not corrected for multiple comparisons) (c) and two-sided Mann-Whitney test with Welch’s correction (nonparametric) (d). Each dot represents one mouse (d). g, h, n = 3 wells of cells per group. Each dot represents one well of cells. Data shown as mean ± s.d. * p < 0.05; n.s., not significant. Two-sided unpaired t test (parametric). N. D., not detected (h). Scale bar: 10 μm (f). a, f, Representative images from two experiments with similar results (f), or images from one experiment (a) are shown. e, Images from one experiment including all the mice used in panel c are shown. See Supplementary Figure 1 for blot source data.

