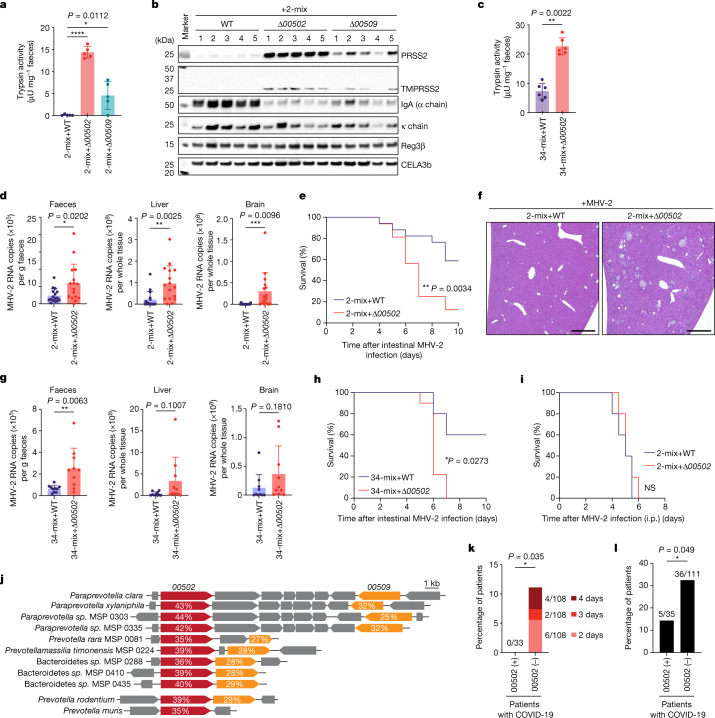
Fig. 4. Paraprevotella-mediated degradation of trypsin modulates colonic homeostasis.
a–c, GF mice were colonized with the indicated P. clara strains together with the 2-mix (a,b; n = 5 mice per group) or the 34-mix (c; n = 6 mice per group) for 14 days. Faecal trypsin activity (a,c) and the amount of indicated proteins (b; determined by western blotting) are shown. d–f, The viral RNA levels in the faeces or the indicated tissues (d), survival curve (e) and representative images of haematoxylin and eosin (H&E) staining of liver sections (f) of GF+2-mix+WT or GF+2-mix+Δ00502 mice infected with MHV-2 (intragastric inoculation). Among the 32 (GF+2-mix+WT group) and 33 (GF+2-mix+Δ00502 group) infected mice, 16 mice from each group were euthanized on day 5 for tissue viral RNA analysis (d) and the rest of the mice were followed for survival analysis (e). g,h, Viral RNA levels (g) and survival curve (h) of GF+34-mix+WT or GF+34-mix+Δ00502 mice after intragastric inoculation with MHV-2. n = 15 mice per group (10 mice were euthanized on day 5 for tissue viral RNA analysis and the rest of the mice were followed for survival analysis). i, Survival curve of GF+2-mix+WT or GF+2-mix+Δ00502 mice intraperitoneally injected with MHV-2. n = 5 mice per group. j, Genome neighbourhood of the homologues of the P. clara 00502-00509 locus in human and mouse (P. rodentium and P. muris) gut microorganisms. The percentage amino acid identity with P. clara 00502 and 00509 is shown. k,l, The frequency of patients with COVID-19 experiencing more than 1 day with more than 2 diarrhoeal episodes per day (k) or requiring oxygen inhalation therapy (l), stratified by the presence (00502 (+)) or absence (00502 (−)) of 00502 homologue genes in the faecal metagenome. For a, c, d and g, data are mean ± s.d. Each dot represents one mouse. Statistical analysis was performed using one-way ANOVA with Tukey’s test (a), two-sided Mann–Whitney U-tests with Welch’s correction (nonparametric) (c, d and g), log-rank (Mantel–Cox) tests (e, h and i) and one-sided Fisher’s tests (k and l); ****P < 0.0001, ***P < 0.001, **P < 0.01, *P < 0.05. For f, scale bar, 500 μm. For b, images from one experiment, including all of the mice used in a, are shown. Blot source data are provided in Supplementary Fig. 1.

