Fig. 4.
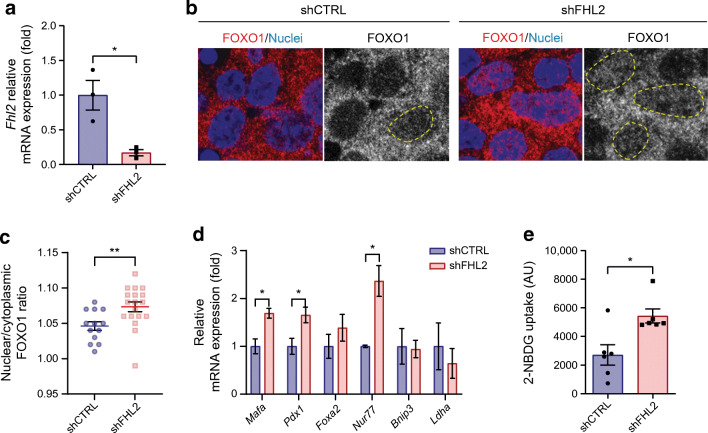
Knockdown of FHL2 in MIN6 cells leads to FOXO1 nuclear localisation and increased activity. (a) Relative mRNA expression of Fhl2 in cells transduced with control shCTRL and shFHL2 (n=3). (b) FOXO1 (red) and nuclear DAPI (blue) immunofluorescent staining of shCTRL and shFHL2 cells; staining of FOXO1 alone is shown in grey, with FOXO1-positive nuclei indicated by yellow lines. (c) Quantification of FOXO1 staining as the ratio of nuclear over cytoplasmic intensity in MIN6 cells (n=13 and n=18 for shCTRL and shFHL2, respectively). (d) Relative mRNA expression of FOXO1 target genes (Mafa, Pdx1, Foxa2, Nur77, Bnip3 and Ldha) in shCTRL and shFHL2 cells (n=3). (e) Uptake of fluorescently labelled glucose (2-NBDG) measured in arbitrary units (AU) by shCTRL and shFHL2 cells (n=6). Data are presented as mean ± SEM; *p<0.05 and **p<0.01

