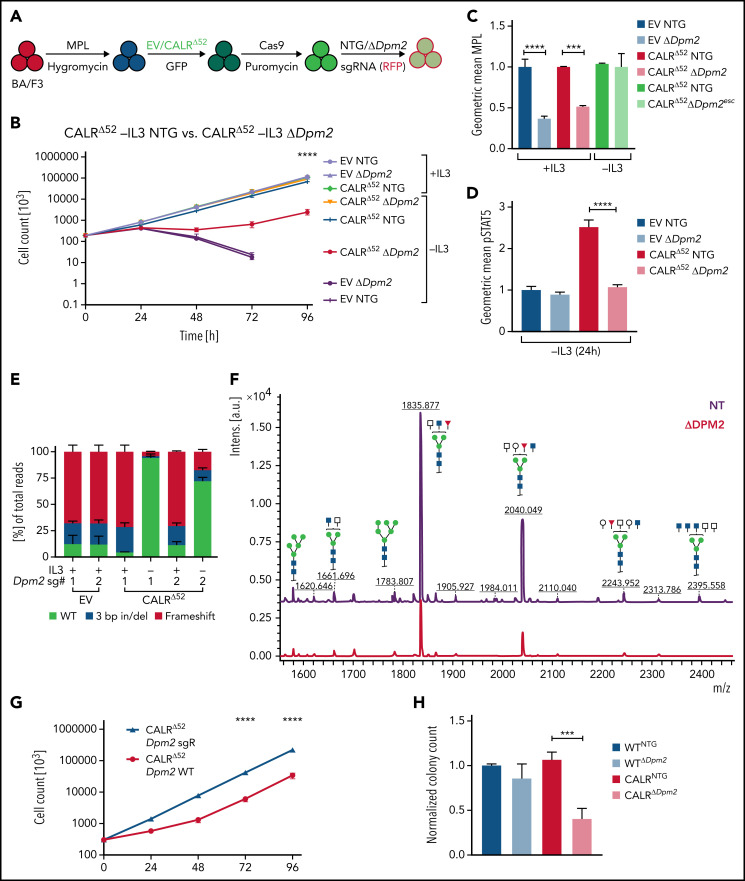
Figure 3.
In-depth validation of the N-glycan biosynthesis pathway as an essential pathway for growth of mutant CALR-expressing hematopoietic cells. (A) Experimental setup: parental BA/F3 cells were infected with MPL-expressing virus, selected for 21 days with hygromycin, and infected with either EV- or CALRΔ52-expressing virus carrying GFP. GFP+ cells were subsequently sorted and transduced with Cas9-carrying virus. Following 7 days of puromycin selection (1 mg/mL), cells were then infected with RFP-expressing viruses containing either 1 of 2 NT sgRNAs (NTG) or 1 of 2 sgRNAs directed against Dpm2. RFP+ cells were sorted and subsequently subjected to functional assays. N = 2 independent biological replicates for BA/F3-MPL-EV and -CALRΔ52-Cas9. Two NTGs and 2 targeting sgRNAs per biological replicate with a total of n = 4 biological replicates per genotype. (B) Growth curves of independent biological replicates and the 2 different sgRNAs were combined in the analysis. Cells were assayed either in the presence or absence of IL3 (+IL3/−IL3) for up to 96 hours. The assay was performed n = 3 for all 4 biological replicates of both genotypes. Statistical significance was determined by 2-way analysis of variance (ANOVA). Mean plus and minus standard error of the mean (SEM). ****P < .00001. The most important statistical analysis is highlighted. (C) Cell surface expression for MPL of the cells used in (B), determined by flow cytometry. (D) phosphorylated STAT5 levels 24 hours upon withdrawal of IL3 of indicated cell lines. (C-D) Statistical significance was determined by 1-way ANOVA. Mean plus SEM. **P < .01; ****P < .0001. (E) NGS results of the CRISPR-targeted regions in the Dpm2 gene in the cell lines depicted. In the CALRΔ52 Dpm2-targeted −IL3 condition (96 hours post IL3 withdrawal), there is a strong enrichment for Dpm2 WT subclones as compared with the CALRΔ52 Dpm2-targeted +IL3 condition, indicating that Dpm2 is required for the growth of CALRΔ52-transformed cells. Mean plus SEM. (F) N-glycan profile of immunoprecipitated MPL from BA/F3-MPL-EVΔ52-Cas9-NTG and BA/F3-MPL-EVΔ52-Cas9-ΔDpm2 cells. (G) Growth curve of BA/F3-MPL-CALRΔ52-Cas9-ΔDpm2-WT and -Dpm2-sgRNA-resistant (sgR) cells grown for 96 hours upon IL3 withdrawal. N = 3 in duplicate. Statistical significance was determined by 1-way ANOVA. ****P < .0001. Mean plus or minus SEM. (H) Colony-forming assays on RFP-sorted CALRΔ52 VaviCre Cas9 BM transduced with NTG or Dpm2-targeting (ΔDpm2) RFP virus. N = 4 to 5 in technical duplicates. Statistical significance was determined by 1-way ANOVA. Mean plus SEM. ***P < .001. a.u., arbitrary units; esc, escapee: these are cells that survived IL3 withdrawal for 96 hours.

