Figure 7.
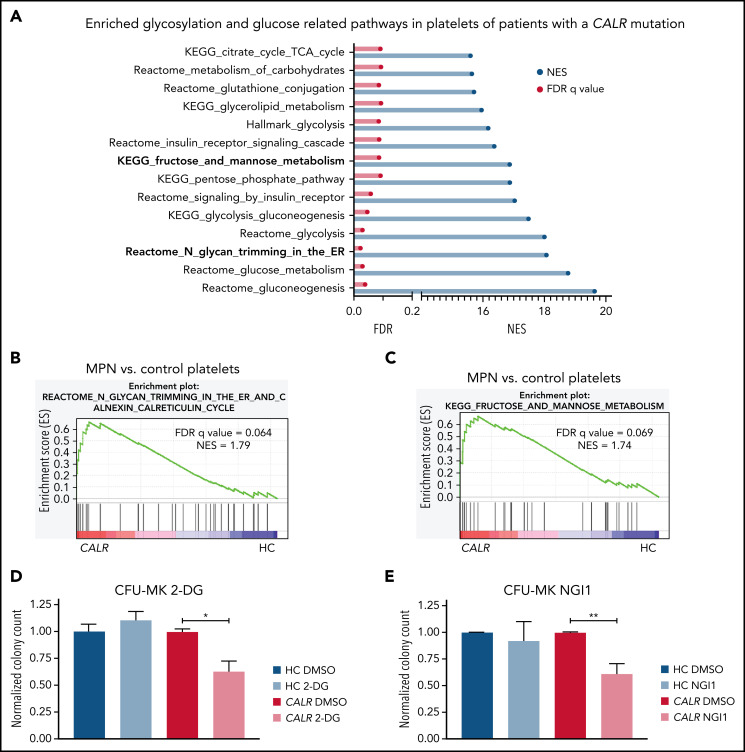
N-glycosylation–related pathways are enriched in platelets of CALR-mutant human MPN as compared with human healthy control platelets. (A) Significantly enriched glucose and glycosylation-related pathways in platelets of CALR-mutant essential thrombocythemia and myelofibrosis patients (n = 13 samples) vs healthy controls (n = 21 samples) as determined by GSEA on platelet RNA-seq data. (B) GSEA of the Reactome N-glycan trimming in the ER and calnexin calreticulin cycle pathway in platelets of CALR-mutant vs control platelets. (C) GSEA of the KEGG fructose and mannose metabolism pathway in platelets of CALR-mutant vs control platelets. (D-E) CFU-MK of HC BM and BM from patients with a CALR mutation. N = 3 in duplicate. Mean plus or minus standard error of the mean. Statistical analysis performed using Student t tests. *P < .05; **P < .01. (D) Normalized colony count of BM grown in the presence of either DMSO or 2-DG (20 µM). (E) Normalized colony count of BM grown in the presence of either DMSO or NGI1 (1 µM). Mean plus standard error of the mean. CFU-MK, megakaryocyte colony-forming unit; FDR, false discovery rate; NES, normalized enrichment score.

