

Summary
PD-1/PD-L1-blockade immunotherapies have limited efficacy in the treatment of bladder cancer. Here, we show that NKG2A associates with improved survival and responsiveness to PD-L1 blockade immunotherapy in bladder tumors that have high abundance of CD8+ T cells. In bladder tumors, NKG2A is acquired on CD8+ T cells later than PD-1 as well as other well-established immune checkpoints. NKG2A+ PD-1+ CD8+ T cells diverge from classically defined exhausted T cells through their ability to react to HLA class I-deficient tumors using TCR-independent innate-like mechanisms. HLA-ABC expression by bladder tumors is progressively diminished as disease progresses, framing the importance of targeting TCR-independent anti-tumor functions. Notably, NKG2A+ CD8+ T cells are inhibited when HLA-E is expressed by tumors and partly restored upon NKG2A blockade in an HLA-E-dependent manner. Overall, our study provides a framework for subsequent clinical trials combining NKG2A blockade with other T cell-targeted immunotherapies, where tumors express higher levels of HLA-E.
eTOC Blurb
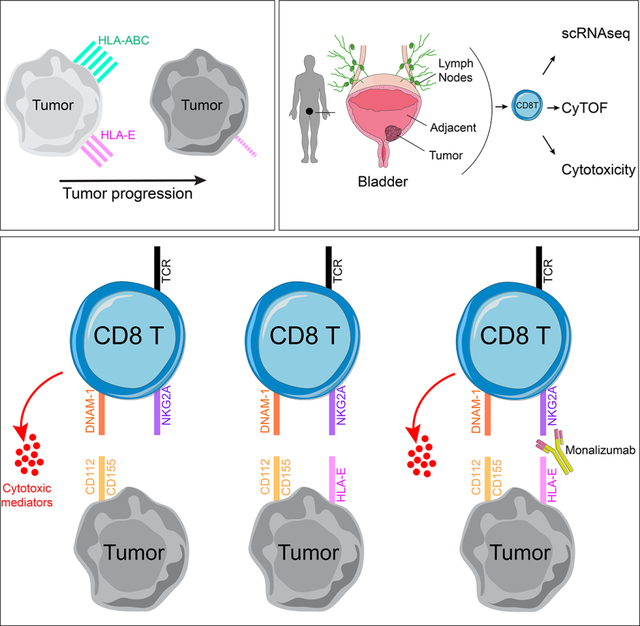
Salomé et al. characterize the role of the NKG2A/HLA-E immune checkpoint axis in bladder cancer. Tumor escape mechanisms include loss of HLA-ABC expression. NKG2A+ CD8+ T cells react to advanced HLA-ABC-deficient tumors through acquired TCR-independent cytotoxicity mechanisms. NKG2A blockade further enhances their innate-like functions in the presence of HLA-E.
Graphical Abstract
Introduction
Resistance mechanisms are commonly employed by tumors in response to pressures exerted by effector cells. Among such mechanisms, increased expression of inhibitory receptors on CD8+ T cells constrains their anti-tumor cytolytic potential (Thommen and Schumacher, 2018). Monoclonal antibodies that abrogate these inhibitory interactions have transformed the landscape for treatment of solid tumors (Bajorin et al., 2021; Chao et al., 2021; Finn et al., 2020; Motzer et al., 2020; Rittmeyer et al., 2017; Schmid et al., 2020; Topalian et al., 2019). Immunotherapies targeting PD-1/PD-L1 have proven effective in controlling tumor growth through reinvigoration of CD8+ T cells. PD-1-mediated inhibition not only targets TCR signaling but also CD28 (Boussiotis, 2016; Hui, 2017; Yokosuka et al., 2012), the latter being critical for effective anti-tumor CD8+ T cell responses following PD-1 blockade (Hashimoto, 2018; Kamphorst, 2017). Further, loss of HLA class I expression on tumors is a common evasion strategy framing an important need to understand CD28/TCR-independent mechanisms of anti-tumor functions.
Advanced urothelial cancer of the bladder is an aggressive malignancy with a median survival of approximately 13–16 months for patients with metastatic disease (Galsky et al., 2020). Several PD-1/PD-L1 inhibitors have been approved by the US Food and Drug Administration (FDA) for bladder cancer (BC) treatment since 2016, spanning non-muscle-invasive bladder cancer (NMIBC) to metastatic disease. While responses are often durable relative to other systemic cancer treatments, such responses are achieved in only 15–25% BC patients (Patel et al., 2020). The observed efficacy holds promise but suggests additional adaptive resistance mechanisms and provides strong rationale for targeting additional immune checkpoint axes in BC (Rosenberg et al., 2016). Several important intrinsic and extrinsic mechanisms of resistance to checkpoint blockade immunotherapies have been characterized (Fares, 2019) such as a tumor’s intrinsic ability to alter its recognition as ‘foreign’ by immune cells or rather extrinsic to the tumor microenvironment (TME), such as immunosuppressive cytokines and alterations to vasculature and extracellular matrix. High tumor mutation burden is more likely to generate neoantigens that can be recognized by adaptive cytotoxic T cells and correlates with improved treatment response across numerous tumor indications, including BC (Cristescu et al., 2018). Yet, our group recently demonstrated that an anti-tumor adaptive immune response may co-exist with a pro-tumorigenic inflammatory response, the balance between these two signatures strongly stratifying responders and non-responders in metastatic BC patients treated with anti-PD-1/PD-L1 blockade (Wang et al., 2021).
HLA-E is a non-classical MHC class I molecule that is ubiquitously expressed on hematopoietic cells at low abundance and binds to the heterodimeric complex CD94/NKG2A (Boyington et al., 1999; Carretero et al., 1997; van Hall et al., 2019). NKG2A uniquely mediates the inhibitory signal to NK and CD8 T cells through two intracellular tyrosine-based inhibition motifs encoded on the cytoplasmic tail of NKG2A (Aramburu, 1990; Brooks, 1997; Speiser, 1999). A humanized monoclonal antibody binding to the NKG2A receptor, monalizumab, has been developed, and numerous clinical trials are ongoing across multiple tumor indications (André et al., 2018; van Hall et al., 2019). In vitro blockade of NKG2A, alone, or in combination with targeting the PD-1 pathway stimulates NK cell functions but is collectively required to stimulate a strong CD8 T cell response to HLA-E+ PD-L1+ tumors. Combined administration of anti-NKG2A and anti-PD-L1 blocking antibodies unleashes NK and CD8 T cells and subsequently slows tumor progression in mouse models and interim analyses suggest in vivo efficacy of monalizumab when in combination with PD-L1 blockade (durvalumab) in stage III non-small cell lung cancer (Herbst, 2022).
In this study, we demonstrate that muscle-invasive bladder tumors have significantly reduced expression of MHC class I molecules, potentially limiting CD8 T cell responses to the tumor. We describe how a subset of NKG2A-expressing CD8 T cells can overcome this evasion strategy through TCR-independent functions that allow them to release critical soluble inflammatory mediators in response to MHC class I-deficient tumors, partly due to their increased expression of activating receptors, such as the DNAX Accessory Molecule (DNAM)-1/CD226 as well as due to loss of CD28 and reduced sensitivity to PD-1-mediated signaling. We further demonstrate that the NKG2A+ CD8 T cell ‘missing-self’ response is inhibited by HLA-E but restored by NKG2A blockade. HLA-E expression is strongly downregulated but variable on bladder tumors and highly significantly correlates with NKG2A blockade efficiency, providing a strong rationale for the use of NKG2A blockade for treatment of HLA-E+ bladder tumors. This study will additionally provide insights into engineering CD8 T cells for adoptive cell therapies.
Results
NKG2A expression associates with better survival in muscle-invasive bladder cancer
Based on the increased interest into NKG2A function in NK and CD8 T cells and the emerging data in clinical trials of NKG2A blockade in other tumor types, we evaluated the effect of KLRC1 (NKG2A) gene expression on the survival of cancer patients from The Cancer Genome Atlas (TCGA) BLCA (Bladder cancer), KIRC (Kidney clear cell carcinoma), SKCM (melanoma), LUAD (lung adenocarcinoma), LUSC (lung squamous cell carcinoma) and OV (ovarian cancer) cohorts. These cohorts are characterized by different treatments, tumor biology and stages. Higher KLRC1 expression significantly associated with better overall survival in bladder cancer (BC) (Figure 1A), while no association were found in the other cohorts (data not shown). The TCGA BLCA database represents tumor specimens from 406 patients (n=371 MIBC, n=5 NMIBC, n=30 unknown pathology). KLRC1 effect on survival was restricted to patients with high CD8A or PDCD1 (PD-1) expression in the tumor (Figure 1B–C). The cohort size was insufficient for stratifying patients based on NCR1 (NKp46) to better distinguish NK from T cells (n=11 NCR1low KLRC1high tumors, data not shown). We thus further characterized NKG2A+ T cell and NK cell infiltration within bladder tumors. Immunofluorescence was performed on bladder tumors for CD3, NKp46 and NKG2A. Transcriptomic data were obtained on the matched slides by multiplexed in situ hybridization of mRNA (HTG Molecular™). We confirmed that high expression of KLRC1 transcripts in bladder tumors reflects stronger infiltration of NKG2A+ T cells, that were distinct from NKG2A+ NK cells, as defined by NKp46 expression (Figure 1D, S1A–C). Overall, these results suggest a beneficial role for NKG2A on CD8 T cells in BC.
Figure 1. Improved overall survival in NKG2A+ (KLRC1high) CD8 T cell-infiltrated bladder tumors.
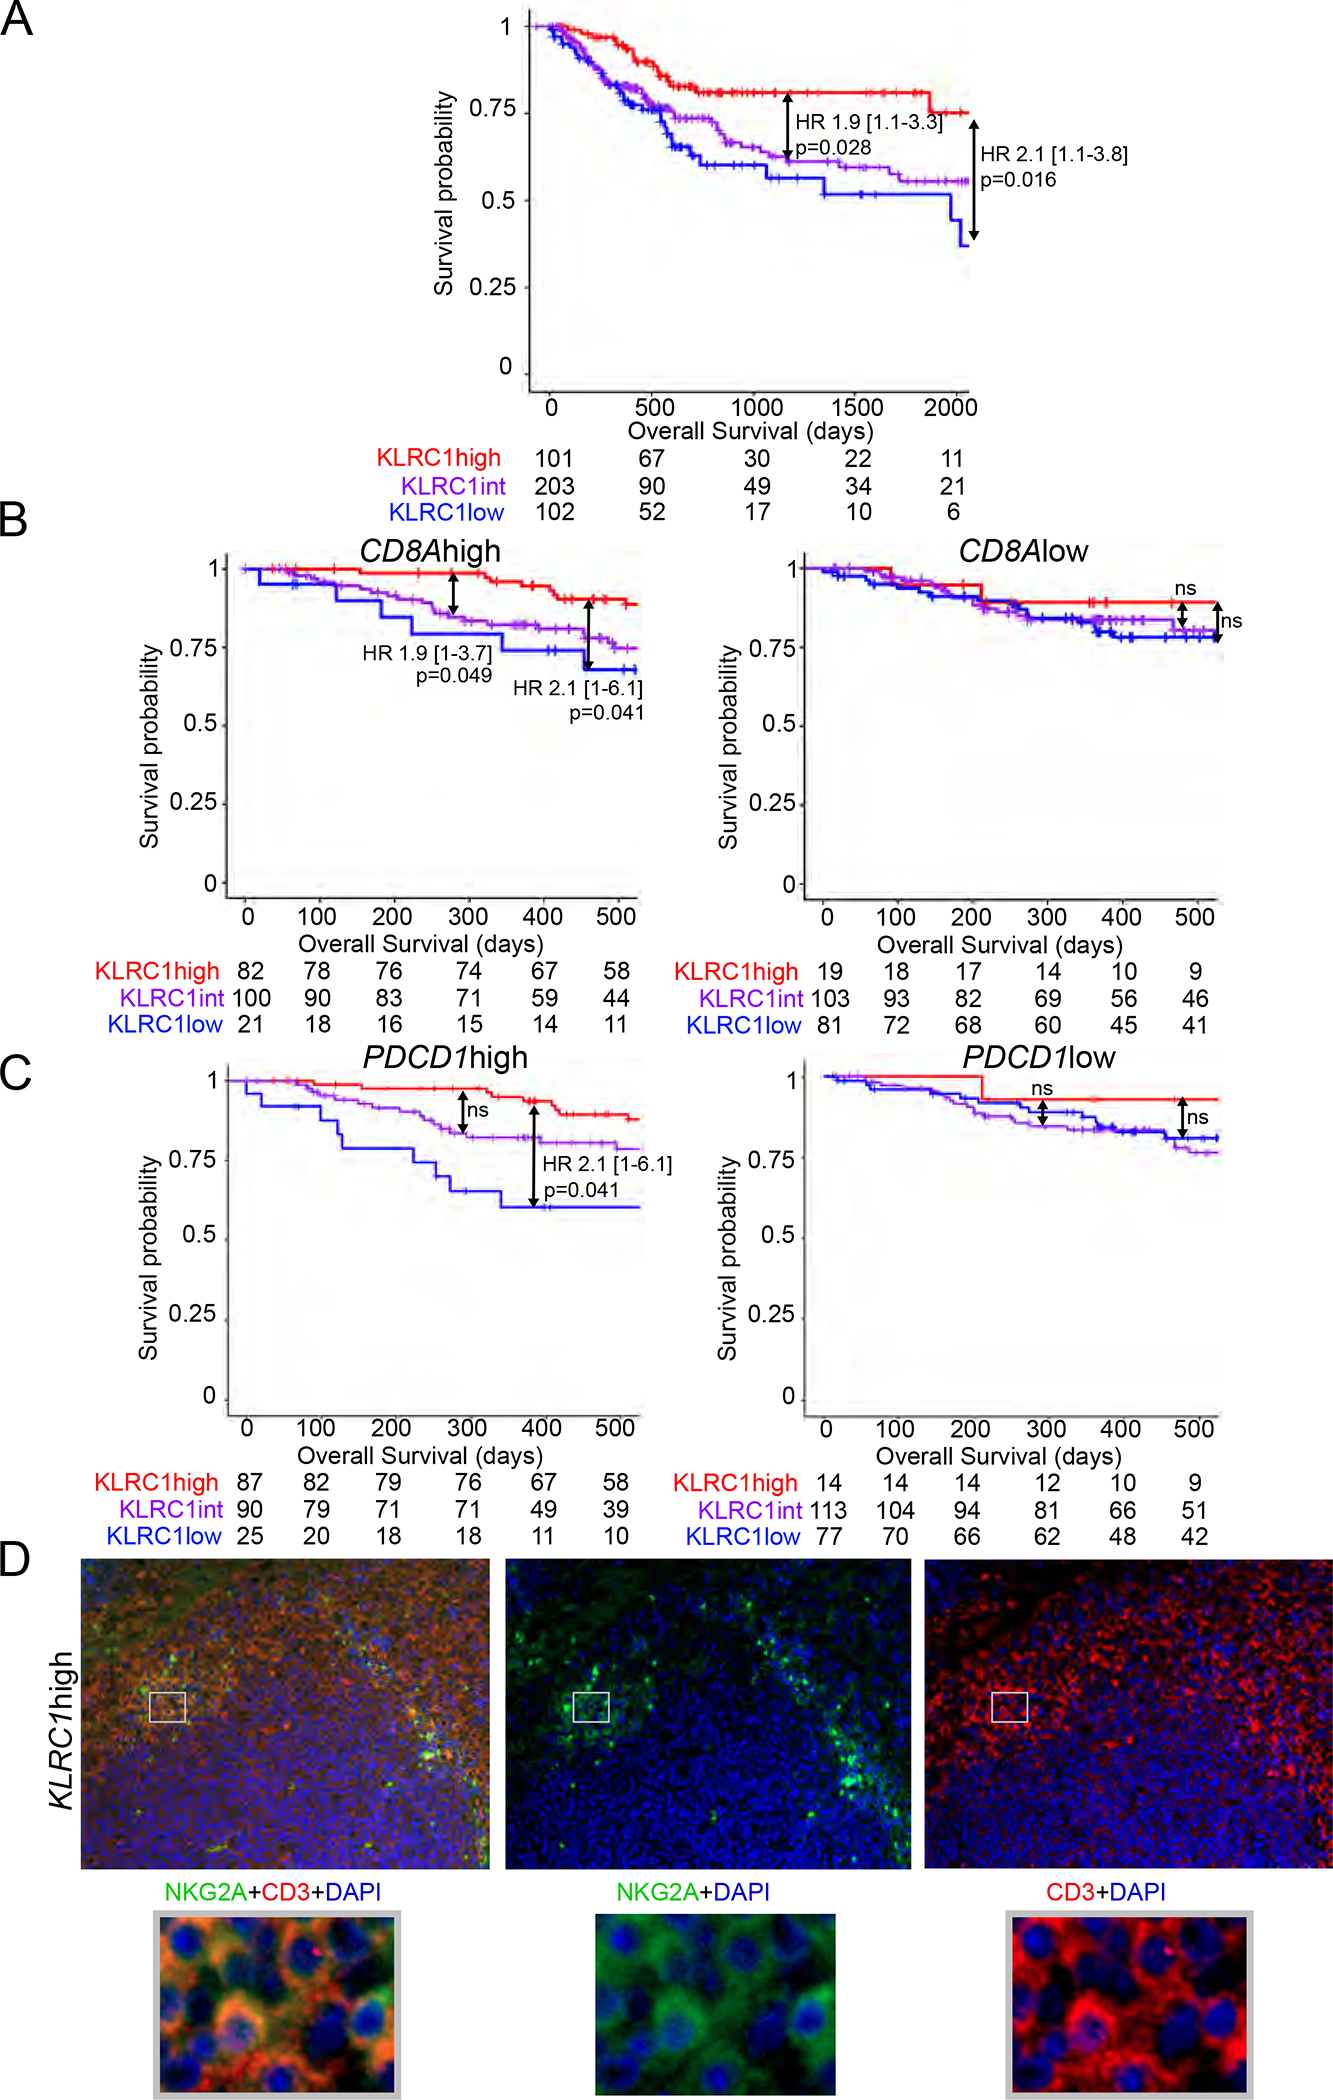
Kaplan-meier survival curves of the TCGA BLCA cohort showing associations between KLRC1 (NKG2A) expression and overall survival in (A) all patients, or patients with (B) CD8Ahigh/low (CD8) or (C) PDCD1high/low (PD-1) gene expression.
Hazard ratios and p-values were calculated using COX proportional hazards regression models that were corrected for age and number of somatic mutations.
(D) Representative immunofluorescence staining of CD3/NKG2A in KLRC1high bladder tumors.
See also Figure S1.
Bladder tumors reduce expression of HLA class I but retain expression of ligands for DNAM-1 and TIGIT
To better understand the TME, we performed single-cell RNA sequencing on 8 fresh bladder tumors (3 NMIBC, 5 MIBC) (Table S1). Using UMAP clustering analyses, we distinguished clusters of tumor cells, fibroblasts and major immune populations (Figure 2A, Table S2). To gain insights into antigen presentation capacity of bladder tumors to CD8 T cells, we compared the expression of genes encoding HLA class I and beta-2 microglobulin (B2M) between the tumors and the immune cell clusters. We found that expression levels of HLA-A, HLA-B, HLA-C, HLA-E, B2M were significantly reduced on tumor cells compared to immune lineages in all the patients (Figure 2B). We confirmed by flow cytometry a significant reduction in cell-surface expression of HLA-ABC and HLA-E on the CD45− tumor cells compared to matched tumor-derived CD45+ immune cells (n=25) (Figure 2C). HLA-ABC expression on tumor cells was lower in MIBC compared to NMIBC, with a similar non statistically significant trend observed for HLA-E (Figure 2D). Accordingly, a Halo™ digital imaging analysis of multi-chromagen immunohistochemistry staining revealed significantly lower staining intensity for HLA-ABC and HLA-E on tumor cells in MIBC compared to NMIBC (Figure 2E, S2A). Analysis of single-cell RNA sequencing data confirmed a downregulation of HLA-A, -B, -C, -E genes by tumor cells (defined by genes for keratins and EMT-claudins, Table S2) in MIBC versus NMIBC (HLA-A p=3E-76, -B p=2E-141, -C p=8E-76, -E p=7E-47). HLA-E downregulation by bladder tumors was associated with increased expression of genes associated with proliferation and cytotoxicity by CD8 T cells (Figure S2B, Table S2).
Figure 2. Bladder tumors have reduced expression of HLA class I but retain expression of ligands for DNAM-1.
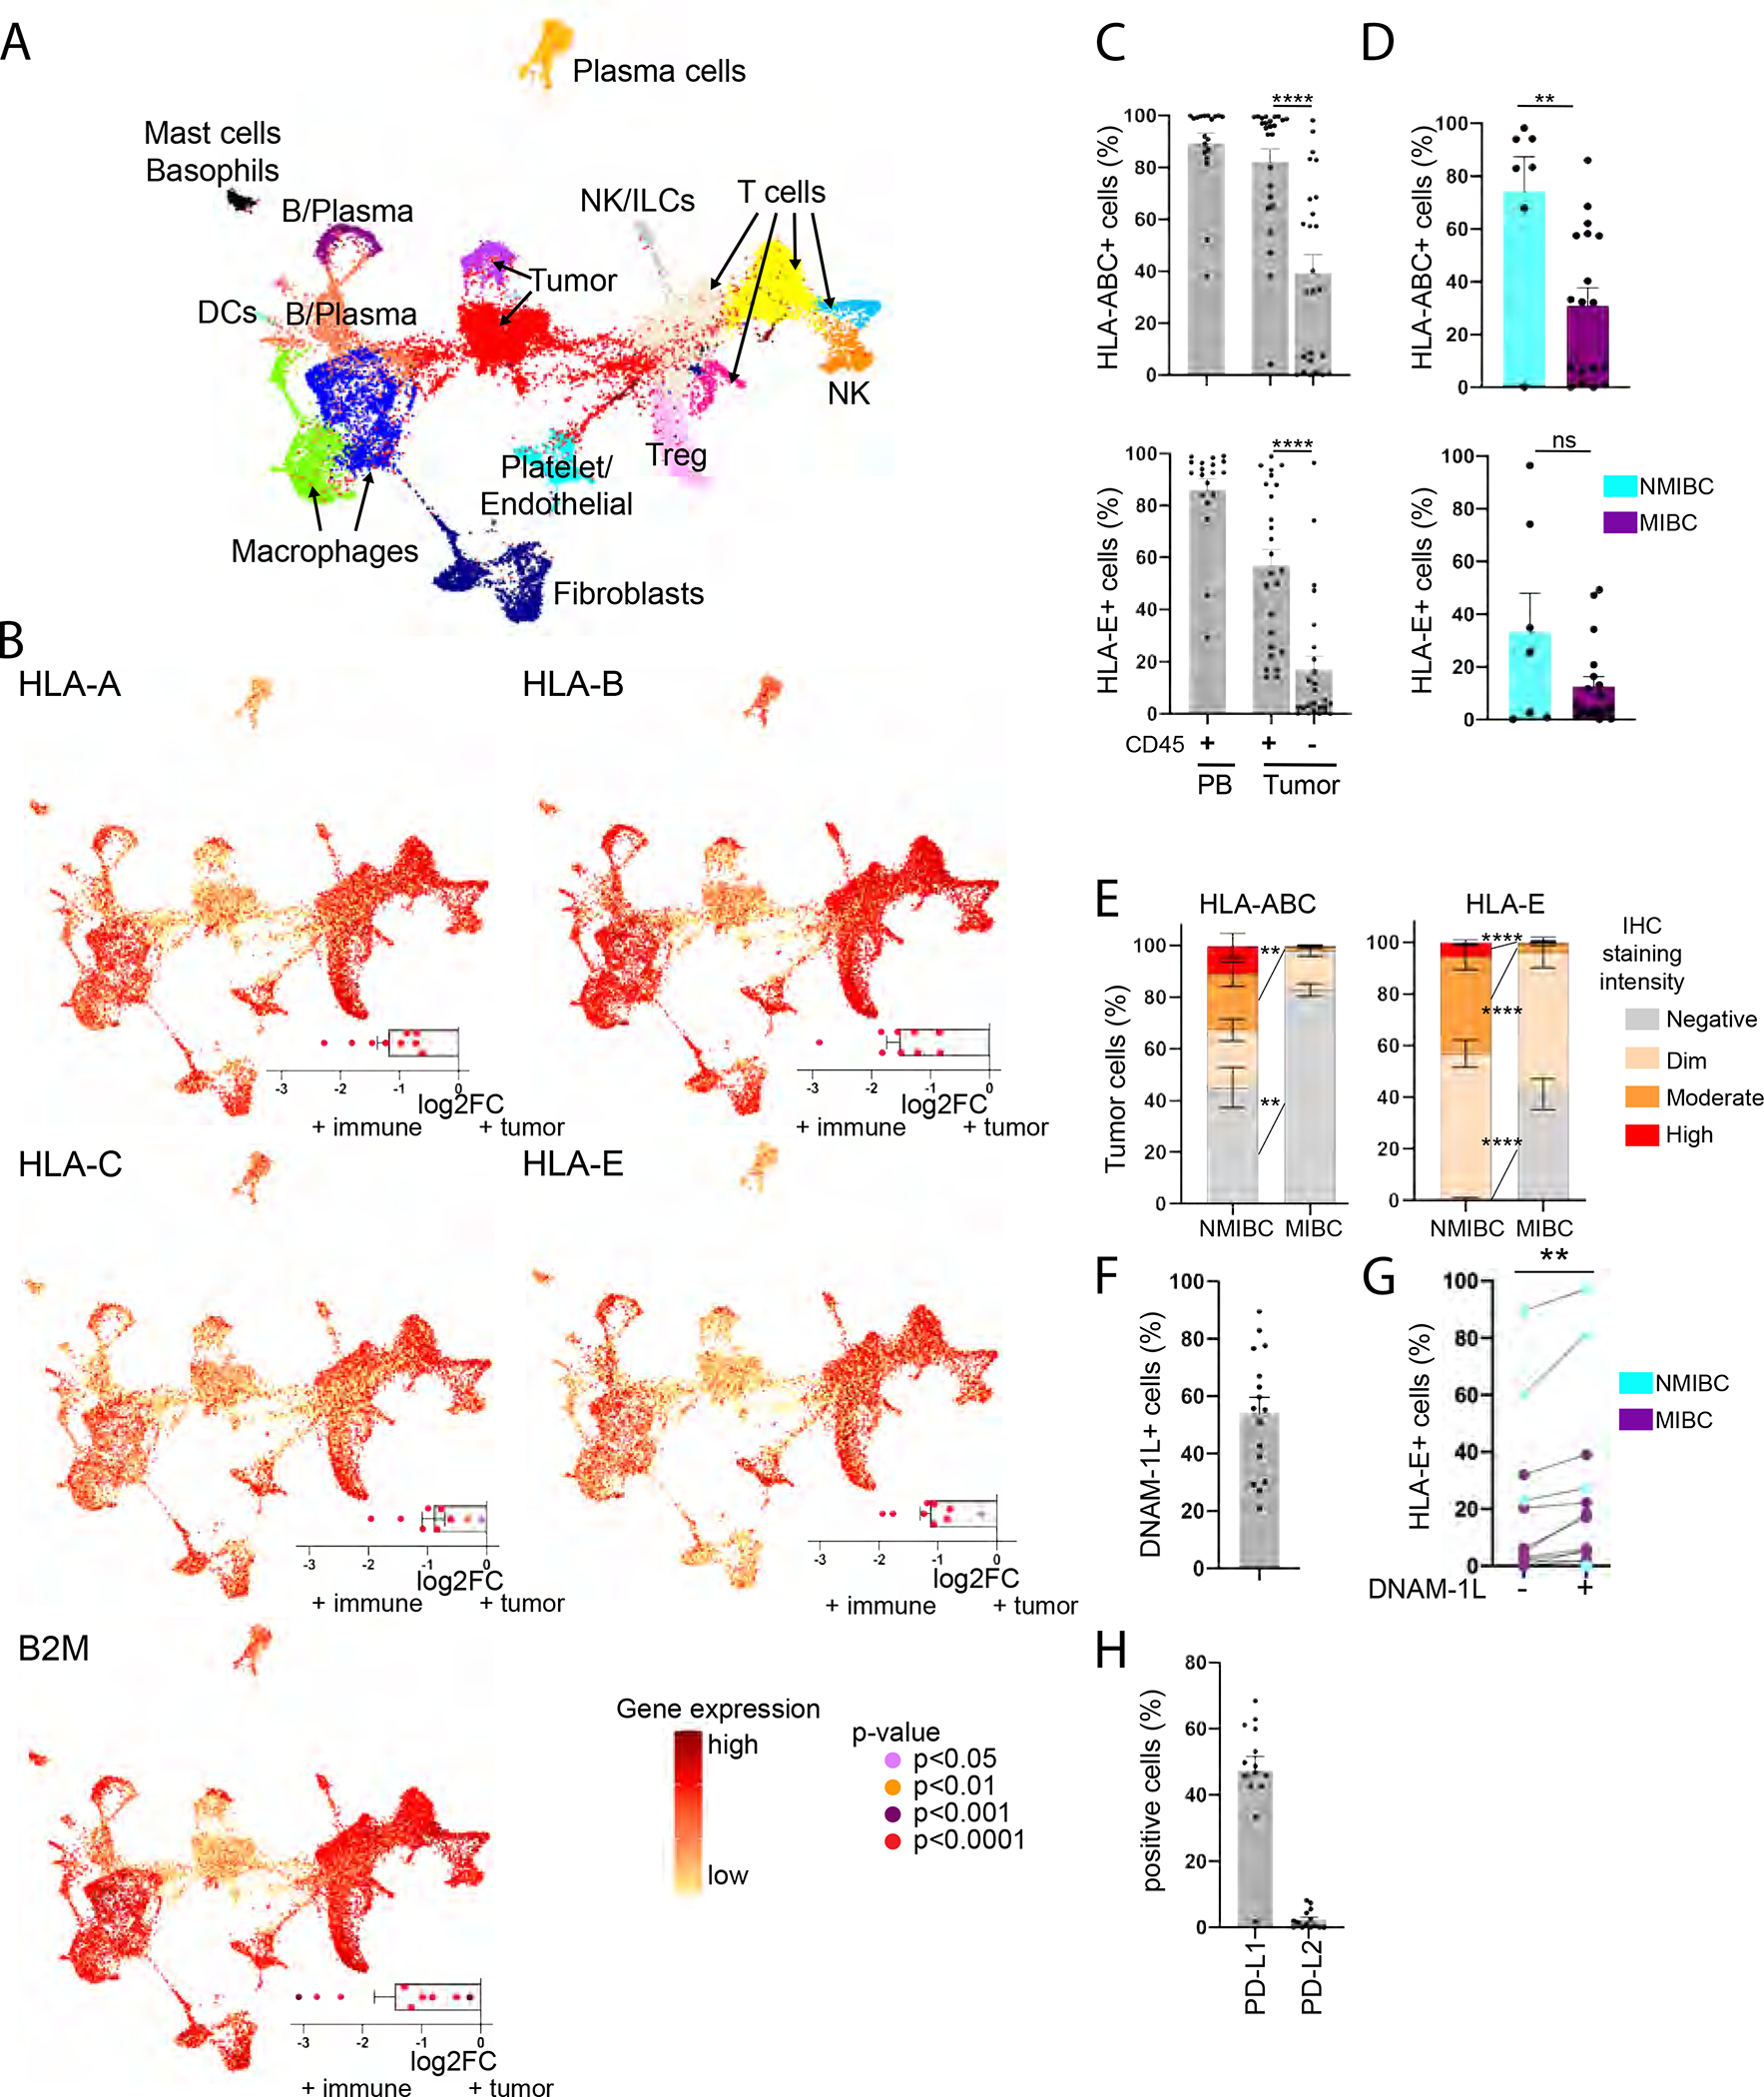
(A-B) Single-cell RNA sequencing data was generated from bladder tumors (n=8).
(A) UMAP clustering analysis. Each color represents a cluster.
(B) Central graph: gene expression level on the UMAP clusters; Bottom right graph: differential gene expression between tumor and immune cells.
(C-D, F-H) Flow cytometry was performed on PBMCs and tumor-dissociated cells of BC patients.
(C) Frequency of cells expressing HLA-ABC or HLA-E among CD45+ PBMCs (n=19) and CD45+/− cells from the tumor site (n=25).
(D) Frequency of CD45− tumor cells expressing HLA-ABC or HLA-E in NMIBC (n=7) and MIBC (n=18).
(E) Frequency of tumor cells staining negative or at varying signal intensities for HLA-ABC and -E in NMIBC/MIBC by immunohistochemistry.
(F) Frequency of CD45− tumor cells expressing at least one DNAM-1-L (CD112/CD155) (n=16).
(G) Frequency of CD112/CD155+/− CD45− tumor cells expressing HLA-E (n=13).
(H) Frequency of CD45− tumor cells expressing PD-L1 or PD-L2 (n=14).
Paired t-tests were used in (C), (G) and unpaired t-test in (D)-(E). ** p<0.01, **** p<0.0001. (C)-(F), (H): Error bars represent the SEM (standard error of the mean). See also Figure S2, Table S1.
Loss of HLA class I on tumors (loss of heterozygosity (LOH)) is a common phenotype that promotes a mechanism of tumor evasion from CD8 T cells (Garrido et al., 2016). LOH can be driven by somatic mutations (Grasso et al., 2018) or by post-transcriptional or epigenetic changes (Ritter et al., 2017). We performed an allele-specific copy number FACETS analysis (Shen and Seshan, 2016) of the TCGA BLCA cohort and observed 21.8% of patients had lost one or more HLA class I alleles. Further, we genotyped HLA class I alleles in patient-matched germline and tumor tissues from our cohort of BC patients and did not observe LOH in any of the tumor or urine specimens compared to germline tissue (Table S3) suggesting that somatic mutations are not the dominant driver for the observed loss in expression of HLA class I on bladder tumors.
We next characterized bladder tumor cell lines (grade 1–3) by flow cytometry for expression of activating and inhibitory ligands conventionally ascribed to modulating NK and T cell functions. We found NKp44- and NKp46-ligands (L) to be absent from all 11 cell lines and NKp30-L to be expressed only at low levels on the RT-4 tumor line (Figure S2C). Conversely, all tumor lines expressed at least one NKG2D-L (ULBPs, MICA/B) and had high expression of DNAM-1-L (CD112/CD155). We also noted expression of DNAM-1-L on primary bladder tumors, with CD112/CD155+ bladder tumors co-expressing higher levels of HLA-E (Figure 2F–G). Finally, whereas PD-L1/L2 were expressed on the bladder tumor lines, we only observed PD-L1 on primary tumors (Figure 2H). Collectively, these results suggest that antigen presentation pathways to CD8 T cells are impaired in bladder tumors, while other pathways associated with NK cell “missing-self” reactivity are present.
NKG2A-expressing CD8 T cells are differentiated and possess TCR-independent anti-tumor functions
To better understand the phenotype of CD8 T cells that may be engaged independent of MHC class I, we sought to evaluate ex vivo phenotypes and functions of NKG2A+ CD8 T cells in healthy donor (HD) PBMCs (n=20) using mass cytometry (Table S4, panels 1–3). We excluded invariant NKT and γδT cells from our analysis, based on Vα24/Jα28TCR and γδTCR, respectively. We distinguished naïve cells as CD45RA+ CCR7+, effector memory (EM) cells as CD45RA− CCR7−, central memory (CM) cells as CD45RA− CCR7+, and EMRA cells as CD45RA+ CCR7−. NKG2A was restricted to the memory CD8 T cell compartment, with highest expression at the EM and CM stages (Figure 3A). NKG2A expression did not depend on gender, age or prior infection with cytomegalovirus (Figure S3A–B). While HLA-E expression on PBMCs varies considerably in HDs and influences NKG2A+ NK cell frequencies and function (Horowitz et al., 2016; Ramsuran et al., 2018), NKG2A expression on CD8 T cells did not depend on HLA-E expression (Figure S3C). We then compared ex vivo phenotypes of NKG2A+/− CD8 T cells at each memory stage. NKG2A+ CD8 T cells displayed higher levels of DNAM-1 and the canonical NK-lineage marker CD56 (Figure 3B). DNAM-1 and NKG2D were the most highly expressed activating NK receptors on NKG2A+ CD8T cells, though only DNAM-1 expression differed between NKG2A+ and NKG2A− CD8 T cells (Figure 3B, S3D). TIGIT and PD-1 were expressed at lower levels on NKG2A+ CD8 T cells at the EM and CM stages. At the EMRA and CM stages, NKG2A+ CD8 T cells also expressed the highest levels of the transcription factor (TF) T-bet. However, unique to the EMRA stage, NKG2A+ CD8 T cells possessed a significantly higher cytolytic payload.
Figure 3. NKG2A-expressing CD8 T cells are differentiated and possess TCR-independent Innate-like functions in healthy individuals.
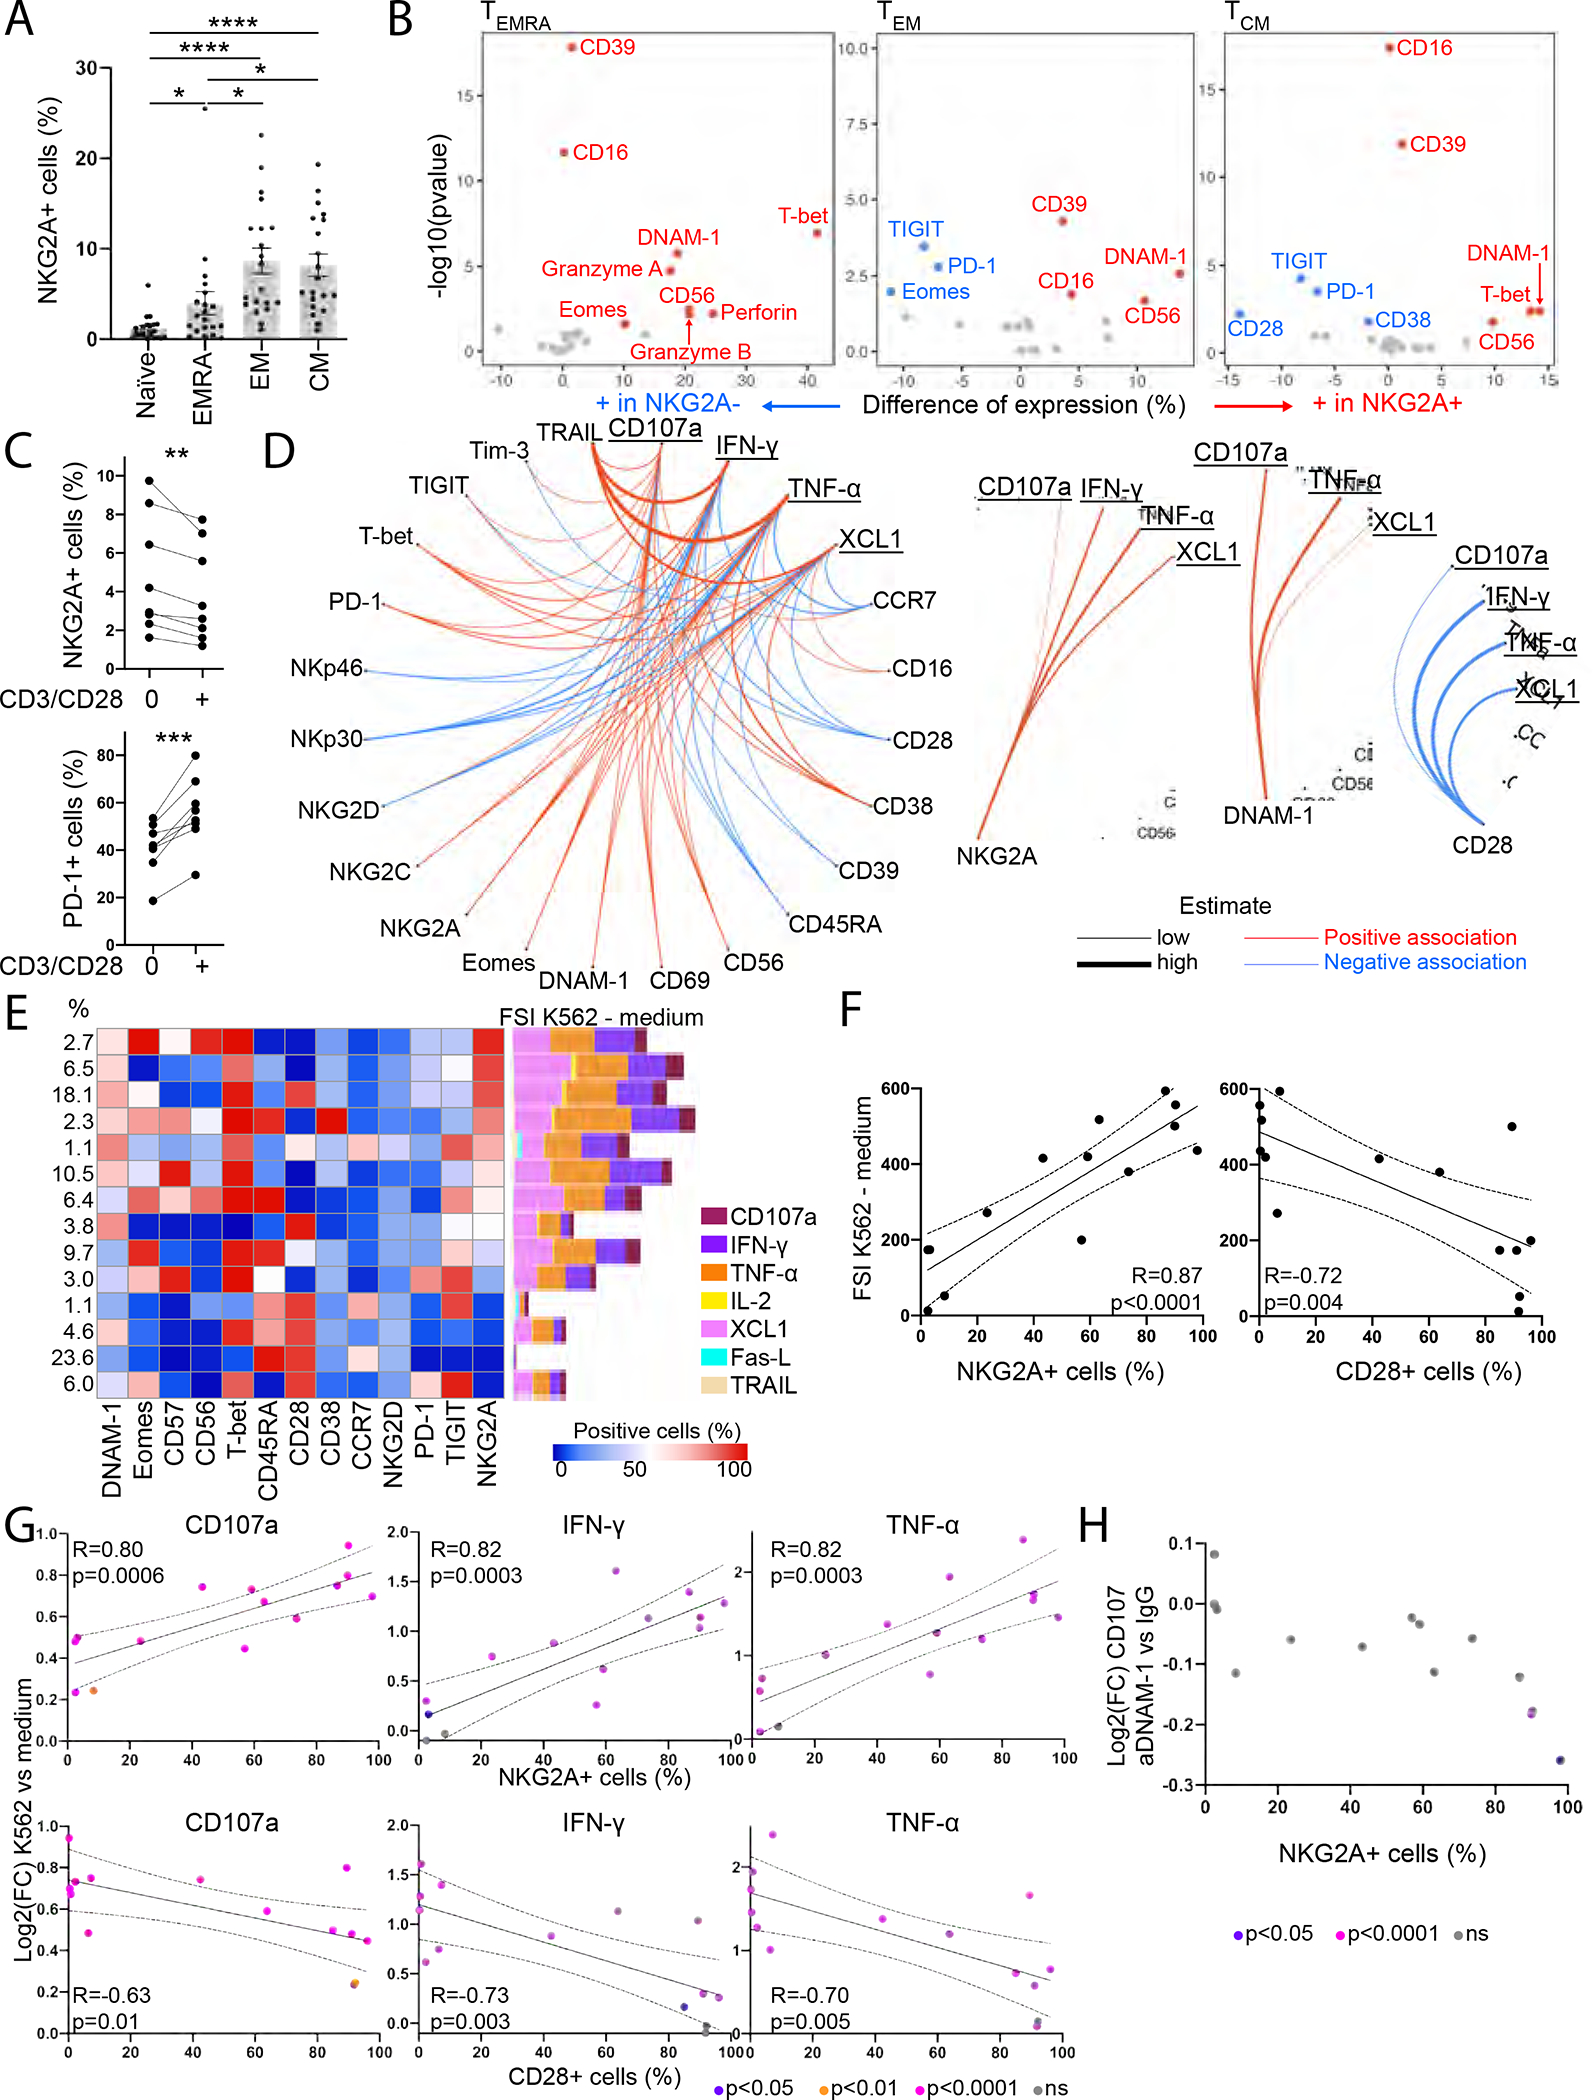
(A-B) Mass cytometry was performed ex vivo on HD PBMCs (n=20).
(A) NKG2A expression on CD8T cells.
(B) Differentially expressed markers between NKG2A+ and NKG2A− CD8 T cells.
(C) NKG2A and PD-1 expression on CD45RA− CD8 T cells after 24h culture of CD8 T cells from HD PBMCs with low-dose IL-2/IL-7/IL-15, with or without CD3/CD28 beads.
(D) CD8 T cells from HD PBMCs were recovered overnight with low-dose IL-12/IL-15/IL-18 prior to a 5h co-culture with K562 (n=20). Associations between expression of phenotypic and functional markers following co-culture with K562 tumors that are statistically significant.
(E-H) CD8 T cells from HD PBMCs were recovered overnight with low-dose IL-12/IL-15/IL-18 prior to a 5h co-culture with K562 in the presence or absence of anti-DNAM-1 blocking antibody (n=10).
(E) FlowSOM cluster analysis of CD8 T cells. Each row represents a cluster, each column a marker. Left: Distribution of CD8 T cells among clusters. Right: FSI upon K562 stimulation minus the FSI upon 5h culture in R10 medium.
(F) Correlation between NKG2A+ or CD28+ CD8 T cell frequency within each cluster and FSI upon K562 stimulation minus FSI in the absence of K562.
(G) Correlation between NKG2A+ or CD28+ CD8 T cell frequency within each cluster and differential expression of CD107a, IFN-γ, and TNF-α upon K562 stimulation.
(H) Differential expression of CD107a upon addition of anti-DNAM-1 blocking antibody, compared to isotype control.
Paired t-tests were used in (A)-(C), linear models in (D), Pearson correlations in (F)-(G) and unpaired t-tests in (G)-(H). (F)-(H): Each dot represents a cluster. All statistical tests were adjusted for multiple comparison. (A): Error bars represent the SEM. * p<0.05, **p<0.01, ***p<0.001, **** p<0.0001. See also Figure S3, Table S4.
Strikingly, expression of CD28 was downregulated on CM CD8 T cells when NKG2A was expressed (Figure 3B, S3E). We further observed decreased NKG2A and increased PD-1 expression on CD8 T cells when culturing PBMCs in the presence of low dose cytokines and CD3/CD28 stimulation, suggesting mutual exclusiveness of the CD28 and NKG2A pathways (Figure 3C). We next assessed CD8 T cell response to HLA class I-deficient K562 tumor cells. CD8 T cells were isolated from HD PBMCs (n=20), cultured overnight in low-dose cytokines prior to 5h co-culture with K562. CD8 T cells degranulated and produced TNF-α, IFN-γ, XCL1 and IL-2 in response to K562 (Figure S3F). Degranulation was observed at all differentiation stages, but efficient release of cytotoxic mediators was only observed at the EMRA stage (Figure S3F–G). Using linear models, we characterized associations between CD8 T cell phenotypes and reactivity to K562 (Figure 3D). Responses to K562 were restricted by CD28 and enhanced by DNAM-1/NKG2A. Association between NKG2A expression and TCR-independent innate-like functions by CD8 T cells was tightly regulated by HLA-E, being restricted in functional capacity in HDs with endogenously higher cell-surface expression of HLA-E (Figure S3H). The data thus suggest that HD baseline levels of HLA-E might reduce NKG2A+ CD8 T cell missing-self reactivity.
We then characterized the CD8 T cell repertoire in HD PBMCs (n=10), following co-cultures with K562 tumors (Figure 3E). We identified 14 relevant clusters, including 3 NKG2Ahigh (>95% NKG2A+ cells) and 4 NKG2Alow clusters (<2% NKG2A+ cells). The majority of NKG2A+ CD8 T cell clusters expressed the highest levels of DNAM-1. We then assessed CD8 T cell response to K562 tumors per cluster by calculating a functional stimulation index (FSI), which considers frequency and signal intensity of each functional marker. Increased FSI upon K562 co-culture reflects a polyfunctional response to HLA-ABC-deficient tumors. CD8 T cell polyfunctionality positively correlated with NKG2A expression and negatively correlated with CD28 expression within each cluster (Figure 3F), revealing NKG2A and CD28 effects on CD8 T cell degranulation and production of TNF-α and IFN-γ (Figure 3G, S3I).
CD8 T cells were treated with blocking antibodies for the NK-activating receptors NKp30, NKp46, NKG2D or DNAM-1 before co-culture with K562 tumors. Abrogating interactions of NKp30, NKp46 or NKG2D with their activating ligands had no effect on CD8 T cell function (data not shown), while blocking DNAM-1 strongly impaired CD8 T cell TCR-independent degranulation (Figure 3H, S3J). The effects of DNAM-1-blockade were confined to the three clusters with the highest frequency of NKG2A+ CD8 T cells. A linear mixed model (NKG2A*anti-DNAM-1 effect: p=0.010) confirmed the effects of DNAM-1-blockade on CD8 T cell degranulation to be contingent upon expression of NKG2A. Collectively, the data indicate that NKG2A marks a program of TCR-independent, DNAM-1-mediated “missing-self” degranulation by CD8 T cells in HD PBMCs.
NKG2A defines a subset of PD-1+ TRM CD8 T cells that retain TCR-independent anti-tumor functions in bladder tumors.
We analyzed CD8 T cell phenotypes in matched samples of bladder draining lymph nodes (BDLN) (n=5), bladder tumors (n=7) and adjacent, non-involved bladder tissue (n=6) by mass cytometry (Figure 4A; Table S4, panel 4). We observed strong downregulation of CD28 concomitant to increased expression of TRM markers (CD49a, CD103), checkpoint inhibitors (PD-1, CD39) and exhaustion-related TFs (TOX, T-bet) on CD8 T cells upon entry in the tumor (Figure 4B, S4A). Clustering analyses revealed CXCR5+ NKG2A− stem-like CD8 T cells were enriched in BDLN (Figure 4C), in line with recent findings (Im et al., 2016), while tumor-infiltration only had a moderate impact on CD8 T cell phenotype in BDLN (Figure S4B). CD39+ CD103+ CD49a+ CD8 T cells were recently described as tumor-reactive (Duhen et al., 2018) and were enriched in bladder tumors compared to adjacent non-involved tissue, with 18% of these cells co-expressing NKG2A.
Figure 4. NKG2A defines a subset of PD-1+ TRM CD8+ T cells that retain TCR-independent functions in bladder tumors.
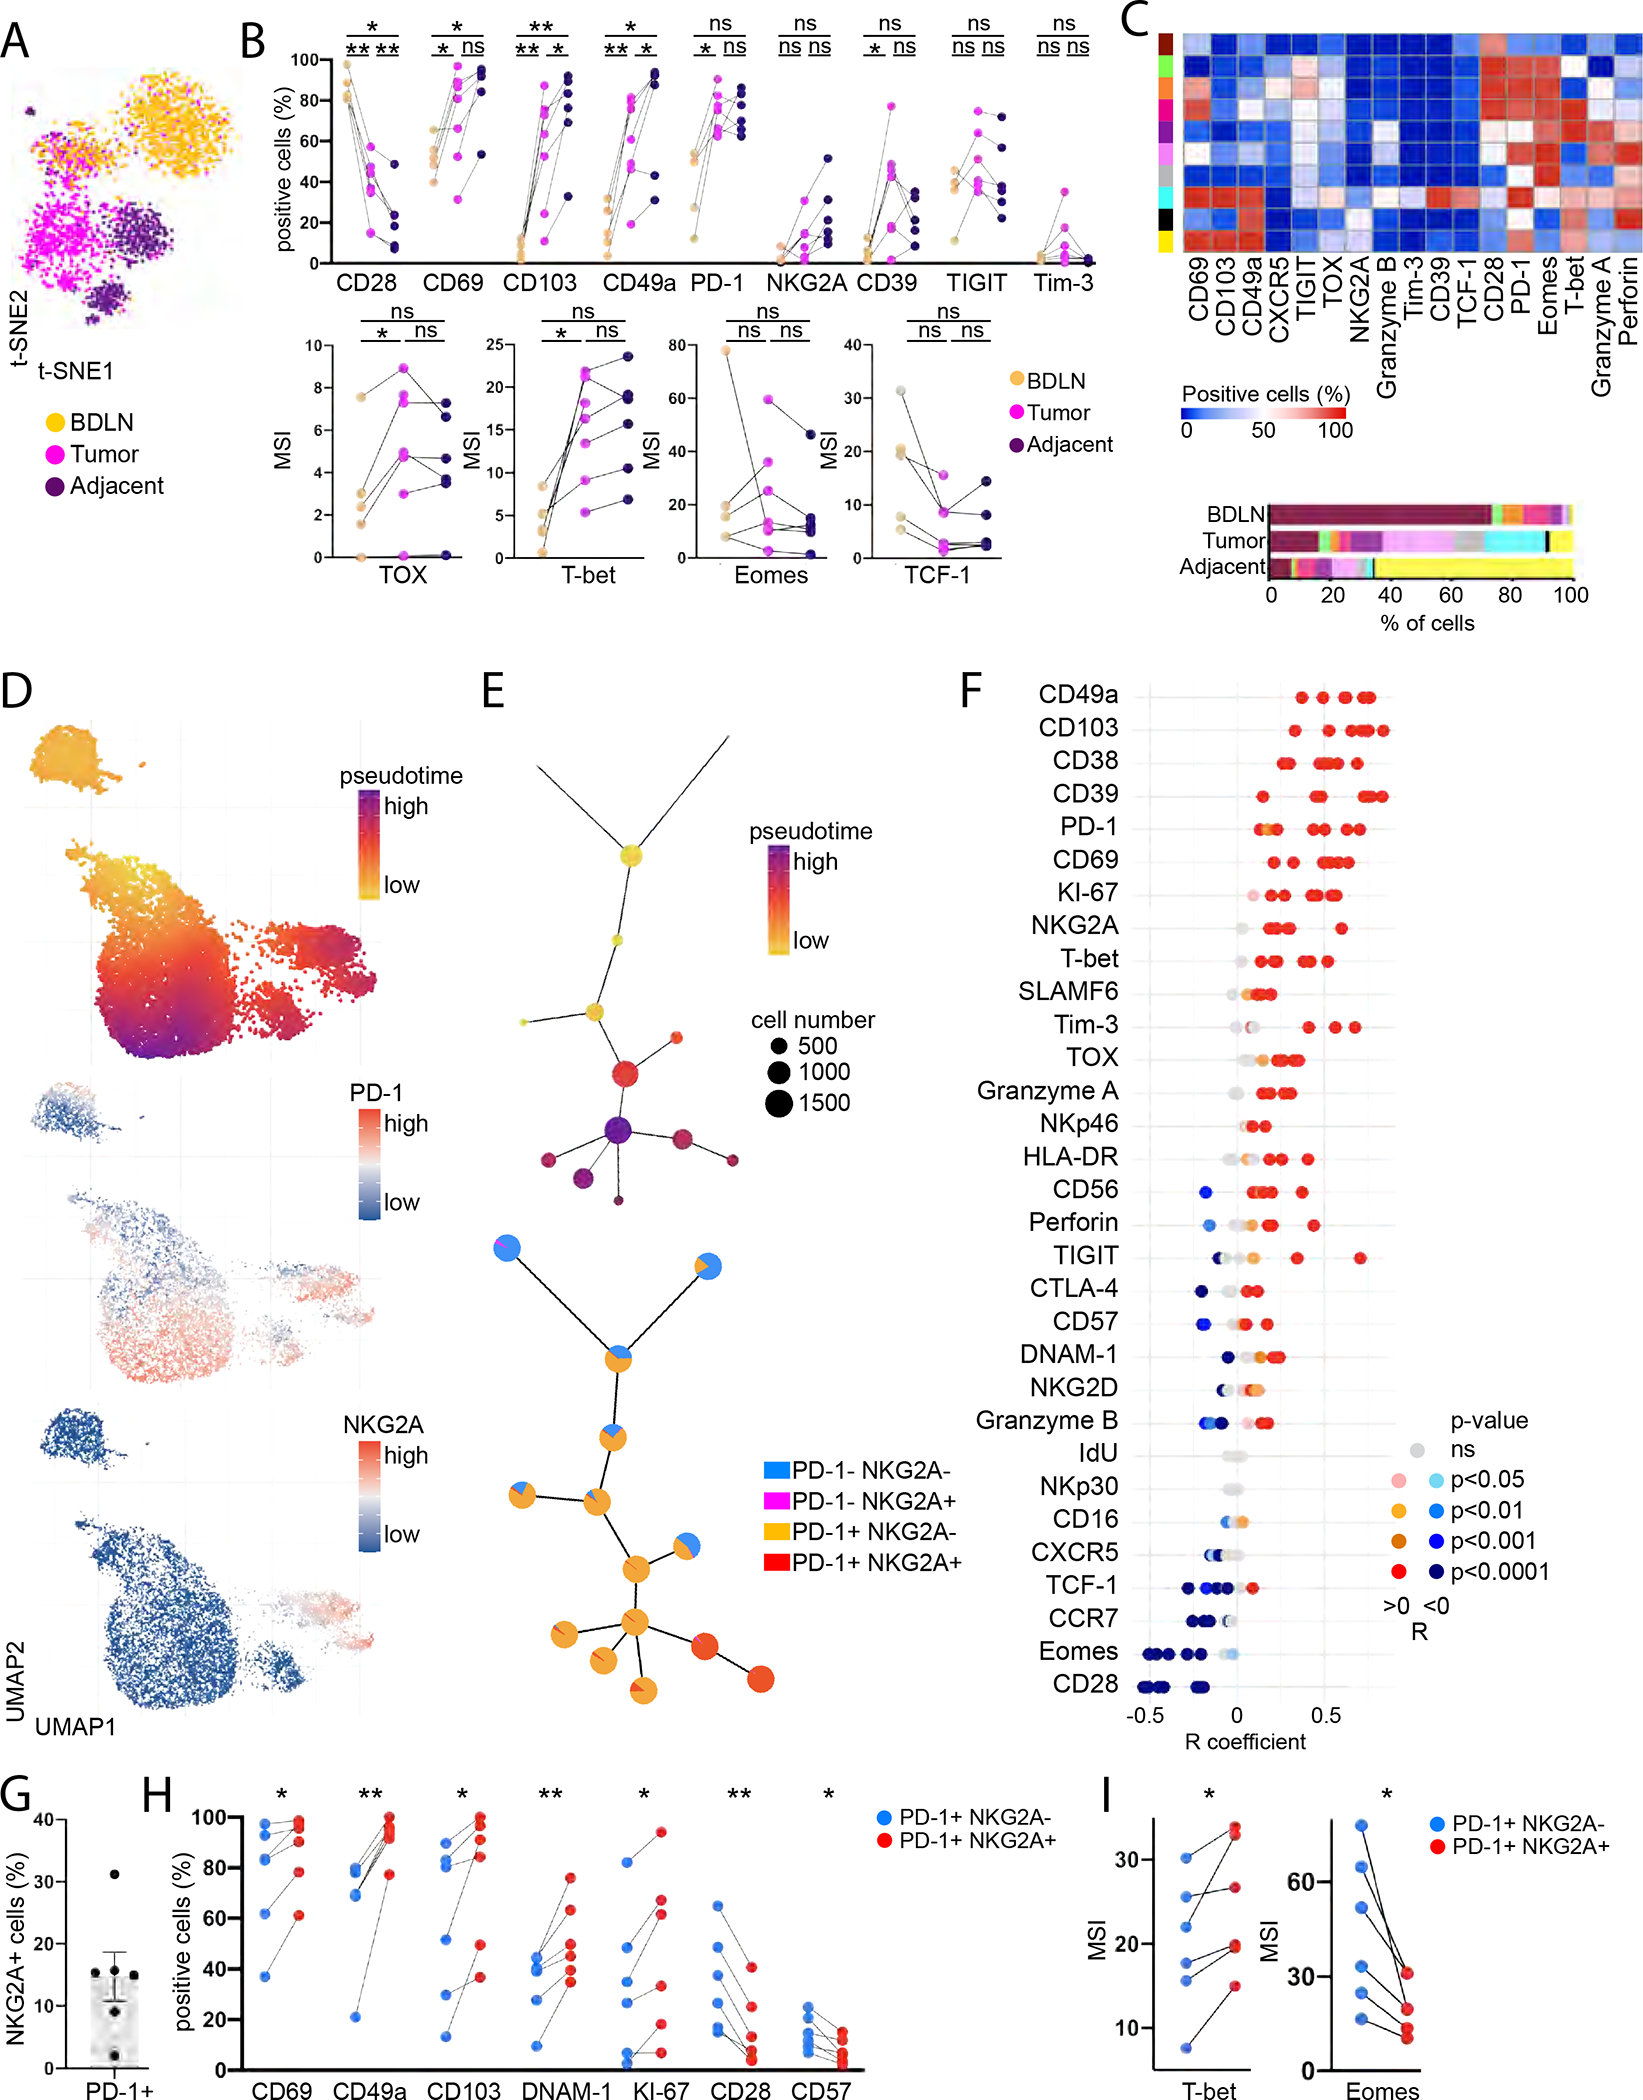
(A-I) Mass cytometry was performed ex vivo on BDLN (n=5), tumor (n=7) and adjacent non-involved tissue (n=6) from BC patients.
(A) Representative CD8 T cell t-SNE clustering analysis (n=1).
(B) CD8 T cell phenotype.
(C) FlowSOM cluster analysis of CD8 T cells. Each row represents a cluster, each column a marker. Bottom: Cluster distribution in each tissue type.
(D) Representative UMAP analysis of CD8 T cells from bladder tumor (n=1).
(E) Representative expression of PD1/NKG2A per UMAP cluster alongside pseudotime (n=1).
(F) Correlation of marker expression with pseudotime.
(G) NKG2A expression on PD-1+ CD8 T cells (n=6).
(H) NKG2A−/+ PD-1+ CD8 T cell phenotype in the tumors (n=6).
(I) Median Signal Intensity (MSI) of TFs in NKG2A−/+ PD-1+ CD8 T cells in the tumors (n=6).
Paired t-tests were used in (B), (H)-(I) and Spearman correlations in (F). p-values were adjusted for multiple comparison. “ns” p>0.05, * p<0.05, ** p<0.01. (B), (H)-(I): Lines show donor-matching samples. (H)-(I) show only the significant comparisons. (G): Error bars represent the SEM. See also Figure S4, Tables S1, S4.
We then performed pseudotime analysis of bladder tumors (n=7) to evaluate the phenotypic diversity of tumor-infiltrating CD8 T cells. Pseudotime analysis predicts phenotypic relatedness and assigns a trajectory for visualization (Dai et al., 2021). CD8 T cells acquired PD-1 in a progressive manner within the pseudotime trajectory, while NKG2A acquisition defined a branch point derived from a subset of PD-1+ CD8 T cells (Figures 4D–E), suggesting that PD-1 is acquired before NKG2A during chronic activation, in line with recent findings (Borst et al., 2022). Expression of immune checkpoints (PD-1, NKG2A, CD39, Tim-3), TRM markers (CD49a, CD103, CD69), TFs (TOX, T-bet) and the proliferation marker KI-67 positively correlated with progression through pseudotime (Figures 4F and S4C). Conversely, CD28 and Eomes expression negatively correlated with pseudotime.
NKG2A was expressed on 15% [2–31%] of PD-1+ CD8 T cells in bladder tumors (Figure 4G). NKG2A expression on PD-1+ CD8 T cells was strongly correlated with enhanced proliferation and TRM features (Figure 4H, S4D). NKG2A+ PD-1+ CD8 T cells displayed higher expression of DNAM-1 and lower expression of CD28, in line with our observations in HDs, alongside increased T-bet and decreased Eomes expression (Figure 4H–I). Collectively, the data suggest that NKG2A marks an alternative path of differentiation by CD8 T cells in bladder tumors defined by a progressive loss of TCR co-stimulation, recent proliferation and tissue-residency.
NKG2A expression is evenly distributed across the CD8 T cell clonal repertoire
That NKG2A-expressing PD-1+ CD8 T cells exhibit enhanced proliferation, we evaluated the clonality of KLRC1low/high CD8 T cells using publicly available matched TCR-sequencing and single-cell RNA sequencing data on bladder tumors (n=7) and non-involved adjacent tissue (n=2) (Oh et al., 2020). No significant differences were observed in clonalities between KLRC1low and KLRC1high CD8 T cells, with similar frequencies of cells expressing distinct TCRs (Figures S5A–C). We then compared the TCRs expressed by at least two cells within each group. We centered this analysis on tumors for which at least two TCRs are expressed in at least two KLRC1high cells. 74% (67–83%) of the TCRs found in at least two KLRC1high cells were also found in at least two KLRC1low cells, showing very similar clonal expansion independent of KLRC1 expression (Figure S5D). The data indicate that NKG2A expression on CD8 T cells does not associate with a skewed clonal repertoire.
CD94 and NKG2A are acquired on CD8 T cells after PD-1 and along with innate-like features of differentiation and TRM phenotypes in bladder tumors
We next used velocity analyses to infer dynamic transcriptomic changes in CD8 T cells from single-cell RNA sequencing data. This method relies on distinction between newly transcribed RNA (unspliced) and mature RNA (spliced) (Bergen et al., 2020; La Manno et al., 2018). RNA velocity marks the time at which a gene is being transcribed, while latent time faithfully models temporal sequences of transcriptomic events. In our analysis, we used latent time to reconstruct CD8 T cells’ molecular clock as they differentiate within bladder tumors (Figure 5A–B). We then correlated RNA velocity of each gene with latent time, a positive correlation revealing the induction of gene transcription during CD8 T cell differentiation. We filtered on coding non-mitochondrial genes that positively correlated with latent time (p<0.05, R>0.09), and ordered them based on latent time at which RNA velocity peaked (Figure 5C). Five main stages of differentiation could be derived from this analysis, stages 0 and 4 marking the earliest and latest latent time and differentiation stages, respectively. Three stages were of particular interest to map NKG2A acquisition during CD8 T cell differentiation.
Figure 5. CD94 and NKG2A are acquired on CD8 T cells after PD-1 and along with innate-like features of differentiation and TRM phenotypes in bladder tumors.
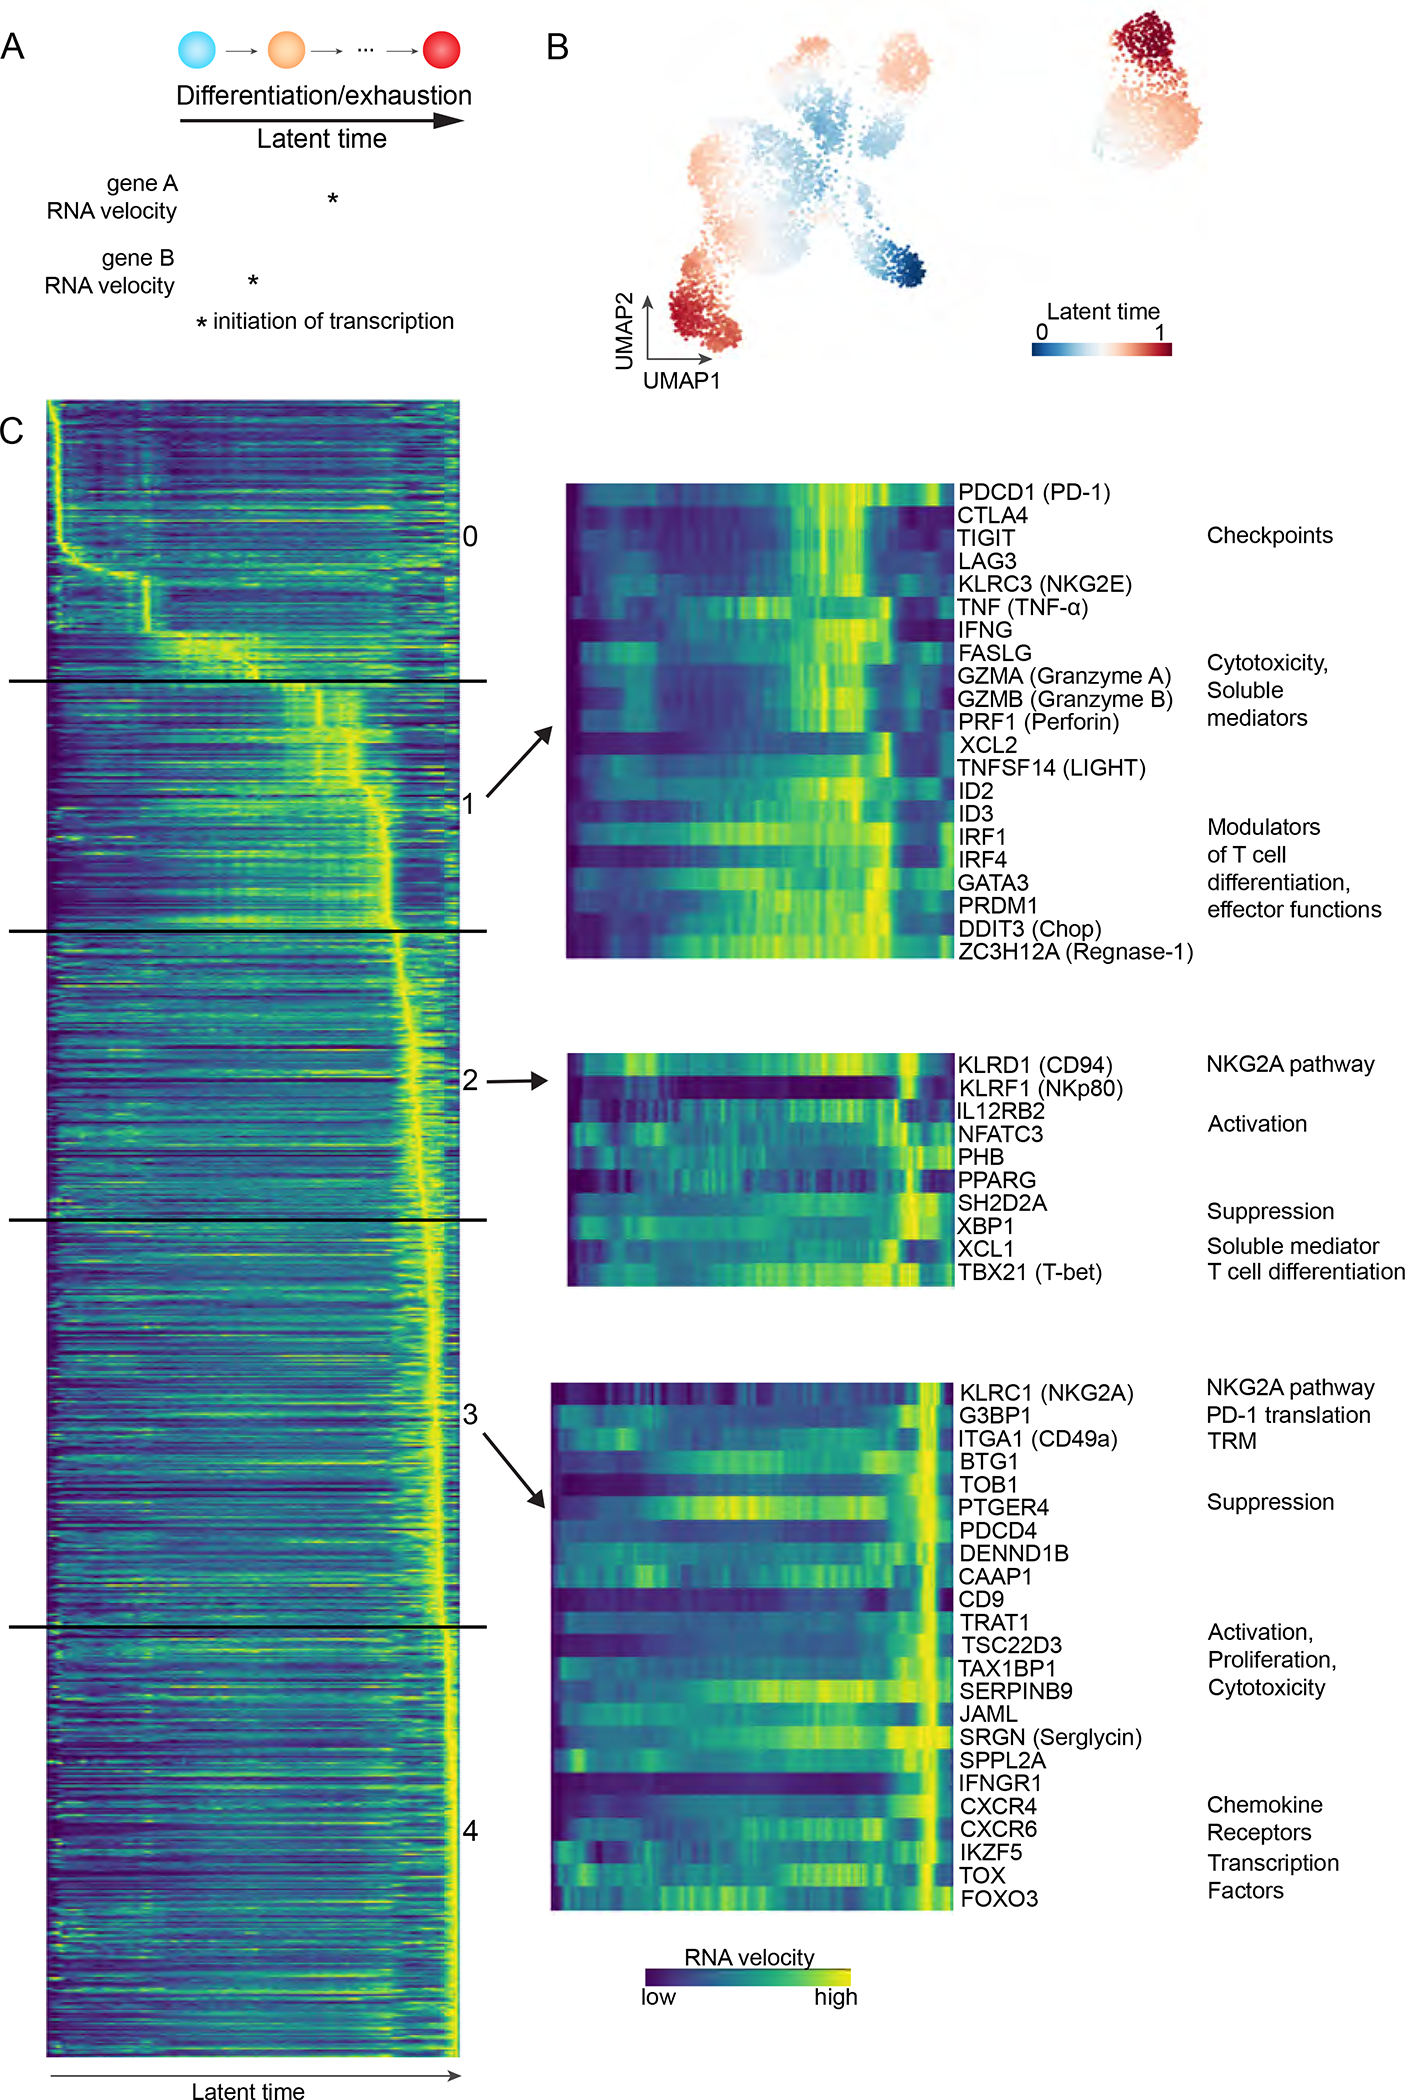
(A) Velocity analyses map transcriptional dynamics alongside cell differentiation, as represented by latent time.
(B) UMAP clustering analysis of scRNAseq data from bladder tumor-derived CD8 T cells.
(C) RNA velocity of selected genes as a function of latent time, i.e CD8 T cell differentiation. Each row represents one gene, each column a latent time. Left: all coding non-mitochondrial genes that significantly correlate with latent time (p<0.05, R>0.09). Right: key genes of interest. See also Tables S1, S5.
Stage 1 was characterized by initiation of transcription of immune checkpoints, PDCD1 (PD-1), CTLA4, TIGIT and LAG3. HAVCR2 (Tim-3) transcription was also initiated at this stage but was filtered out in our analysis (R<0.09). We found a concomitant increase in transcription of genes associated with cytotoxicity, CD8 T cell differentiation, and repression of T-bet expression (DDIT3). Eleven genes at this stage were previously associated with CD8 T cell dysfunction (Table S5) (Li et al., 2019).
Stage 2 initiated transcription of KLRD1 (CD94), TBX21 (T-bet), and KLRF1 (NKp80), a canonical activating receptor that marks functionally mature NK cells (Freud et al., 2016; Nalin et al., 2020). We also observed induction of genes associated with suppression (XBP1, SH2D2A) or promotion (e.g., IL12RB2, NFATC3, PHB, PPARG, TBX21, XCL1) of CD8 T cell effector functions.
Stage 3 initiated transcription of KLRC1 (NKG2A), TRM marker ITGA1 (CD49a), TFs (IKZF5, FOXO3, TOX) and G3BP1, which enhances PD-1 translation (Franchini et al., 2019). Additionally, we found PDCD1 (PD-1) RNA velocity to be increased in a second temporal sequence, at this stage, following its prior increase at stage 1. Genes associated with suppression or promotion of T cell survival and/or effector functions were also newly transcribed at this stage. Among them, SRGN increases the storage of cytotoxic mediators in CD8 T cells (Sutton et al., 2016), while PTGER4 encodes for a prostaglandin E2 receptor, which is associated with loss of CD28 on CD8 T cells (Chou et al., 2014). Transcription of another receptor for prostaglandin E2, PTGER2, was upregulated in the following stage 4.
Our analysis supports our observations that NKG2A is acquired at a distinct differentiation state that diverges from pathways associated with conventional immune checkpoints upon CD8 T cell differentiation, as part of a program that promotes CD28 loss and establishing TRM. Additionally, the data might suggest key roles for T-bet and CD94 in this transition and an overall adaptation by NKG2A-expressing CD8 T cells in prioritizing innate-like functions as tumors progressively lose HLA class I on their cell-surface.
NKG2A acquisition on CD8 T cells marks a highly proliferative TRM subset with enhanced response to HLA class I-deficient tumors.
We next evaluated the effect of NKG2A/PD-1 acquisition on CD8 T cell phenotype and TCR-independent function in bladder tumors. TGF-β1 correlates with bladder tumor aggressiveness (Kim, 2001) and is known to induce PD-1 and NKG2A on CD3/CD28-activated CD8 T cells from HD PBMCs (Bertone, 2006; Gunturi et al., 2005; Park et al., 2016). In order to recapitulate PD-1 and NKG2A acquisition that occurs upon entry in the bladder tumors, we isolated CD8 T cells from BDLN, that are predominantly PD-1− NKG2A−, and expanded them with CD3/CD28 tetramers and low-dose cytokines. We then isolated NKG2A− PD-1− CD69− CD103− CD49a+/− CD8 T cells and expanded them for another three days with or without TGF-β1 (Figure 6A). TGF-β1 induced the acquisition of NKG2A and PD-1 (Figures 6B, S6A–B). We further co-cultured expanded CD8 T cells with HLA-deficient K562 tumors, resulting in degranulation and production of IFN-γ, TNF-α, XCL1 and IL-2 with no observed differences between CD49a+ and CD49a− FACS-sorted cells (Figure 6C, S6C).
Figure 6. TCR-independent function is acquired by CD8 T cells upon NKG2A upregulation and is enhanced with NKG2A blockade in bladder cancer.
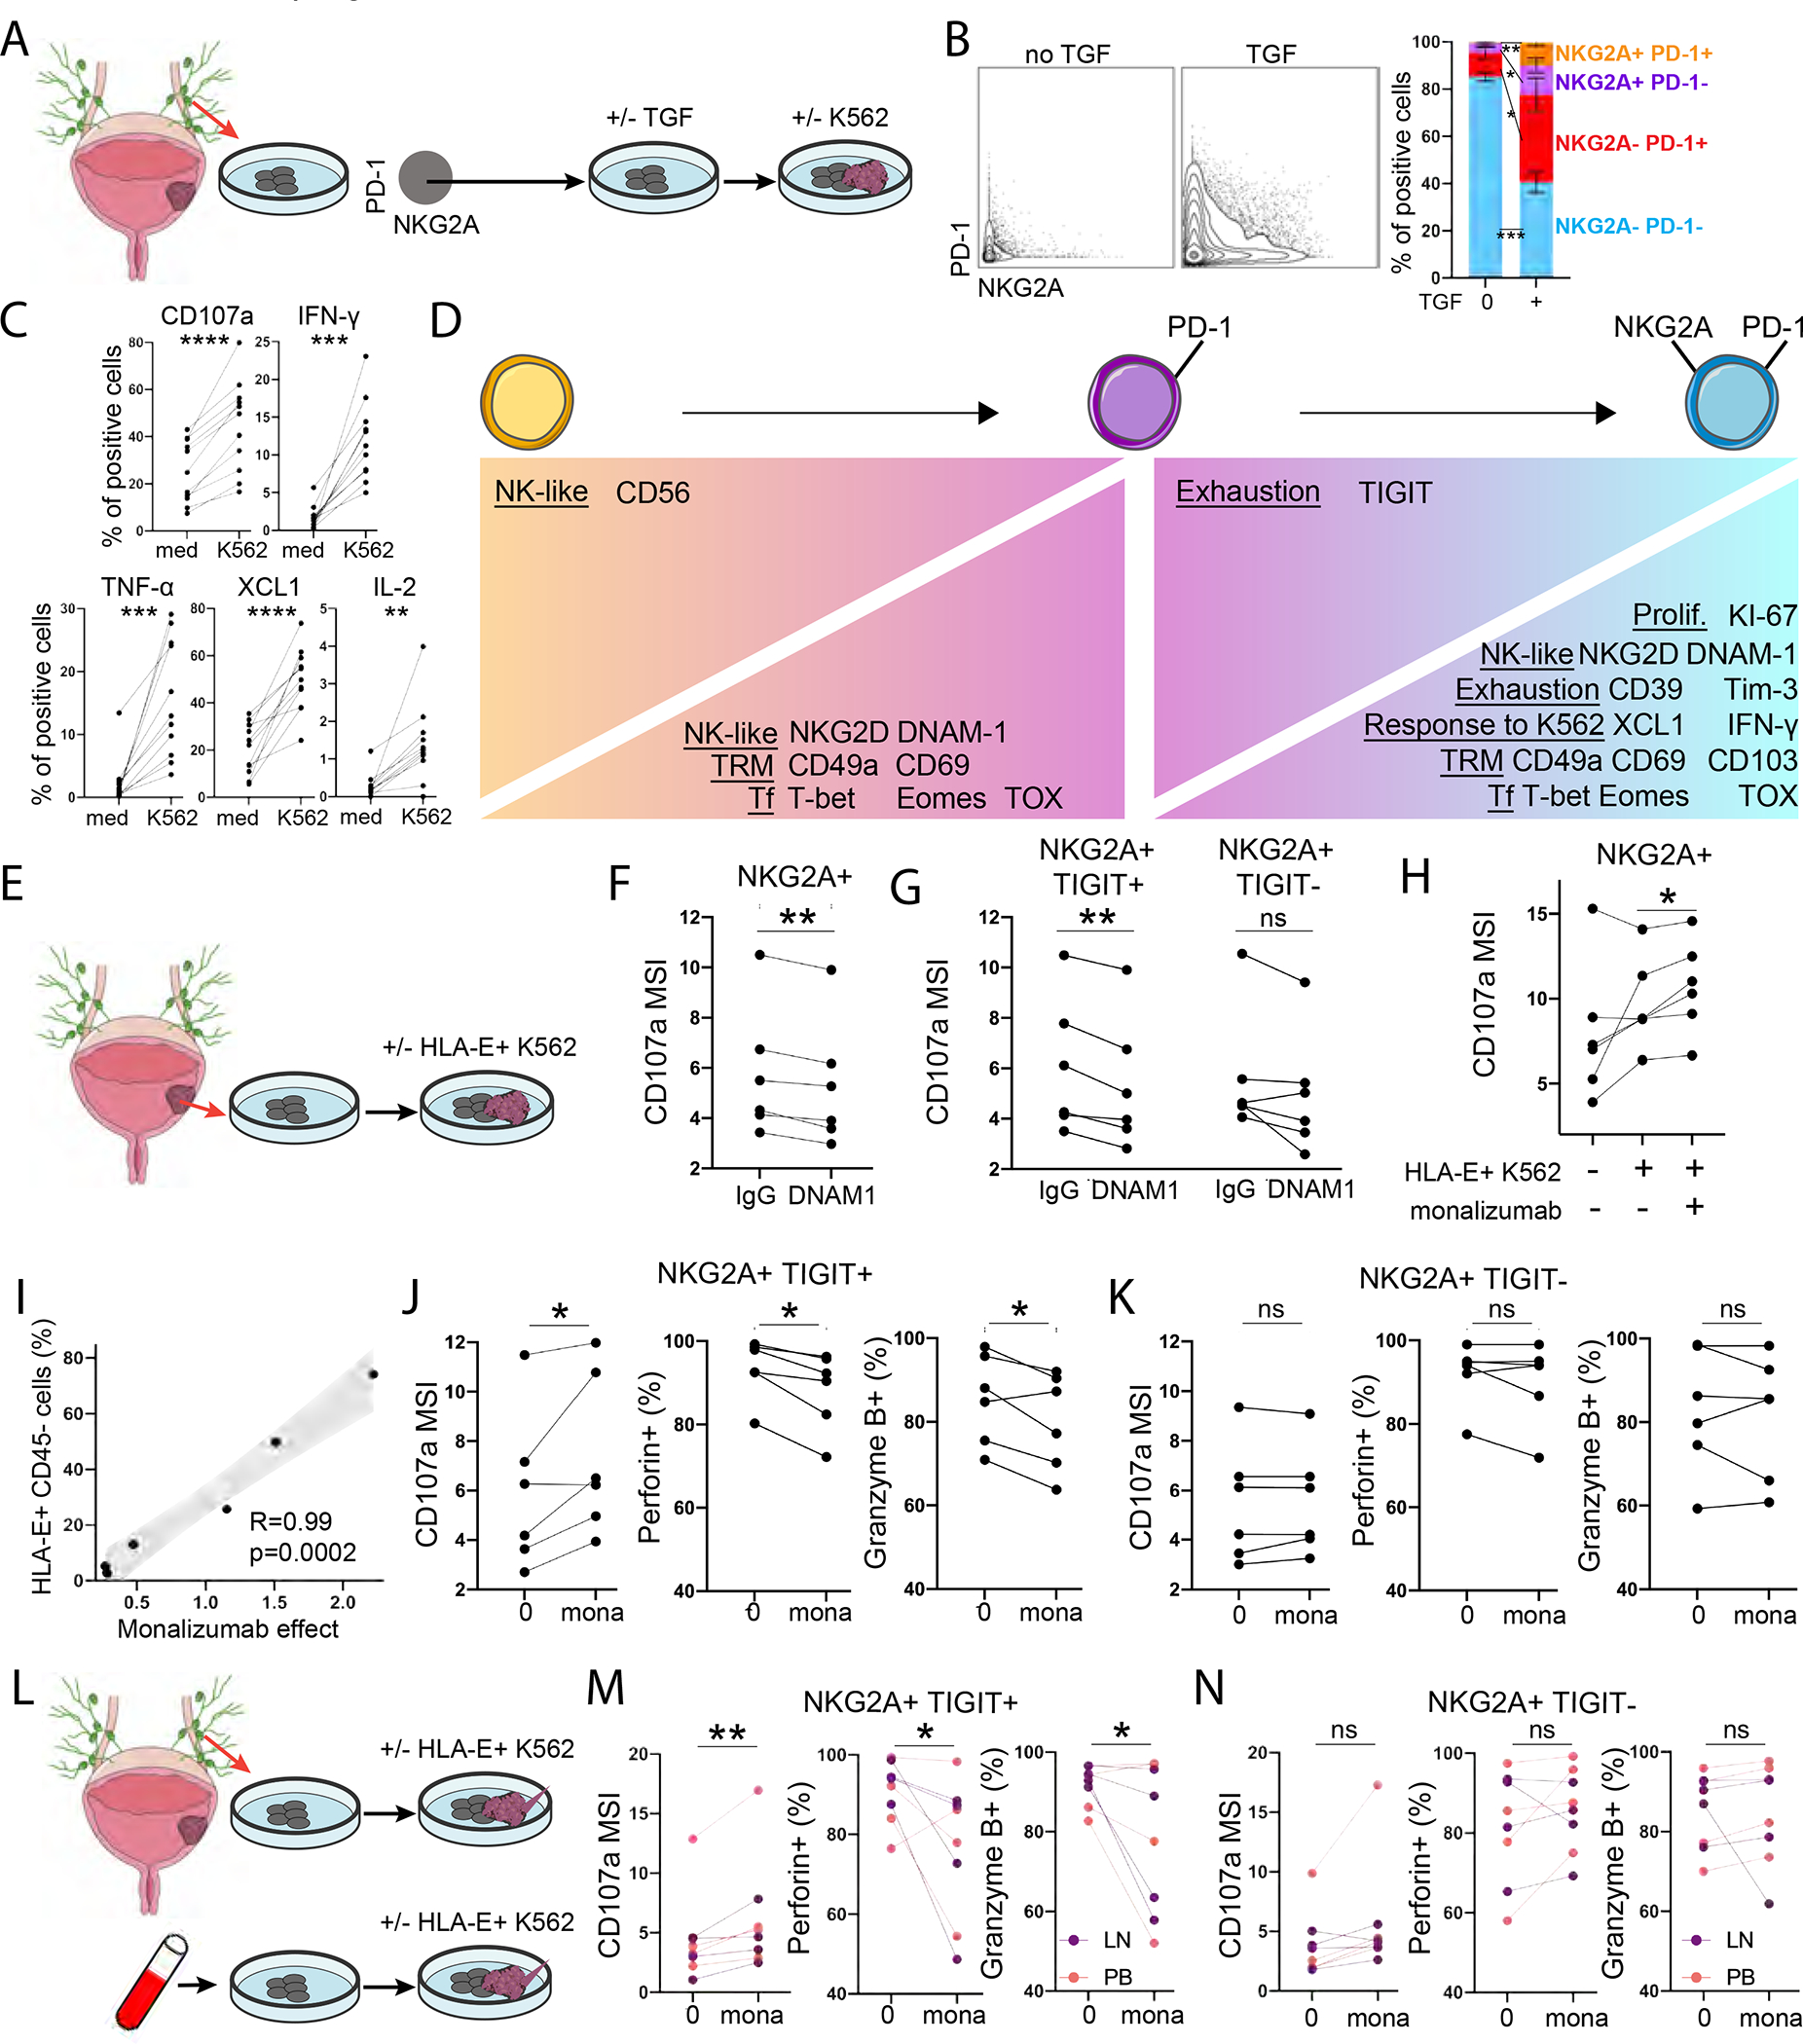
(A-D) CD8 T cells were expanded from BDLN. CD49a−/+ NKG2A− PD1− cells were then FACS-sorted and expanded during 3 days with or without TGF-β, prior to co-culture with K562. CyTOF was performed at all timepoints.
(B) NKG2A/PD1 expression on CD49a− NKG2A− PD1− CD8 T cells after culture with or without TGF-β (n=5).
(C) Upregulation of functional markers upon K562 stimulation of NKG2A− PD1− CD8 T cells after TGF-β culture (n=11).
(D) Phenotype and response to K562 after expansion of NKG2A− PD1− CD8 T cells and NKG2A/PD1 upregulation (n=11).
(E-K) CD8 T cells were expanded from bladder tumors (n=6) and co-cultured with HLA-E+ K562.
(F-G) Effect of DNAM-1 blockade on (F) NKG2A+ or (G) NKG2A+ TIGIT+/− CD8 T cell degranulation upon HLA-E+ K562 stimulation.
(H) Effect of NKG2A blockade (monalizumab) on CD8 T cell degranulation upon HLA-E+ K562 stimulation.
(I) Spearman correlation between HLA-E expression on CD45− bladder tumors and intensity of CD107a expression by NKG2A+ CD8 T cells that is restored by monalizumab upon co-culture with HLA-E+ K562.
(J-K) Effect of NKG2A blockade (monalizumab) on NKG2A+ TIGIT+/− CD8 T cell degranulation and release of cytotoxic mediators upon HLA-E+ K562 stimulation.
(L-N) CD8 T cells were expanded from BDLN (n=4) and PBMCs from BC patients (n=4) prior to co-culture with HLA-E+ K562.
(M-N) Effect of NKG2A blockade (monalizumab) on NKG2A+ TIGIT+/− CD8 T cell degranulation and release of cytotoxic mediators upon HLA-E+ K562 stimulation.
Paired t-tests were used in (C), (F)-(H), (J)-(K), (M)-(N). Corrections for multiple comparisons were applied in
(C)-(D). Only significant observations (p<0.05) are shown in (D). * p<0.05, ** p<0.01, *** p<0.001, **** p<0.0001. (B): Error bars represent the SEM. See also Figure S6, Tables S1, S4.
We used this experimental model to delineate effects of NKG2A and PD-1 acquisition on CD8 T cell phenotypes and response to HLA class I-deficient tumors. CD49a and CD69 were upregulated upon PD-1 acquisition, while CD103 was upregulated upon further acquisition of NKG2A, confirming enhanced TRM features in NKG2A+ CD8 T cells (Figure 6D, S6D–E). DNAM-1 and TFs associated with exhaustion (T-bet, Eomes, TOX) were progressively acquired during exposure to TGF-β1. TGF-β1-induced NKG2A acquisition on PD-1+ CD8 T cells correlated with stronger KI-67 expression (recent proliferation) and production of IFN-γ and XCL1 in response to HLA-deficient K562 tumors (Figure 6D, S6E–F). These results confirm the presence of an alternative path from CD8 T cell exhaustion with NKG2A acquisition, enhanced proliferation, TRM features and capacity to respond to HLA class I-deficient tumor cells.
HLA-E-expressing bladder tumors restrict NKG2A+ CD8 T cell functions, which are restored upon NKG2A blockade
Previous studies have demonstrated that HLA-E impairs NKG2A+ CD8 T cell and NK cell antitumor functions in patients with HNSCC, with promising applications for NKG2A blockade immunotherapy (André et al., 2018). Yet, the effect of HLA-E on TCR/CD28-independent innate-like functions by NKG2A+ CD8 T cells remains unknown. We isolated CD8 T cells from bladder tumors (n=6) and expanded them with CD3/CD28 tetramer and low-dose cytokines (Figure 6E). Upon expansion, the majority of NKG2A+ CD8 T cells expressed DNAM-1 (median 93%, range 74–99%). We co-cultured CD8 T cells with HLA-ABC− K562 tumors that were stably transfected with HLA-E to be used as a surrogate due to limited numbers of autologous tumors with variable HLA-E expression. We confirmed that NKG2A+ CD8 T cells from bladder tumors rely on DNAM-1 to react to HLA-E+ K562, as DNAM-1-blockade reduced their degranulation capacity (Figure 6F). TIGIT is an immune checkpoint that inhibits DNAM-1-mediated cell activation through competition for and sequestration of DNAM-1-L and the inhibition of DNAM-1 polarization at the cell surface (Banta et al., 2022). Here, we show the suppressive effects of DNAM-1-blockade are enhanced in the presence of TIGIT (Figure 6G).
NKG2A blockade (monalizumab) enhanced NKG2A+ CD8 T cell degranulation in response to HLA-E+ K562 tumors, with these effects being diminished in the absence of HLA-E (Figure 6H, S6G). We demonstrate that HLA-E is expressed at low but variable levels on primary bladder tumors (Figure 2C). In this analysis, the restoration of NKG2A+ CD8 T cell degranulation by monalizumab when co-cultured with HLA-E+ K562 tumors directly correlated with HLA-E expression on the primary tumors from which these CD8 T cells were originally isolated (Figure 6I). TIGIT was recently shown to converge with PD-1 to target and suppress DNAM-1 signaling (Banta et al., 2022). Here, the effect of NKG2A blockade on CD8 T cell innate-like function required TIGIT expression and resulted in the release of perforin and granzyme B by TIGIT+ NKG2A+ CD8 T cells (Figure 6J–K).
We validated the stimulatory effects of monalizumab on CD8 T cell innate-like functions upon expansion from BDLN (n=4) and PBMCs from BC patients (n=4), following the same protocol described above (Figure 6L). NKG2A blockade only induced degranulation and release of perforin and granzyme B by NKG2A+ CD8 T cells in the presence of TIGIT (Figure 6M–N). Collectively, our results demonstrate that HLA-E inhibits and impairs NKG2A+ CD8 T cell antitumor responses to HLA-ABC-deficient tumors, with stronger HLA-E-mediated inhibition correlating with stronger response to monalizumab.
Increased abundance of CD8 T cells expressing KLRC1 in bladder tumors associates with better response to PD-L1 blockade immunotherapy
Loss of antigen presentation by tumor cells is a common mechanism of tumor evasion in response to PD-1/PD-L1 blockade immunotherapy. NKG2A+ PD-1+ CD8 T cells degranulate and release cytotoxic mediators in response to HLA-ABC-deficient tumor cells. We thus evaluated the effect of KLRC1 (NKG2A) expression in bladder tumors on the response to PD-L1 blockade immunotherapy. We found, in the IMvigor210 cohort of patients with MIBC or metastatic BC, that KLRC1high patients displayed better survival following PD-L1 blockade (Figure 7A). This effect was restricted to patients with higher CD8A or PDCD1 gene expression or higher PD-L1 immunohistochemistry score (Figure 7B–D). These findings highlight the importance of NKG2A and HLA-E as an alternative immune checkpoint axis to target for overcoming mechanisms of resistance in PD-(L)1 blockade immunotherapies in bladder cancer.
Figure 7. KLRC1 (NKG2A) gene expression correlates with better survival in bladder cancer in response to PD-L1 blockade immunotherapy.
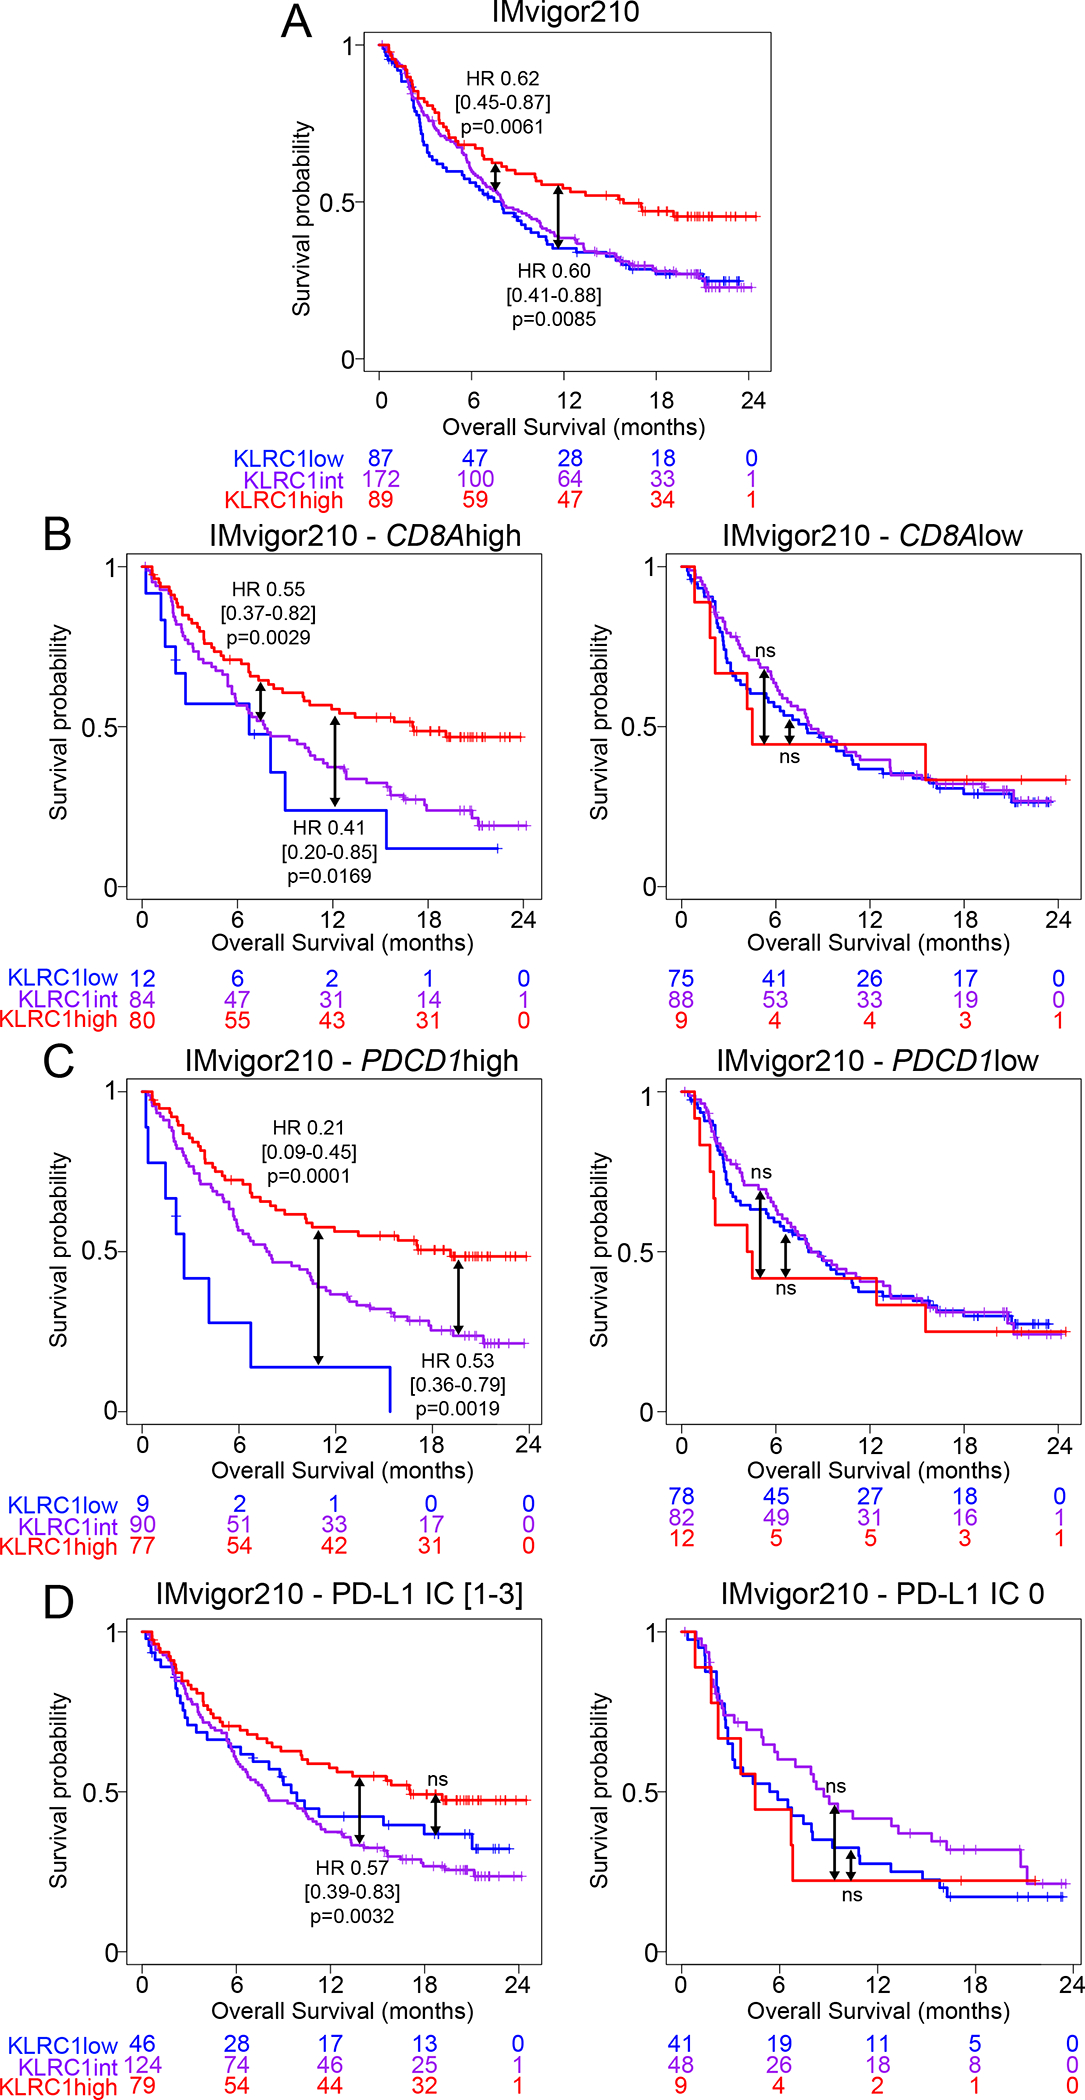
Kaplan-meier survival curves of MIBC and metastatic BC patients treated with PD-L1 blockade from the IMvigor210 cohort, showing the association between KLRC1 (NKG2A) expression and overall survival in (A) all patients or patients with (B) CD8Ahigh/low gene expression, (C) PDCD1high/low (PD-1) gene expression or (D) a PD-L1 immunohistochemistry score of 0 or [1–3].
Hazard ratios and p-values were calculated using COX proportional hazards regression models that were corrected for age, gender and race.
Discussion
Immunotherapies have revolutionized the treatment of cancer patients, though their efficacy remains variable depending on the tumor indication (Thommen and Schumacher, 2018). The FDA has approved several monoclonal antibodies for blocking PD-1/PD-L1 in advanced bladder cancer. Yet, this therapeutic strategy yields objective responses in only 15–30% of patients, suggesting additional mechanisms of resistance (Patel et al., 2020). A recent study demonstrated impaired conventional CD8 T cell response in BC (Han et al., 2021). The HLA-E/NKG2A immune checkpoint axis was recently shown to contribute to CD8 T cell exhaustion (van Hall et al., 2019). NKG2A blockade strategies have been developed and efficiency confirmed, in particular when in combination with anti-PD-L1 antibody blockade, for activating CD8 T cells in preclinical mouse models (André et al., 2018) and for improving clinical outcome in unresectable non-small cell lung cancer (Herbst, 2022).
Here, we show that NKG2A is acquired by CD8 T cells after other exhaustion markers in bladder tumors, in line with recent findings (Borst et al., 2022). NKG2A is universally defined as an inhibitory receptor. Strikingly, we observed that NKG2A correlates with better survival in MIBC patients with high CD8A or PDCD1 (PD-1) expression in their tumor, suggesting an alternative immune checkpoint axis that defines enhanced anti-tumor functions by NKG2A+ CD8 T cells in bladder tumor settings. We provide evidence that NKG2A+ CD8 T cells release cytotoxic mediators upon binding to NK-activating ligands in the absence of antigen presentation, providing a rationale for their protective role in bladder tumors, where loss of antigen presentation is a common phenotype. We further demonstrated that these TCR-independent, innate-like functions are partly mediated through DNAM-1 interactions with its ligands, CD112/CD155, expressed on bladder tumors. DNAM-1 expression is significantly higher on NKG2A+ CD8 T cells, and DNAM-1-mediated TCR-independent activation is restricted to NKG2A+ CD8 T cells in HDs. Strong downregulation of CD28 on NKG2A+ CD8 T cells alongside increased expression of PTGER4, the gene encoding a receptor for prostaglandin E2 which promotes CD28 loss on CD8 T cells (Chou et al., 2014), suggests a specialization of NKG2A+ CD8 T cells toward TCR-independent activation. In support of our findings, a phenotype of CD8 T cell-mediated killing of autologous tumors in the presence of anti-HLA class I antibodies was recently reported (Oh et al., 2020). The study concluded that this observation was reproduced across numerous experiments but without an explanation for the mechanism of action. Our results confirm TCR-independent activation of NKG2A+ CD8 T cells in bladder cancer and offer a mechanistic explanation for enhanced anti-tumor functions in response to HLA class I-deficient tumors.
In this study, we also provide evidence that tumor progression reinforces MHC class I downregulation on bladder tumors. We were able to exclude somatic mutations as the dominant driver for the loss in HLA class I expression on bladder tumors based on TCGA analyses and empirical HLA genotyping of matched tumor and germline tissues in our cohort. It will be important for future studies to investigate epigenetic effects on modulating expression of HLA class I allotypes on tumors.
In cancer and chronic viral infection, memory precursor CD8 T cells undergo a transitional stage prior to reaching terminal exhaustion. Transitionally exhausted CD8 T cells are defined by stronger effector function, proliferation and response to checkpoint blockade (McLane et al., 2019). This phenotype is lost upon terminal exhaustion. In our analyses, NKG2A+ PD-1+ CD8 T cells possess stronger evidence of recent proliferation compared to their NKG2A− PD-1+ counterparts. NKG2A+ CD8 T cell TCR-independent function is impaired by HLA-E but restored upon NKG2A blockade. Collectively, these findings suggest that NKG2A+ CD8 T cells might represent an additional transitional population, characterized by enhanced proliferation and TCR-independent function. We confirmed in publicly available transcriptomic CD8 T cell data from chronic cytomegalovirus mouse models (Hudson et al., 2019) that KLRC1 (NKG2A) and MKI67 (KI-67) expression increases in CD8 T cells upon transitional exhaustion and decreases upon terminal exhaustion, supporting our hypothesis.
We further demonstrated that TRM and exhaustion programs are concomitantly acquired on CD8 T cells in bladder tumors, with CD103 being specifically upregulated upon NKG2A but not PD-1 acquisition. CD103 binds to E-cadherin on tumors, reinforcing synapse stability and CD8 T cell cytotoxicity (Franciszkiewicz et al., 2013). TRM CD8 T cells preferentially infiltrate tertiary lymphoid structures within gastric TME (Mori et al., 2021). In BC, TRM CD8 T cells are enriched in tumors compared to the stroma and CD103 expression on CD8 T cells further associates with decreased tumor volume (Wang et al., 2015) and enhanced responses to PD-L1 blockade (Banchereau et al., 2021). Thus, stronger TRM features appear to enhance the observed superior anti-tumor functions by NKG2A+ CD8 T cells in bladder cancer.
While the TRM program allows NKG2A+ CD8 T cells to remain within the tumor tissue and TCR-independent activation contributes to their enhanced anti-tumor functions, HLA-E is a known inhibitor of NKG2A+ CD8 T cells and NK cell responses (André et al., 2018). HLA-E is commonly overexpressed on tumor cells, in part due to IFN-γ and senescence pathways (Pereira et al., 2019; van Hall et al., 2019). We demonstrate that HLA-E expression is also strongly downregulated in MIBC, suggesting regulatory mechanisms in response to the immunosuppressive environment. We show that HLA-E expression on tumors predicts in vitro efficacy of NKG2A blockade on the TCR-independent CD8 T cell response. HLA-E+ bladder tumors therefore induce NKG2A+ CD8 T cell inhibition, that is reversible upon NKG2A blockade.
Our study suggests that BC may provide an important indication for targeting the NKG2A/HLA-E axis, with HLA-E expression on baseline tumors acting as a potential important biomarker of selection. Additionally, HLA-ABC− tumors might be particularly sensitive to NKG2A+ CD8 T cell TCR-independent cytotoxicity. In our data, HLA-E was reduced but still expressed by most bladder tumors, and HLA-ABC was expressed on less then 32% of bladder tumors in MIBC. HLA-E and HLA-ABC expression can be assessed by routine immunohistochemistry in pathology laboratories. Future clinical trials may therefore investigate if HLA-E and/or HLA-ABC expression on bladder tumors could predict patient response to NKG2A blockade.
There are limitations to our study. TCR clonality analyses should be performed with additional larger datasets that would allow for the evaluation of KLRC1high/low subsets within a defined population rather than bulk CD8 T cells. Mass cytometry is a high-throughput technique that yields reproducible results of strong quality, though requires a large quantity of cells. Therefore, CD8 T cell expansion from bladder tumors, as recently described (Oh et al., 2020), was required to apply mass cytometry to our functional assays. We also used the K562 tumor cell line as a surrogate for MHC class I-deficient autologous bladder tumor cells, as they are routinely used to evaluate TCR/MHC-independent activation pathways. Wild-type or HLA-E+ K562 cells lack PD-L1 expression and did not afford us the opportunity for studying the combined effects of NKG2A and PD-L1/PD-L1 blockade. Finally, TIGIT and DNAM-1 were involved in the regulation of NKG2A+ CD8 T cell innate-like functions. Future studies should further evaluate these pathways on primary tumors as well as evaluate the potential contribution of CD96 and CD112R to the regulation of NKG2A+ CD8 T cells.
In this study, we show that KLRC1 (NKG2A) expression associates with better response to PD-L1 blockade (atezolizumab) in CD8Ahigh, PDCD1high, or PD-L1high bladder tumors. The potential for KLRC1 as a predictive biomarker of response to PD-L1 blockade therapy should be further investigated in future studies and could utilize the ImVigor-211 cohort when those data become available. Loss of antigen presentation is a common mechanism of resistance to PD-1/PD-L1 blockade (Lee et al., 2020). NKG2A+ CD8 T cell TCR-independent functions might therefore contribute, indirectly, to overcoming resistance to PD-1/PD-L1 blockade. While PD-1 blockade specifically restores TCR signaling, NKG2A blockade restores NKG2A+ CD8 T cell TCR-independent functions. It has indeed been reported that NKG2A prevents the translocation of lipid rafts to the immune synapse and proper amplification of T cell and NK activating signals (Cichocki and Miller, 2019). Our data demonstrate that HLA-E is expressed at low but variable levels on bladder tumors; When expressed, it directly inhibits the NKG2A+ CD8 T cell response to HLA-ABC-deficient tumors. Given the critical role of NKG2A+ CD8 T cells in enhancing the anti-tumor immune response to PD-L1 blockade, combining PD-1/PD-L1 blockade with NKG2A blockade might therefore be worth considering in patients with HLA-E-expressing bladder tumors. In stage III non-small cell lung cancer, interim results from the COAST trial of monalizumab in combination with durvalumab demonstrated a prolonged survival rate compared to durvalumab alone (Herbst, 2022). Collectively, our data indicate that NKG2A+ CD8 T cells display a strong capacity for TCR-independent activation that enables them to circumvent tumor escape mechanisms and call for a thorough reappraisal of current protocols that assess CD8 T cell exhaustion and the strategies for restoring their antitumor functions.
STAR METHODS
RESOURCE AVAILABILITY
Lead contact
Further information and requests for resources and reagents should be directed to and will be fulfilled by the Lead Contact Amir Horowitz (amir.horowitz@mssm.edu).
Materials availability
This study did not generate new unique reagents.
Data and code availability
The single-cell RNA sequencing data generated in this article were deposited on Mendeley at DOI 10.17632/7yb7s9769c.1.
EXPERIMENTAL MODEL AND SUBJECT DETAILS
Human subjects
Healthy donor buffy coats were purchased from the New York City Blood Center (New York, NY, USA). Peripheral blood, tumor tissue, adjacent non-tumoral tissue and bladder-draining lymph nodes were obtained from bladder cancer patients upon cystectomy or transurethral resection of bladder tumor (TURBT) at the Mount Sinai Medical Center (New York, NY, USA) after getting informed consent. All protocols were reviewed and approved by the Institutional Review Board at the Icahn School of Medicine at Mount Sinai (IRB 10–1180). Patient information is detailed in Table S1.
Cell lines
HLA-E+ and Wild-type K562 cell lines were kindly provided by Deepta Bhattacharya and propagated as recently described (Berrien-Elliott et al., 2020). HLA-E+ K562 cells were generated using the AAVS1-EF1a donor plasmid containing the coding sequence for human HLA-E. The K562 were electroporated using a Bio-Rad Gene Pulse electroporation system. HLA-E+ cells were sorted to >98% purity. Bladder cancer cell lines were provided by John Sfakianos: 253J(RRID: CVCL_7935), 639V(RRID: CVCL_1048), 5637(RRID: CVCL_0126), J82(RRID: CVCL_0359), KU-19–19(RRID: CVCL_1344), MGHU3(RRID: CVCL_9827), RT4(RRID: CVCL_0036), RT112(RRID: CVCL_1670), SW1710(RRID: CVCL_1721), T24(RRID: CVCL_0554), UMUC3(RRID: CVCL_1783).
METHOD DETAILS
Sample processing
Ficoll separation was used to obtain PBMCs from healthy donor buffy coats and peripheral blood from bladder cancer patients. Tumor and adjacent, non-involved tissues were digested at 37C using tumor dissociation enzymes (Miltenyi, 130–095-929) and a GentleMACS machine (program 37C_h_TDK_2). Lymph nodes were mechanically dissociated at room temperature using a GentleMACS machine (program m_spleen_04_02). Tumor-, adjacent tissue- and lymph node-derived cell suspensions were then sequentially filtered through 100μM, 70μM and 40μM cell strainers, washed twice with phosphate-buffered saline (PBS) and resuspended in RPMI-1640 medium supplemented with 10% heat-inactivated fetal bovine serum (FBS), 1% Penicillin, 1% Streptomycin and 1% L-glutamine. Cells were counted using a hemocytometer. In certain cases, cells were frozen in FBS supplemented with dimethyl-sulfoxide (DMSO).
Flow cytometry
Cells were stained extracellularly for 30 minutes at 4C in FACS buffer (PBS supplemented with 2% heat-inactivated FBS and EDTA 2mM). Following the extracellular staining, cells were washed in PBS and incubated during 20 minutes with a viability dye. Cells were then washed with PBS and resuspended in 2% paraformaldehyde prior to their acquisition at an LRS-Fortessa machine (BD Biosciences). Data were analyzed using the Cytobank software. When staining for HLA-E and HLA-ABC, cells were first stained 20 minutes with HLA-E, prior to staining with additional antibodies, including HLA-ABC, due to cross-reactivity between clones 3D12 and W6/32. When staining for NKp30-L, NKp44-L and NKp46-L, cells were first stained with NKp30-, NKp44- or NKp46-Fc for 30 minutes on ice, washed with FACS buffer and further stained with anti-human IgG Fc during 30 minutes on ice, prior to incubation with a viability dye.
Multi-chromagen immunohistochemistry on formalin-fixed and paraffin-embedded bladder tumors
Formalin-fixed paraffin-embedded (FFPE) 3-μm sections were used for multi-chromogen sequential immunohistochemistry (IHC). IHC was performed using the Ventana Discovery Ultra (Roche Diagnostics). This system allows automated baking, deparaffinization, and cell conditioning. Chromogen sequential IHC was performed using RUO Discovery Universal (v21.00.0019). Primary antibodies were divided into two panels targeting CD3, HLA-E, and PD-L1 (1st section) and EpCAM, HLA-ABC, and PD-1 (immediately consecutive section) were used to stain bladder tumors from patients with NMIBC (n=11) and MIBC (n=8). All primary antibodies were incubated for 60 minutes at 37°C. OmniMap HRP or NP DISCOVERY (RUO) (Roche Diagnostics) were used as secondary antibodies. The signal was detected using Discovery OmniMap (Purple (CD3 or EpCAM), Teal (PD-L1 or HLA-ABC), or Yellow (HLA-E or PD-1) kits). Mayer’s hematoxylin was used for nuclear counterstaining. Whole tissue sections on the slide were converted into high-resolution digital data using a NanoZoomer S210 Digital slide scanner (Hamamatsu).
Immunofluorescence staining of FFPE bladder tumors
FFPE tissue sections (3-μm), immediately consecutive to sections stained by IHC, were used for immunofluorescence staining with antibodies targeting CD3 (Abcam, cat. AF752), NKp46 (Innate Pharma, Marseille, FRANCE), and NKG2A-FITC (REA110, Miltenyi Biotec). Briefly, following deparaffinization and ethanol washes, tissue sections were blocked with 1% goat and donkey serum in PBS-Tween 20 (0.2%) for 1h RT. Cells were then incubated with anti-CD3, anti-NKp46 and anti-NKG2A primary antibodies diluted 1/100 in 1% goat serum-PBS-Tween 20 (0.2%) and incubated overnight at 4°C in a humidified chamber. Sections were then washed three times in PBS for 5 minutes. Secondary donkey anti-rabbit Alexafluor-568 and goat anti-mouse Alexafluor-647 antibodies were diluted 1:100 in 1% goat and donkey serum PBS-Tween 20 (0.2%) and incubated RT for 1h. Nuclei were counterstained with DAPI (1 μg/ml). Slides were coverslipped using fluorescence mounting medium (Dako). Images were captured using the Nikon Eclipse E600 microscope and DS-Qi1 monochrome camera.
Semi-automated digital imaging analysis to quantify expression of HLA class I and immune infiltration
Digital slide review and quality control assessment were performed by a board-certified pathologist (R.B). Regions of tissues defined by folds and staining artefacts were excluded from analyses. HALO™ digital imaging analysis platform was used for quantitative tissue analysis (Indica Labs, Inc.), using Halo AI™ for train-by-example classification and segmentation followed by random forest algorithm classifier, multiplex IHC module and color deconvolution to separate chromogenic stains to prepare for quantitative analysis. Briefly, bladder tumor sections were classified into features defined by cell lineages: tumors, stroma, and immune cells as well as glass exposed through torn tissue, which was excluded from subsequent semi-automated analyses. The numbers of individual tumor, stromal and immune cells staining negative or positive for all antibodies were enumerated in each region of interest (ROI) analyzed. Positively staining tumor cells were stratified as tertiles (dim, moderate, and bright). External control tissues derived from human tonsil were used to calibrate staining intensity detection limits. For each tissue section, a minimum of five ROIs were analyzed and the total surface area (mm2) was recorded.
In situ Hybridization of mRNA (HTG Molecular™)
Formalin-fixed paraffin-embedded (FFPE) 5-μm and 10-μm sections were used for in situ hybridization of mRNA by HTG Molecular Diagnostics™. Samples were permeabilized with HTG EdgeSeq lysis buffer prior to incubation with nuclease protection probes. Excess probes and non-hybridized mRNA were then removed by nuclease digestion. Samples were multiplexed using primers, allowing simultaneous analysis with the Illumina sequencing platform in order to constitute the sample library. Samples were quantified in triplicates and dilution calculations were performed using the HTG library calculator. Library was denatured at 98C for 4 minutes and with 2N NaOH prior to loading into the cartridge well for sequencing on the Illumina NextSeq sequencer. HTG EdgeSeq parser software was used to import sequencing data. Quality control and normalization were performed by HTG Biostatistics department. Demultiplexed FASTQ files were re-imported into the HTG EdgeSeq parser software, aligned to the probe list and pooled together.
K562 stimulation of CD8 T cells from HD PBMCs
HD PBMCs were thawed and resuspended in cell medium (RPMI-1640 medium supplemented with 10% heat-inactivated FBS, 1% Penicillin, 1% Streptomycin and 1% L-glutamine). CD4+ cells were removed using EasySep CD4 positive selection kit (Stemcell, cat#17852) and CD3+ cells further enriched using EasySep Release CD3 positive selection kit (Stemcell, cat#17751). Enriched CD8 T cells were then cultured overnight in cell medium supplemented with IL-12, IL-15 and IL-18 (each at 10ng/mL). On the following day, CD8 T cells were co-cultured with K562 at a 1:1 ratio during 5 hours in the presence of brefeldin and monensin. For experiments using blocking antibodies, CD8 T cells were incubated during 30 minutes at room temperature with monalizumab, anti-DNAM1 (DX11), anti-NKG2D (BAT221), anti-NKp30 (F252), anti-NKp46 (KL247), or isotype controls prior to the K562 co-culture.
CD3/CD28 stimulation of CD8 T cells from HD PBMCs
HD PBMCs were thawed and resuspended in cell medium (RPMI-1640 medium supplemented with 10% heat-inactivated FBS, 1% Penicillin, 1% Streptomycin and 1% L-glutamine). CD4+ cells were removed using EasySep CD4 positive selection kit (Stemcell, cat#17852) and CD3+ cells further enriched using EasySep Release CD3 positive selection kit (Stemcell, cat#17751). Enriched CD8 T cells were then cultured for 24h in cell medium supplemented with IL-7 10ng/mL, IL-15 10ng/mL, IL-2 10IU/mL with or without CD3/CD28 Dynabeads and flow cytometry performed at the end of the assay.
Expansion of CD8 T cells from bladder cancer patients
CD4+ cells were removed from freshly dissociated bladder-draining lymph nodes or bladder tumors using EasySep CD4 positive selection kit (Stemcell, cat#17852) and CD3+ cells further enriched using EasySep Release CD3 positive selection kit (Stemcell, cat#17751). Enriched CD8 T cells were seeded at a concentration of 1 million cell/mL in U-bottom 96-well plates in Immunocult medium (Stemcell), in the presence of IL-2 (10IU/mL), IL-7 (10ng/mL), IL-15 (10ng/mL) and CD3/CD28 tetramer (25μL/mL). Half of the medium was replaced with IL-2, IL-7, IL-15 at twice final concentration every 2 days. Cells were split when reaching affluence. CD3/CD28 tetramer was added at Day 10 or Day 11 and eventually at Day 15 expansions longer than 15 days. CD8 T cells from bladder-draining lymph nodes were expanded for 8–13 days (8, 11, 12, 13, 13, 13 days), while CD8 T cells from bladder tumors were expanded for 11–17 days (11, 11, 11, 14, 15, 17 days).
CD8 T cells from bladder tumors were directly co-cultured upon expansion for 5 hours with monensin, brefeldin +/− WT (HLA-E−) or HLA-E+ K562 (1:1 E:T ratio). When using NKG2A blockade, CD8 T cells were stained with monalizumab for 30 minutes at room temperature prior to co-culture.
CD8 T cells from bladder-draining lymph nodes were FACS-sorted based on CD49a, NKG2A and PD-1 upon 8–13-day expansion with a purity higher than 95% (BD FACSAria II, 100μM nozzle). Resulting cell populations were cultured in Immunocult medium (Stemcell) in the presence of IL-2 (10IU/mL), IL-7 (10ng/mL), IL-15 (10ng/mL), CD3/CD28 tetramer (25μL/mL) +/− TGF-β (5ng/mL) for another 3 days, with replacement of half medium on the second day. Mass cytometry stainings were performed at day two and day three. On day three, cells were washed, counted, and cultured for 5h in the presence of monensin, brefeldin +/− WT (HLA-E−) K562 (1:1 E:T ratio) prior to staining.
Mass Cytometry antibody preparation
When available, conjugated antibodies were purchased from Fluidigm. Remaining antibodies were purchased carrier-free and were conjugated in-house using the Maxpar X8 and MCP9 labeling kits (Fluidigm), as per the manufacturer instructions. Platinum barcodes were prepared as described previously (Hartmann et al., 2018). All antibodies were titrated prior to use.
Mass Cytometry staining
Cells were incubated during 20 minutes at 37C in cell medium (RPMI-1640 medium supplemented with 10% heat-inactivated FBS, 1% Penicillin, 1% Streptomycin and 1% L-glutamine) in the presence of IdU (Fluidigm, cat#201127), Rh103 (Fluidigm, cat#201103A) and eventually anti-IgG4 if cells were co-cultured with K562 and monalizumab. Cells were centrifuged and washed with PBS 0.2% Bovine Serum Albumin (BSA) prior to a 3-minute incubation on ice with an Fc-blocking reagent (BioLegend, cat# 422302). Samples were then washed and incubated with Platinum barcodes for 30 minutes on ice. When staining a maximum of 4 samples, cells were single-barcoded using 194Pt, 195Pt, 196Pt or 198Pt. When staining 5 or 6 samples, cells were stained with a dual combination of these barcodes. Cells were then washed with PBS 0.2% BSA, barcoded samples pooled together, washed and stained with extracellular antibodies for 30 minutes on ice in PBS 0.2% BSA. Samples were then washed with PBS 0.2% BSA and resuspended in Fixation/Perm buffer (Invitrogen, cat#00–5523-00) for 30 minutes on ice. Cells were then centrifuged and washed with Maxpar Barcode Perm Buffer (Fluidigm, cat#201057) and barcoded using the Cell-ID 20-Plex Pd Barcoding kit (Fluidigm, cat#201060). Barcoded samples were then washed with permeabilization buffer (Invitrogen, cat#00–5523-00) and pooled together prior to intracellular staining in permeabilization buffer in the presence of Heparin 100U/mL for 30min on ice. Stained cells were washed with permeabilization buffer and resuspended in PBS in the presence of PFA 2.4%, saponin 0.08%, Osmium tetroxide 0.075nM and Ir 0.125uM (Fluidigm, cat#201192A). Stained samples were finally washed and resuspended in PBS 0.2% BSA and data acquired within four days, or frozen in FBS/DMSO 90/10. Antibody panels 1–3 were used to stain HD PBMCs (panel 1: Figure 3A–B, panel 2: Figure 3C, panel 3: Figure 3D–G). Antibody panel 3 was used to stain bladder cancer patient samples.
Mass Cytometry sample acquisition and processing
Immediately prior to acquisition, samples were washed with Cell Staining Buffer and Cell Acquisition Solution (Fluidigm) and resuspended in Cell Acquisition Solution at a concentration of 1 million cells per ml containing a 1:20 dilution of EQ normalization beads. The samples were acquired on the Fluidigm Helios mass cytometer using the wide bore injector configuration at an acquisition speed of < 400 cells per second. The resulting FCS files were normalized and concatenated using Fluidigm’s CyTOF software. The FCS files were further cleaned using the Human Immune Monitoring Center at Mt. Sinai’s internal processing pipeline. The pipeline removes aberrant acquisition time-windows of 3 seconds where the cell sampling event rate goes above or below 2 standard deviations from the mean acquisition speed. EQ normalization beads are removed as well as low DNA intensity events. Samples were demultiplexed by calculating the cosine similarity of every cell’s Palladium barcoding channel to every possible barcode used in a batch. Once the cell has been assigned to a sample barcode, a signal-to-noise metric is calculated by taking the difference between its highest and second highest similarity scores. Any cells with low signal-to-noise are flagged as multiplets and removed from that sample. Finally, acquisition multiplets are removed based on the Gaussian parameters Residual and Offset acquired by the Helios mass cytometer. CD8 T cells were then selected on Cytobank as live CD45+ CD4− CD14− CD19− Vα24/Jα18 TCR− γδTCR− CD3+ CD8+ cells.
Mass Cytometry data analysis
Cytobank was used to assess the frequencies of cells expressing markers of interest. For further analyses, CD8 T cells were exported from Cytobank as FCS files and imported into the R software using the cytof_exprsMerge function (Cytofkit). Inverse hyperbolic sine transformation with a cofactor of 5 was applied. For bladder cancer patient samples, all cells were analyzed. For healthy donor PBMCs, a maximum of 1,000 NKG2A+ and 1,000 NKG2A− CD8 T cells was imported per donor and condition. Associations between phenotype and K562-induced functional response on HD CD8 T cells were determined using linear models (lm() function). Models were constructed as X~Y*Z, with X the expression of a functional marker, Y the expression of a phenotypic marker, and Z the condition (medium or K562). Results were visualized with the ggraph package.
FlowSOM cluster analysis was performed on K562-stimulated HD CD8 T cells using the cytof_cluster function (Cytofkit) based on the percentage of expression of each marker, with an assigned number of clusters (n=15). The threshold of positivity for each marker was defined using manual gating. One anecdotical cluster was removed from the analysis, as containing less than 1% of the total cells. Heatmap of the cluster phenotypes was obtained using the pheatmap function. Functional strength indexes were calculated for each cluster and condition as the sum of all individual functional marker strength indexes. Functional marker strength indexes were defined as [frequency of cells expressing a marker X]*[mean signal intensity of the marker X on X+ cells].
T-SNE analysis on ex vivo bladder samples was conducted using the cytof_dimReduction function (Cytofkit) on all CD8 T cells from the tumor and adjacent tissue (n=1,089 and 564, respectively) and on a maximum of 1,100 CD8 T cells from the bladder-draining lymph nodes (maximum number of iterations = 1,000). Results were visualized using the ggplot2 and pheatmap packages.
Pseudotime was calculated on ex vivo bladder tumors using the CytoTree package. Cells were clustered, principal component analysis was performed, cell dimensionality was reduced based on UMAP and t-SNE methods and trajectory trees built. Root clusters were manually defined and pseudotime was calculated using the t-SNE dimensions. Results were visualized with the plot2D, plotTree, plotPieTree and plotPseudotime functions. Spearman correlations were performed on marker expression levels and pseudotime. P-values were adjusted using the Benjamini-Hochberg method and results represented with the ggplot2 package.
Pseudotime was determined using the same pipeline on expanded CD8 T cells from bladder tumors that were cultured for 5 hours with or without K562. Pseudotime effect on CD8 T cell function was assessed on TGF-β-cultured CD8 T cells using linear models (lm() function). Models were constructed as X~Y*Z, with X the expression of a functional marker, Y the pseudotime and Z the condition (medium or K562). Effect of the expression of each marker on CD8 T cell function was assessed using linear models on TGF-β-cultured CD8 T cells as X~Y*Z, with X the expression of a functional marker, Y the expression of a phenotypic marker and Z the condition (medium or K562). P-values were adjusted using the Benjamini-Hochberg method. Results were visualized using the GraphPad Prism software.
Monalizumab effect on NKG2A+ CD8 T cell degranulation displayed in Figure 6I was assessed as follows: [Median Signal Intensity of CD107a on NKG2A+ CD8 T cells co-cultured with HLA-E+ K562 in the presence of monalizumab] – [Median Signal Intensity of CD107a on NKG2A+ CD8 T cells co-cultured with HLA-E+ K562 in the absence of monalizumab].
TCGA and IMvigor analyses
The TCGA cohort contains 406 total patients, including 371 MIBC and n=5 NMIBC patients. Pathologic T stage information could not be retrieved for the 30 remaining patients. Nine patients were previously treated with radiation, one with intravesical BCG and radiation, and 36 with intravesical BCG alone. Treatment information was not accessible for remaining patients. KLRC1, CD8A and PDCD1 gene expression levels were scaled prior to all analyses. The 25% and 75% quantiles were used to distinguish KLRC1low (<25%), KLRC1int (25–75%) and KLRC1high (>75%) patients. The median was used to identify CD8Alow/CD8Ahigh and PDCD1low/PCDD1high patients. Patients from the IMvigor cohorts were additionally divided based on the PD-L1 score assessed by immunohistochemistry. Analyses were performed using the survminer and survival packages. Survival curves were generated with Kaplan-Meier analyses. Hazard ratios and p-values were calculated with Cox proportional hazards regression models corrected for age and number of somatic mutations. Gender has no effect on survival in our model and was therefore not included as a correction factor.
Single-cell RNA sequencing sample preparation
ScRNA-seq was performed on freshly dissociated bulk tumor cells (n=7) or on CD45+ and CD45− FACS-sorted freshly dissociated tumor cells (n=7) (Table S1) using a Chromium controller (10x Genomics), as previously described (Wang et al., 2021). Briefly, gel-bead in emulsion were generated, cells were lysed and barcoded cDNA amplified for 12 cycles. Amplified cDNA was fragmented and subjected to end-repair, poly A-tailing, adapter ligation, and 10x–specific sample indexing following the manufacturer’s protocol. Bioanalyzer (Agilent Technologies) and QuBit (ThermoFisher Scientific) were used to quantified the libraries, which were then sequenced in dedicated flowcells in paired-end mode on a HiSeq 2500 (Illumina) targeting a depth of 5E104–1E105reads per cell.
Single-cell RNA sequencing analysis
Raw sequencing data were aligned and quantified using CellRanger against the provided GRCh38 human reference genome. Seurat was then used for all remaining steps. For each sample, cells were first selected as expressing less than 16–20% mitochondrial genes and displaying a minimum of 200–300 and a maximum of 2500–3500 features. Data were then log-normalized using a scale factor of 10,000. The 2,000 most variable features were then identified, data were scaled based on all the features, and principal component analysis was performed. Dimensionality of the dataset was then assessed using the JackStraw and ElbowPlot functions. Clusters were calculated and data dimensions were reduced using the t-SNE and UMAP methods. Metadata containing clinical information was added to each sample prior to merging. Bulk cells were merged for the HLA analysis, while CD8 T cells only were merged for the CD8 T cell analysis. CD8 T cells were identified using the FindAllMarkers and the VlnPlot functions. CD8 T cell clusters were extracted and any contaminating CD4+, CD3D− CD3E− CD3G− or CD8A− CD8B− cell was removed using the WhichCells function, prior to performing RNA velocity analyses. For HLA analyses, differentially expressed genes were selected using the FindAllMarkers function. Genes expressed by at least 25% of the cells and presenting a log(fold change) of at least 0.25 were selected. Clusters were manually annotated based on these differentially expressed genes. The FeaturePlot function was used to display HLA-A, -B, -C, -E and B2M expression on the UMAP clusters. Differential expression of HLA-A, -B, -C, -E and B2M between the tumor and immune clusters was assessed for each donor on the RNA assay using the FindMarkers function.
RNA velocity analysis
BAM files were sorted using SAMtools (Li et al., 2009) and aligned to the GRCh38.14 human reference genome, and loom files with spliced vs unspliced counts on a cell and gene specific level were created using velocyto (La Manno et al., 2018; Zerbino et al., 2020). Velocity was then calculated with scVelo (Bergen et al., 2020). The single cell data were filtered, normalized, log transformed, and concatenated into a single file. Filtering was performed based on unspliced count detection, with a minimum of unspliced and spliced counts to be detected in 30 cells. Unsupervised clustering was performed using the Louvain modularity score and velocity counts. Initial and terminal states were stochastically estimated using cellRank (Lange et al., 2022), and initial states were manually inspected and assigned according to those without expression of PDCD1, KLRC1, TIGIT, and HAVCR2. Latent time was then calculated using estimated initial and terminal states. Finally, heatmaps were generated using the calculated velocity as a function of latent time. All analyses were performed in Python version 3.7.2 and were run on Mount Sinai’s supercomputing cluster, Minerva (Kovatch et al., 2020).
DNA extraction and HLA genotyping
DNA was extracted from bulk PBMCs, bulk tumors or the CD45− tumor fraction using the DNeasy blood and tissue kit (Qiagen). The CD45− tumor fraction was obtained using the EasySep human CD45 depletion kit (Stemcell technologies). DNA was quantified using a Nanodrop spectrophotometer (Thermofisher) and stored at −20C. HLA class I genotyping was performed by M.Carrington’s laboratory at the National Cancer Institute (Bethesda, MD, USA), following a previously described protocol (Bashirova et al., 2020).
TCR clonality analysis
TCR clonality in KLRC1high/low CD8 T cells from bladder tumors (n=7) and non-involved adjacent tissue (=2) was determined using previously published data (Oh et al., 2020). ScRNAseq data was downloaded and pre-processed following our scRNAseq analysis pipeline. KLRC1 threshold for high versus low expression was manually assigned as 1 based on scaled gene expression. KLRC1 expression (high vs low) per cell was then combined with alpha and beta CDR3 information to determine the frequency of TCRs expressed by 1, 2 or at least 3 cells in the KLRC1high or KLRC1low fractions.
QUANTIFICATION AND STATISTICAL ANALYSIS
Details on the statistic tests used can be found in the figure legends. Statistical analyses were performed using R software version 3.6.0 or 4.0.5 and GraphPad Prism software version 9.0.0. Bar graphs show mean ± standard error mean. Statistical significance is defined as p-value <0.05. P-values are indicated in the figure legends and on the plots. * p<0.05, ** p<0.01, *** p<0.001, **** p<0.0001.
Supplementary Material
Table S2 Single-cell RNA sequencing cluster assignment, Related to Figure 2
Table S5 RNA velocity analysis, Related to Figure 5
KEY RESOURCE TABLE.
| REAGENT or RESOURCE | SOURCE | IDENTIFIER |
|---|---|---|
| Antibodies | ||
| Anti-human HLA-ABC BV605 (W6/32) | BioLegend | Cat#311432; RRID: AB_2566151 |
| Anti-human HLA-E PE (3D12) | BioLegend | Cat#342604; RRID: AB_1659249 |
| Anti-human CD112 APC (610603) | R&D systems | Cat#FAB2229A; RRID: AB_10973290 |
| Anti-human CD155 PerCP/Cy5.5 (SKII.4) | BioLegend | Cat#337612; RRID: AB_2565536 |
| Anti-human PD-L1 PerCP/Cy5.5 (29E.2A3) | BioLegend | Cat#329738; RRID: AB_2617010 |
| Anti-human PD-L2 APC/Cy7 (MIH18) | BioLegend | Cat#345516; RRID: AB_2783234 |
| Anti-human ULBP-1 PerCP (170818) | R&D systems | Cat#FAB1380C; RRID: N/A |
| Anti-human ULBP-2/5/6 AF488 (165903) | R&D systems | Cat#FAB1298G; RRID: N/A |
| Anti-human ULBP3 APC (166510) | R&D systems | Cat#FAB1517A; RRID: N/A |
| Anti-human MICA APC (159227) | R&D systems | Cat#FAB1300A; RRID: AB_416836 |
| Anti-human MICB AF488 (236511) | R&D systems | Cat#FAB1599G; RRID: AB_10973122 |
| Anti-human Ig Fc PE (97924) | R&D systems | Cat#FAB110P; RRID: N/A |
| Anti-human Vα24-Jα18 TCR FITC (6B11) | BioLegend | Cat#342906; RRID: AB_1731856 |
| Anti-human TCRγδ FITC (B1) | BioLegend | Cat#331207; RRID: AB_1575111 |
| Anti-human CD4 FITC (A161A1) | BioLegend | Cat#357406; RRID: AB_2562357 |
| Anti-human CD3 A700 (OKT3) | BioLegend | Cat#317340; RRID: AB_2563408 |
| Anti-human CD8 PEDazzle594 (RPA-T8) | BioLegend | Cat#301058; RRID: AB_2563570 |
| Anti-human NKG2A PECy7 (REA110) | Miltenyi Biotec | Cat#130-113-567; RRID: AB_2726172 |
| Anti-human PD-1 BV711 (EH12.2H7) | BioLegend | Cat#329928; RRID: AB_2562911 |
| Anti-human CD45RA PE (HI100) | BioLegend | Cat#304108; RRID: AB_314412 |
| Anti-human CCR7 BV605 (G043H7) | BioLegend | Cat#353224; RRID: AB_2561753 |
| Anti-human DNAM1 (DX11) | ThermoFisher Scientific | Cat#MA5-28149; RRID: AB_2745129 |
| Anti-human NKG2D (ON72) | Gift from E.Marcenaro | N/A |
| Anti-human NKp30 (F252) | Gift from D. Pende, IRCCS, Ospedale Policlinico San Martino, Genova, Italy | N/A |
| Anti-human NKp46 (KL247) | Gift from S. Parolini, Universiry of Brescia, Brescia, Italy | N/A |
| Mouse IgG1, κ Isotype control (MG1-45) | BioLegend | Cat#401402; RRID: AB_2801451 |
| Mouse IgM, κ Isotype control (MM-30) | BioLegend | Cat#401602; RRID: N/A |
| Anti-human CD45 89Y (HI30) | Fluidigm | Cat#3089003B; RRID: AB_2661851 |
| Anti-human HLA-DR (L243) | BioLegend | Cat#307602; RRID: AB_314680 |
| Anti-human Granzyme A (CB9) | BioLegend | Cat#507202; RRID: AB_315468 |
| Anti-human CD38 (REA671) | Miltenyi Biotec | Cat#130-122-288; RRID: AB_2801869 |
| Anti-human TCRγδ (REA591) | Miltenyi Biotec | Cat#130-122-291; RRID: AB_2801872 |
| Anti-human IFN-γ (B27) | BioLegend | Cat#506502; RRID: AB_315435 |
| Anti-human CD57 (REA769) | Miltenyi Biotec | Cat#130-124-525; RRID: AB_2819660 |
| Anti-human SLAMF6 (NT-7) | BioLegend | Cat#317202; RRID: AB_571931 |
| Anti-human CD4 (RPA-T4) | BioLegend | Cat#300502; RRID: AB_314070 |
| Anti-human CD14 (M5E2) | BioLegend | Cat#301802; RRID: AB_314184 |
| Anti-human CD19 142Nd (HIB19) | Fluidigm | Cat#3142001B; RRID: AB_2651155 |
| Anti-human Vα24-Jα18 TCR (6B11) | BioLegend | Cat#342908; RRID: AB_1731848 |
| Anti-human CD45RA 143Nd (HI100) | Fluidigm | Cat#3143006B; RRID: AB_2651156 |
| Anti-human CD69 144Nd (FN50) | Fluidigm | Cat#3144018B; RRID: AB_2687849 |
| Anti-human CD122 (TU27) | BioLegend | Cat#339002; RRID: AB_1501059 |
| Anti-human NKG2D (REA797) | Miltenyi Biotec | Cat#130-122-332; RRID: AB_2801911 |
| Anti-human CD8a 146Nd (RPA-T8) | Fluidigm | Cat#3146001B; RRID: AB_2687641 |
| Anti-human CD107a (REA792) | Miltenyi Biotec | Cat#130-124-536; RRID: AB_2819666 |
| Anti-human CCR7 (REA546) | Miltenyi Biotec | Cat#130-122-300; RRID: AB_2801881 |
| Anti-human CTLA-4 (14D3) | ThermoFisher Scientific | Cat#14-1529-82; RRID: AB_467512 |
| Anti-human IL-2 (MQ1-17H12) | BioLegend | Cat#500302; RRID: AB_315089 |
| Anti-human TCF-1 (7F11A10) | BioLegend | Cat#655202; RRID: AB_2562103 |
| Anti-human TNF-α 152Sm (Mab11) | Fluidigm | Cat#3152002B; RRID: N/A |
| Anti-human PD1 (EH12.2H7) | BioLegend | Cat#329902; RRID: AB_940488 |
| Anti-human CXCR5 (RF8B2) | BD Biosciences | Cat#564625; RRID: AB_2662090 |
| Anti-human NKp46 (REA808) | Miltenyi Biotec | Cat#130-124-522; RRID: AB_2811677 |
| Anti-human Tim-3 (REA635) | Miltenyi Biotec | Cat#130-122-333; RRID: AB_2801912 |
| Anti-human KIR2DL1 (REA284) | Miltenyi Biotec | Cat#130-122-279; RRID: AB_2801860 |
| Anti-human CD49a (REA1106) | Miltenyi Biotec | Cat#130-126-482; RRID: AB_2889592 |
| Anti-human CD56 (REA196) | Miltenyi Biotec | Cat#130-108-016; RRID: AB_2658728 |
| Anti-human CD39 160Gd (A1) | Fluidigm | Cat#3160004B; RRID: AB_2687648 |
| Anti-human NKG2A (REA110) | Miltenyi Biotec | Cat#130-122-329; RRID: AB_2801908 |
| Anti-human NKG2C (REA205) | Miltenyi Biotec | Cat#130-122-278; RRID: AB_2801859 |
| Anti-human EOMES (WD1928) | ThermoFisher Scientific | Cat#14-4877-82; RRID: AB_2572882 |
| Anti-human CD28 (REA612) | Miltenyi Biotec | Cat#130-122-350; RRID: AB_2811384 |
| Anti-human NKp30 (REA823) | Miltenyi Biotec | Custom |
| Anti-human Fas-L (REA1056) | Miltenyi Biotec | Cat#130-126-491; RRID: AB_2889479 |
| Anti-human IgG4 Fc (HP6025) | Southern Biotech | Cat#9200-09; RRID: AB_2796693 |
| Anti-human KIR2DL2/L3 (REA1006) | Miltenyi Biotec | Cat#130-122-346; RRID: AB_2819419 |
| Anti-human CD103 (REA803) | Miltenyi Biotec | Cat#130-122-303; RRID: AB_2801884 |
| Anti-human TRAIL (REA1113) | Miltenyi Biotec | Cat#130-126-490; RRID: AB_2889522 |
| Anti-human Ki-67 168Er (B56) | Fluidigm | Cat#3168007B; RRID: AB_2800467 |
| Anti-human T-bet (REA102) | Miltenyi Biotec | Cat#130-122-287; RRID: AB_2801868 |
| Anti-human CD3 170Er (UCHT1) | Fluidigm | Cat#3170001B; RRID: AB_2811085 |
| Anti-human XCL1 (109001) | R&D systems | Cat#MAB6951; RRID: AB_2217055 |
| Anti-human Perforin (REA1061) | Miltenyi Biotec | Cat#130-126-480; RRID: AB_2889728 |
| Anti-human/mouse Granzyme B 173Yb (GB11) | Fluidigm | Cat#3173006B; RRID: AB_2811095 |
| Anti-human/mouse TOX (REA473) | Miltenyi Biotec | Cat#130-126-455; RRID: AB_2889793 |
| Anti-human TIGIT (REA1004) | Miltenyi Biotec | Cat#130-122-310; RRID: AB_2801891 |
| Anti-human DNAM-1 (REA1040) | Miltenyi Biotec | Cat#130-126-485; RRID: AB_2889512 |
| Anti-human CD16 209Bi (3G8) | Fluidigm | Cat#3209002B; RRID: AB_2756431 |
| Anti-human CD3 (2GV6) | Ventana (Roche) | Cat# 05278422001 |
| Anti-human HLA-ABC (EMR8-5) | Abcam | Cat# ab70328 |
| Anti-human HLA-E (Mem-E/02) | Abcam | Cat# ab2216 |
| Anti-human EpCAM (polyclonal) | Abcam | Cat# ab71916 |
| Anti-human PD-L1 (2GV6) | Cell Signaling Technologies | Cat# 85164 |
| Anti-human PD-1 (EPR4877(2)) | Abcam | Cat# ab137132 |
| Anti-human NKG2A VioBright FITC (REA110) | Miltenyi Biotec | Cat# 130-114-094 |
| Anti-human NKp46 (8E5B) | Innate Pharma | N/A |
| Goat anti-mouse IgG Alexafluor 647 (polyclonal) | ThermoFisher | Cat# A32728 |
| Donkey anti-rabbit IgG Alexafluor 568 (polyclonal) | ThermoFisher | Cat# A10042 |
| Monalizumab | AstraZeneca | N/A |
| Chemicals, peptides, and recombinant proteins | ||
| Ficoll | Fisher Scientific | Cat#45-001-750 |
| DPBS, no calcium, no magnesium | Thermo Fischer Scientific | Cat# 14190-250 |
| RPMI-1640 Medium | Thermo Fischer Scientific | Cat#22400-089 |
| Fetal Bovine Serum (FBS) | Thermo Fischer Scientific | Cat#16000044 |
| 0.5M EDTA | Thermo Fischer Scientific | Cat#15575-020 |
| 16% Paraformaldehyde | Electron Microscopy Sciences | Cat#15710 |
| DMSO | Fisher scientific | Cat#D1391 |
| Recombinant Human NKp30 Fc Chimera Protein | R&D systems | Cat#1849-NK |
| Recombinant Human NKp44 Fc Chimera Protein | R&D systems | Cat#2249-NK |
| Recombinant Human NKp46 Fc Chimera Protein | R&D systems | Cat#1850-NK |
| Recombinant Human IL-12 p70 | Peprotech | Cat#200-12 |
| Recombinant Human IL-15 | Peprotech | Cat#200-15 |
| Recombinant Human IL-18 | MBL International | Cat#B001-5 |
| Discovery OMNIMAP anti-mouse HRP | Ventana Roche | Cat#760-4310 |
| Discovery OMNIMAP anti- rabbit HRP | Ventana Roche | Cat#760-4311 |
| Discovery OMNIMAP anti-mouse NP | Ventana Roche | Cat#780-4827 |
| Bovine Serum Albumin (BSA) | VWR chemicals | Cat#97061-420 |
| Xylene | Fisher Scientific | Cat# 22-050-283 |
| Ethanol (200 proof) | Fisher Scientific | Cat# MEX02764 |
| Goat serum | Millipore Sigma | Cat# S26-100ML |
| Donkey serum | Millipore Sigma | Cat# S30-100ML |
| Fluorescence mounting medium | Agilent Dako | Cat# S3023 |
| Heparin sodium salt | Sigma Aldrich | Cat#H3393 |
| Saponin | Sigma Aldrich | Cat#47036 |
| Osmium tetroxide | ACROS Organics | Cat#191181000 |
| Critical commercial assays | ||
| Human tumor dissociation kit | Miltenyi Biotec | Cat#130-095-929 |
| DNeasy Blood & Tissue Kit | Qiagen | Cat#69506 |
| Viobility dye 488/520 | Miltenyi Biotec | Cat#130-110-207 |
| Zombie NIR™ Fixable Viability Kit | BioLegend | Cat#423106 |
| Dynabeads Human T-Activator CD3/CD28 | ThermoFisher | Cat#11131D |
| EasySep™ Human CD45 Depletion Kit II | Stemcell Technologies | Cat#17898 |
| EasySep™ Release Human CD3 Positive Selection Kit | Stemcell Technologies | Cat#17751 |
| EasySep™ Human CD4 Positive Selection Kit II | Stemcell Technologies | Cat#17852 |
| Brefeldin A | BioLegend | Cat#420601 |
| Monensin | BioLegend | Cat#420701 |
| Cell-ID™ IdU | Fluidigm | Cat#201127 |
| Cell-ID™ Intercalator-Rh (Rh103) | Fluidigm | Cat#201103A |
| Human TruStain FcX™ (Fc-blocking reagent) | BioLegend | Cat#422302 |
| Foxp3/Transcription Factor Staining Buffer Set | eBioscience | Cat#00-5523-00 |
| Maxpar® 10X Barcode Perm Buffer | Fluidigm | Cat#201057 |
| Cell-ID 20-Plex Pd Barcoding Kit | Fluidigm | Cat#201060 |
| Cell-ID™ Intercalator-Ir 125 μM | Fluidigm | Cat#201192A |
| Maxpar X8 Multimetal Labeling | Fluidigm | Cat#201300 |
| Maxpar MCP9 Antibody Labeling Kit, 111Cd | Fluidigm | Cat#201111A |
| Maxpar MCP9 Antibody Labeling Kit, 112Cd | Fluidigm | Cat#201112A |
| Maxpar MCP9 Antibody Labeling Kit, 113Cd | Fluidigm | Cat#201113A |
| Maxpar MCP9 Antibody Labeling Kit, 114Cd | Fluidigm | Cat#201114A |
| Maxpar MCP9 Antibody Labeling Kit, 116Cd | Fluidigm | Cat#201116A |
| Maxpar Cell acquisition solution | Fluidigm | Cat#201240 |
| EQ™ Four Element Calibration Beads | Fluidigm | Cat#201078 |
| Discovery Purple kit | Ventana Roche | Cat#760-229 |
| Discovery Teal kit | Ventana Roche | Cat#760-247 |
| Discovery Yellow kit | Ventana Roche | Cat#760-239 |
| Deposited data | ||
| Single-cell RNA sequencing data, deposited on Mendeley | N/A | DOI 10.17632/7yb7s9769c.1 |
| Experimental models: Cell lines | ||
| K562 | Gift from D. Bhattacharya | N/A |
| HLA-E+ K562 | Gift from D. Bhattacharya | N/A |
| 253J | Provided by J. Sfakianos | RRID: CVCL_7935 |
| 639V | Provided by J. Sfakianos | RRID: CVCL_1048 |
| 5637 | Provided by J. Sfakianos | RRID: CVCL_0126 |
| J82 | Provided by J. Sfakianos | RRID: CVCL_0359 |
| KU-19-19 | Provided by J. Sfakianos | RRID: CVCL_1344 |
| MGHU3 | Provided by J. Sfakianos | RRID: CVCL_9827 |
| RT4 | Provided by J. Sfakianos | RRID: CVCL_0036 |
| RT112 | Provided by J. Sfakianos | RRID: CVCL_1670 |
| SW1710 | Provided by J. Sfakianos | RRID: CVCL_1721 |
| T24 | Provided by J. Sfakianos | RRID: CVCL_0554 |
| UMUC3 | Provided by J. Sfakianos | RRID: CVCL_1783 |
| Software and algorithms | ||
| GraphPad Prism Software v9.0.0 | GraphPad Software, Inc. | https://www.graphpad.com/ |
| Cytobank | Beckman Coulter | https://cytobank.org/ |
| Velocyto v0.17.16 | Aissa, 2021 | https://velocyto.org/velocyto.py/install/index.html |
| scVelo v0.2.4 | Bergen, 2020 | http://scvelo.readthedocs.io/ |
| CellRank v1.5.1 | Lange, 2022 | https://cellrank.readthedocs.io/ |
| CellRanger v3.0.0 | 10x Genomics | https://github.com/10XGenomics/cellranger |
| R v3.6.0, v4.0.5 | R Core Team, 2016 | https://www.R-project.org/ |
| Seurat v4.0.1 | Butler, 2021 | https://cran.r-project.org/web/packages/Seurat/Seurat.pdf |
| Survival v3.2.11 | Therneau, 2021 | https://rdrr.io/cran/survival/ |
| Survminer v0.4.9 | Kassambara, 2021 | https://cran.r-project.org/web/packages/survminer/index.html |
| ggplot2 v3.3.3 | Wickham, 2009 | https://cran.r-project.org/web/packages/ggplot2/index.html |
| Cytofkit v1.11.3 | Chen, 2018 | https://github.com/JinmiaoChenLab/cytofkit |
| CytoTree v1.0.3 | Dai, 2020 | https://github.com/JhuangLab/CytoTree |
| Ggraph v2.0.5 | Kolde, 2018 | https://cran.r-project.org/web/packages/ggraph/index.html |
| Pheatmap v.1.0.12 | Kolde, 2019 | https://cran.r-project.org/web/packages/pheatmap/index.html |
Highlights.
NKG2A associates with better survival and response to anti-PD-L1 in bladder cancer.
NKG2A is upregulated after PD-1 is acquired on tumor-infiltrated CD8+ T cells.
NKG2A+ CD8+ T cells react to HLA-ABC-deficient tumors with innate-like function.
NKG2A blockade enhances TCR-independent cytotoxicity by CD8+ T cells.
ACKNOWLEDGMENTS
We thank Miriam Merad (Precision Immunology Institute, Icahn School of Medicine at Mount Sinai) for critically reviewing the manuscript; Deepta Bhattacharya (University of Arizona) for kindly providing HLA-E+ K562 tumors; Mary Anne O’Donnell for critical review of manuscript. We acknowledge the expertise and assistance of the Dean’s Flow Cytometry Center of Research Excellence at Mount Sinai. HLA genotyping was funded in whole or in part in Mary Carrington’s lab with federal funds from the Frederick National Laboratory for Cancer Research, under Contract No.HHSN261200800001E, and was supported in part by the Intramural Research Program of the NIH, Frederick National Lab, Center for Cancer Research. The content of this publication does not necessarily reflect the views or policies of the Department of Health and Human Services, nor does mention of trade names, commercial products, or organizations imply endorsement by the U.S. Government. NKG2D, NKp30, and NKp46 blocking antibodies were provided by the E.M. lab, and the work was supported by Compagnia di San Paolo (2019.866) and Fondazione Associazione Italiana per la Ricerca sul Cancro (AIRC IG2021–ID26037). The N.B. lab was supported by funding from the Department of Defense Peer Review Cancer Research program Translational team Award No. W81XWH1910269 and from the Parker Institute for Cancer Immunotherapy No.AGR-11611SOW1. The A.H. lab was supported by funding from P30CA196521 and RAI130760A. S.I is supported by the Loan Repayment Program, NCATS, NIH and T32 Training Program in Cancer Biology T32CA078207, NCI, NIH.
Footnotes
DECLARATION OF INTERESTS
L.W., R.P.S., and J.Z. are employees of Sema4. A.H. receives research funds from Zumutor Biologics and is on the advisory boards of HTG Molecular Diagnostics, Immunorizon, UroGen, and Takeda. N.B. is an extramural member of the Parker Institute for Cancer Immunotherapy, receives research funds from Regeneron, Harbor Biomedical, DC Prime, and Dragonfly Therapeutics and is on the advisory boards of Neon Therapeutics, Novartis, Avidea, Boehringer Ingelheim, Rome Therapeutics, Rubius Therapeutics, Roswell Park Comprehensive Cancer Center, BreakBio, Carisma Therapeutics, CureVac, Genotwin, BioNTech, Gilead Therapeutics, Tempest Therapeutics, and the Cancer Research Institute. A patent related to this work was filed to the United States Patent and Trademark Office (63/313,823).
Publisher's Disclaimer: This is a PDF file of an unedited manuscript that has been accepted for publication. As a service to our customers we are providing this early version of the manuscript. The manuscript will undergo copyediting, typesetting, and review of the resulting proof before it is published in its final form. Please note that during the production process errors may be discovered which could affect the content, and all legal disclaimers that apply to the journal pertain.
Publisher's Disclaimer: This is a PDF file of an article that has undergone enhancements after acceptance, such as the addition of a cover page and metadata, and formatting for readability, but it is not yet the definitive version of record. This version will undergo additional copyediting, typesetting and review before it is published in its final form, but we are providing this version to give early visibility of the article. Please note that, during the production process, errors may be discovered which could affect the content, and all legal disclaimers that apply to the journal pertain
REFERENCES
- André P, Denis C, Soulas C, Bourbon-Caillet C, Lopez J, Arnoux T, Bléry M, Bonnafous C, Gauthier L, Morel A, et al. (2018). Anti-NKG2A mAb Is a Checkpoint Inhibitor that Promotes Anti-tumor Immunity by Unleashing Both T and NK Cells. Cell 175, 1731–1743.e1713. [DOI] [PMC free article] [PubMed] [Google Scholar]
- Aramburu J, Balboa MA, Ramírez A, Silva A, Acevedo A, Sánchez-Madrid F, De Landázuri MO, López-Botet M (1990). A novel functional cell surface dimer (Kp43) expressed by natural killer cells and I cell receptor-gamma/delta+ T lymphocytes. I. Inhibition of the IL-2-dependent proliferation by anti-Kp43 monoclonal antibody. J Immunol 144, 3238–3247. [PubMed] [Google Scholar]
- Bajorin DF, Witjes JA, Gschwend JE, Schenker M, Valderrama BP, Tomita Y, Bamias A, Lebret T, Shariat SF, Park SH, et al. (2021). Adjuvant Nivolumab versus Placebo in Muscle-Invasive Urothelial Carcinoma. N Engl J Med 384, 2102–2114. [DOI] [PMC free article] [PubMed] [Google Scholar]
- Banchereau R, Chitre AS, Scherl A, Wu TD, Patil NS, de Almeida P, Kadel Iii EE, Madireddi S, Au-Yeung A, Takahashi C, et al. (2021). Intratumoral CD103+ CD8+ T cells predict response to PD-L1 blockade. J Immunother Cancer 9. [DOI] [PMC free article] [PubMed] [Google Scholar]
- Banta KL, Xu X, Chitre AS, Au-Yeung A, Takahashi C, O’Gorman WE, Wu TD, Mittman S, Cubas R, Comps-Agrar L, et al. (2022). Mechanistic convergence of the TIGIT and PD-1 inhibitory pathways necessitates co-blockade to optimize anti-tumor CD8(+) T cell responses. Immunity 55, 512–526 e519. [DOI] [PMC free article] [PubMed] [Google Scholar]
- Bergen V, Lange M, Peidli S, Wolf FA, and Theis FJ (2020). Generalizing RNA velocity to transient cell states through dynamical modeling. Nat Biotechnol 38, 1408–1414. [DOI] [PubMed] [Google Scholar]
- Bertone S, Schiavetti F, Bellomo R, Vitale C, Ponte M, Moretta L, Mingari MC (2006). Transforming growth factor- I -induced expression of CD94/NKG2A inhibitory receptors in human T lymphocytes. European Journal of Immunology 29, 23–29. [DOI] [PubMed] [Google Scholar]
- Borst L, Sluijter M, Sturm G, Charoentong P, Santegoets SJ, van Gulijk M, van Elsas MJ, Groeneveldt C, van Montfoort N, Finotello F, et al. (2022). NKG2A is a late immune checkpoint on CD8 T cells and marks repeated stimulation and cell division. Int J Cancer 150, 688–704. [DOI] [PMC free article] [PubMed] [Google Scholar]
- Boussiotis VA (2016). Molecular and Biochemical Aspects of the PD-1 Checkpoint Pathway. N Engl J Med 375, 1767–1778. [DOI] [PMC free article] [PubMed] [Google Scholar]
- Boyington JC, Riaz AN,, Patamawenu A, Coligan JE,, and Brooks AG, Sun PD (1999). Structure of CD94 Reveals a Novel C-Type Lectin Fold: Implications for the NK Cell–Associated CD94/NKG2 Receptors. Immunity 10, 75–82. [DOI] [PubMed] [Google Scholar]
- Brooks AG, Posch PE, Scorzelli CJ, Borrego F, Coligan JE (1997). NKG2A Complexed with CD94 Defines a Novel Inhibitory Natural Killer Cell Receptor. Journal of Experimental Medicine 185, 795–800. [DOI] [PMC free article] [PubMed] [Google Scholar]
- Carretero M, Cantoni C, Bellh T, Bottino C,, Biassoni R, Rodriguez A, Perez-Villar JJ, Moretta L, Moretta A, and Lopez-Botet M (1997). The CD94 and NKG2-A C-type lectins covalently assemble to form a natural killer cell inhibitory receptor for HLA class I molecules. European Journal of Immunology 27, 563–567. [DOI] [PubMed] [Google Scholar]
- Chao J, Fuchs CS, Shitara K, Tabernero J, Muro K, Van Cutsem E, Bang YJ, De Vita F, Landers G, Yen CJ, et al. (2021). Assessment of Pembrolizumab Therapy for the Treatment of Microsatellite Instability-High Gastric or Gastroesophageal Junction Cancer Among Patients in the KEYNOTE-059, KEYNOTE-061, and KEYNOTE-062 Clinical Trials. JAMA Oncol 7, 895–902. [DOI] [PMC free article] [PubMed] [Google Scholar]
- Chou JP, Ramirez CM, Ryba DM, Koduri MP, and Effros RB (2014). Prostaglandin E2 promotes features of replicative senescence in chronically activated human CD8+ T cells. PLoS One 9, e99432. [DOI] [PMC free article] [PubMed] [Google Scholar]
- Cichocki F, and Miller JS (2019). Setting traps for NKG2A gives NK cell immunotherapy a fighting chance. J Clin Invest 129, 1839–1841. [DOI] [PMC free article] [PubMed] [Google Scholar]
- Cristescu R, Mogg R, Ayers M, Albright A, Murphy E, Yearley J, Sher X, Liu XQ, Lu H, Nebozhyn M, et al. (2018). Pan-tumor genomic biomarkers for PD-1 checkpoint blockade-based immunotherapy. Science 362. [DOI] [PMC free article] [PubMed] [Google Scholar]
- Dai Y, Xu A, Li J, Wu L, Yu S, Chen J, Zhao W, Sun XJ, and Huang J (2021). CytoTree: an R/Bioconductor package for analysis and visualization of flow and mass cytometry data. BMC Bioinformatics 22, 138. [DOI] [PMC free article] [PubMed] [Google Scholar]
- Duhen T, Duhen R, Montler R, Moses J, Moudgil T, de Miranda NF, Goodall CP, Blair TC, Fox BA, McDermott JE, et al. (2018). Co-expression of CD39 and CD103 identifies tumor-reactive CD8 T cells in human solid tumors. Nat Commun 9, 2724. [DOI] [PMC free article] [PubMed] [Google Scholar]
- Fares CM, Van Allen EM, Drake CG, Allison JP, Hu-Lieskovan S (2019). Mechanisms of Resistance to Immune Checkpoint Blockade: Why Does Checkpoint Inhibitor Immunotherapy Not Work for All Patients? Am Soc Clin Oncol Educ Book 39, 147–164. [DOI] [PubMed] [Google Scholar]
- Finn RS, Qin S, Ikeda M, Galle PR, Ducreux M, Kim TY, Kudo M, Breder V, Merle P, Kaseb AO, et al. (2020). Atezolizumab plus Bevacizumab in Unresectable Hepatocellular Carcinoma. N Engl J Med 382, 1894–1905. [DOI] [PubMed] [Google Scholar]
- Franchini DM, Lanvin O, Tosolini M, Patras de Campaigno E, Cammas A, Pericart S, Scarlata CM, Lebras M, Rossi C, Ligat L, et al. (2019). Microtubule-Driven Stress Granule Dynamics Regulate Inhibitory Immune Checkpoint Expression in T Cells. Cell Rep 26, 94–107 e107. [DOI] [PubMed] [Google Scholar]
- Franciszkiewicz K, Le Floc’h A, Boutet M, Vergnon I, Schmitt A, and Mami-Chouaib F (2013). CD103 or LFA-1 engagement at the immune synapse between cytotoxic T cells and tumor cells promotes maturation and regulates T-cell effector functions. Cancer Res 73, 617–628. [DOI] [PubMed] [Google Scholar]
- Freud AG, Keller KA, Scoville SD, Mundy-Bosse BL, Cheng S, Youssef Y, Hughes T, Zhang X, Mo X, Porcu P, et al. (2016). NKp80 Defines a Critical Step during Human Natural Killer Cell Development. Cell Rep 16, 379–391. [DOI] [PMC free article] [PubMed] [Google Scholar]
- Galsky MD, Arija JÁA, Bamias A, Davis ID, De Santis M, Kikuchi E, Garcia-del-Muro X, De Giorgi U, Mencinger M, Izumi K, et al. (2020). Atezolizumab with or without chemotherapy in metastatic urothelial cancer (IMvigor130): a multicentre, randomised, placebo-controlled phase 3 trial. The Lancet 395, 1547–1557. [DOI] [PubMed] [Google Scholar]
- Garrido F, Aptsiauri N, Doorduijn EM, Garcia Lora AM, and van Hall T (2016). The urgent need to recover MHC class I in cancers for effective immunotherapy. Curr Opin Immunol 39, 44–51. [DOI] [PMC free article] [PubMed] [Google Scholar]
- Grasso CS, Giannakis M, Wells DK, Hamada T, Mu XJ, Quist M, Nowak JA, Nishihara R, Qian ZR, Inamura K, et al. (2018). Genetic Mechanisms of Immune Evasion in Colorectal Cancer. Cancer Discov 8, 730–749. [DOI] [PMC free article] [PubMed] [Google Scholar]
- Gunturi A, Berg RE, Crossley E, Murray S, and Forman J (2005). The role of TCR stimulation and TGF-beta in controlling the expression of CD94/NKG2A receptors on CD8 T cells. Eur J Immunol 35, 766–775. [DOI] [PubMed] [Google Scholar]
- Han HS, Jeong S, Kim H, Kim HD, Kim AR, Kwon M, Park SH, Woo CG, Kim HK, Lee KH, et al. (2021). TOX-expressing terminally exhausted tumor-infiltrating CD8(+) T cells are reinvigorated by co-blockade of PD-1 and TIGIT in bladder cancer. Cancer Lett 499, 137–147. [DOI] [PubMed] [Google Scholar]
- Hashimoto M, Kamphorst AO,Im SJ, Kissick HT, Pillai RN, Ramalingam SS, Araki K, Ahmed R (2018). CD8 T Cell Exhaustion inChronic Infection and Cancer: Opportunities for Interventions. The Annual Review of Medicine 69, 301–318. [DOI] [PubMed] [Google Scholar]
- Herbst R, Majem M, Barlesi F, Carcereny E, Chu Q, Monnet I, Sanchez-Hernandez A, Dakhil S, Camidge DR, Winzer L, Soo-Hoo Y, Cooper ZA, Kumar R, Bothos J, Aggarwal C, Martinez-Marti A. (2022). COAST: An Open-Label, Phase II, Multidrug Platform Study of Durvalumab Alone or in Combination With Oleclumab or Monalizumab in Patients With Unresectable, Stage III Non-Small-Cell Lung Cancer. Journal of clinical oncology. [DOI] [PubMed] [Google Scholar]
- Horowitz A, Djaoud Z, Nemat-Gorgani N, Blokhuis J, Hilton HG, Beziat V, Malmberg KJ, Norman PJ, Guethlein LA, and Parham P (2016). Class I HLA haplotypes form two schools that educate NK cells in different ways. Sci Immunol 1, eaag1672. [DOI] [PMC free article] [PubMed] [Google Scholar]
- Hudson WH, Gensheimer J, Hashimoto M, Wieland A, Valanparambil RM, Li P, Lin JX, Konieczny BT, Im SJ, Freeman GJ, et al. (2019). Proliferating Transitory T Cells with an Effector-like Transcriptional Signature Emerge from PD-1(+) Stem-like CD8(+) T Cells during Chronic Infection. Immunity 51, 1043–1058 e1044. [DOI] [PMC free article] [PubMed] [Google Scholar]
- Hui E, Cheung J, Zhu J, Su X, Taylor MJ, Wallweber HA, Sasmal DK, Huang J, Kim JM, Mellman I, Vale RD (2017). T cell costimulatory receptor CD28 is a primary target for PD-1-mediated inhibition. Science 355, 1428–1433. [DOI] [PMC free article] [PubMed] [Google Scholar]
- Im SJ, Hashimoto M, Gerner MY, Lee J, Kissick HT, Burger MC, Shan Q, Hale JS, Lee J, Nasti TH, et al. (2016). Defining CD8+ T cells that provide the proliferative burst after PD-1 therapy. Nature 537, 417–421. [DOI] [PMC free article] [PubMed] [Google Scholar]
- Kamphorst AO, Wieland A, Nasti T, Yang S, Zhang R, Barber DL, Konieczny BT, Daugherty CZ, Koenig L, Yu K, Sica GL,, Sharpe AH, Freeman GJ, Blazar BR, Turka LA, Owonikoko TK, Pillai RN, Ramalingam SS, Araki K, Ahmed R (2017). Rescue of exhausted CD8 T cells by PD-1–targeted therapies is CD28-dependent. Science 355, 1423–1427. [DOI] [PMC free article] [PubMed] [Google Scholar]
- Kim J, Shariat SF, Kim IY, Menesses-Diaz A, Tokunaga H, Wheeler TM, Lerner SP (2001). Predictive value of expression of transforming growth factor-beta(1) and its receptors in transitional cell carcinoma of the urinary bladder. Cancer 6, 1475–1483. [DOI] [PubMed] [Google Scholar]
- Kovatch P, Gai L, Cho HM, Fluder E, and Jiang D (2020). Optimizing High-Performance Computing Systems for Biomedical Workloads. IEEE Int Symp Parallel Distrib Process Workshops Phd Forum 2020, 183–192. [DOI] [PMC free article] [PubMed] [Google Scholar]
- La Manno G, Soldatov R, Zeisel A, Braun E, Hochgerner H, Petukhov V, Lidschreiber K, Kastriti ME, Lonnerberg P, Furlan A, et al. (2018). RNA velocity of single cells. Nature 560, 494–498. [DOI] [PMC free article] [PubMed] [Google Scholar]
- Lange M, Bergen V, Klein M, Setty M, Reuter B, Bakhti M, Lickert H, Ansari M, Schniering J, Schiller HB, et al. (2022). CellRank for directed single-cell fate mapping. Nat Methods 19, 159–170. [DOI] [PMC free article] [PubMed] [Google Scholar]
- Lee JH, Shklovskaya E, Lim SY, Carlino MS, Menzies AM, Stewart A, Pedersen B, Irvine M, Alavi S, Yang JYH, et al. (2020). Transcriptional downregulation of MHC class I and melanoma de- differentiation in resistance to PD-1 inhibition. Nat Commun 11, 1897. [DOI] [PMC free article] [PubMed] [Google Scholar]
- Li H, Handsaker B, Wysoker A, Fennell T, Ruan J, Homer N, Marth G, Abecasis G, Durbin R, and Genome Project Data Processing S (2009). The Sequence Alignment/Map format and SAMtools. Bioinformatics 25, 2078–2079. [DOI] [PMC free article] [PubMed] [Google Scholar]
- Li H, van der Leun AM, Yofe I, Lubling Y, Gelbard-Solodkin D, van Akkooi ACJ, van den Braber M, Rozeman EA, Haanen J, Blank CU, et al. (2019). Dysfunctional CD8 T Cells Form a Proliferative, Dynamically Regulated Compartment within Human Melanoma. Cell 176, 775–789 e718. [DOI] [PMC free article] [PubMed] [Google Scholar]
- McLane LM, Abdel-Hakeem MS, and Wherry EJ (2019). CD8 T Cell Exhaustion During Chronic Viral Infection and Cancer. Annu Rev Immunol 37, 457–495. [DOI] [PubMed] [Google Scholar]
- Mori T, Tanaka H, Suzuki S, Deguchi S, Yamakoshi Y, Yoshii M, Miki Y, Tamura T, Toyokawa T, Lee S, et al. (2021). Tertiary lymphoid structures show infiltration of effective tumor-resident T cells in gastric cancer. Cancer Sci 112, 1746–1757. [DOI] [PMC free article] [PubMed] [Google Scholar]
- Motzer RJ, Escudier B, George S, Hammers HJ, Srinivas S, Tykodi SS, Sosman JA, Plimack ER, Procopio G, McDermott DF, et al. (2020). Nivolumab versus everolimus in patients with advanced renal cell carcinoma: Updated results with long-term follow-up of the randomized, open-label, phase 3 CheckMate 025 trial. Cancer 126, 4156–4167. [DOI] [PMC free article] [PubMed] [Google Scholar]
- Nalin AP, Kowalski JJ, Sprague AC, Schumacher BK, Gerhardt AG, Youssef Y, Vedantam KV, Zhang X, Siebel CW, Mace EM, et al. (2020). Notch Regulates Innate Lymphoid Cell Plasticity during Human NK Cell Development. J Immunol 205, 2679–2693. [DOI] [PMC free article] [PubMed] [Google Scholar]
- Oh DY, Kwek SS, Raju SS, Li T, McCarthy E, Chow E, Aran D, Ilano A, Pai CS, Rancan C, et al. (2020). Intratumoral CD4(+) T Cells Mediate Anti-tumor Cytotoxicity in Human Bladder Cancer. Cell 181, 1612–1625 e1613. [DOI] [PMC free article] [PubMed] [Google Scholar]
- Park BV, Freeman ZT, Ghasemzadeh A, Chattergoon MA, Rutebemberwa A, Steigner J, Winter ME, Huynh TV, Sebald SM, Lee SJ, et al. (2016). TGFbeta1-Mediated SMAD3 Enhances PD-1 Expression on Antigen-Specific T Cells in Cancer. Cancer Discov 6, 1366–1381. [DOI] [PMC free article] [PubMed] [Google Scholar]
- Patel VG, Oh WK, and Galsky MD (2020). Treatment of muscle-invasive and advanced bladder cancer in 2020. CA Cancer J Clin 70, 404–423. [DOI] [PubMed] [Google Scholar]
- Pereira BI, Devine OP, Vukmanovic-Stejic M, Chambers ES, Subramanian P, Patel N, Virasami A, Sebire NJ, Kinsler V, Valdovinos A, et al. (2019). Senescent cells evade immune clearance via HLA-E-mediated NK and CD8+ T cell inhibition. Nature Communications 10, 2387. [DOI] [PMC free article] [PubMed] [Google Scholar]
- Ramsuran V, Naranbhai V, Horowitz A, Qi Y, Martin MP, Yuki Y, Gao X, Walker-Sperling V, Del Prete GQ, Schneider DK, et al. (2018). Elevated HLA-A expression impairs HIV control through inhibition of NKG2A-expressing cells. Science 359, 86–90. [DOI] [PMC free article] [PubMed] [Google Scholar]
- Ritter C, Fan K, Paschen A, Reker Hardrup S, Ferrone S, Nghiem P, Ugurel S, Schrama D, and Becker JC (2017). Epigenetic priming restores the HLA class-I antigen processing machinery expression in Merkel cell carcinoma. Sci Rep 7, 2290. [DOI] [PMC free article] [PubMed] [Google Scholar]
- Rittmeyer A, Barlesi F, Waterkamp D, Park K, Ciardiello F, von Pawel J, Gadgeel SM, Hida T, Kowalski DM, Dols MC, et al. (2017). Atezolizumab versus docetaxel in patients with previously treated non-small-cell lung cancer (OAK): a phase 3, open-label, multicentre randomised controlled trial. The Lancet 389, 255–265. [DOI] [PMC free article] [PubMed] [Google Scholar]
- Rosenberg JE, Hoffman-Censits J, Powles T, van der Heijden MS, Balar AV, Necchi A, Dawson N, O’Donnell PH, Balmanoukian A, Loriot Y, et al. (2016). Atezolizumab in patients with locally advanced and metastatic urothelial carcinoma who have progressed following treatment with platinum-based chemotherapy: a single-arm, multicentre, phase 2 trial. The Lancet 387, 1909–1920. [DOI] [PMC free article] [PubMed] [Google Scholar]
- Schmid P, Cortes J, Pusztai L, McArthur H, Kummel S, Bergh J, Denkert C, Park YH, Hui R, Harbeck N, et al. (2020). Pembrolizumab for Early Triple-Negative Breast Cancer. N Engl J Med 382, 810–821. [DOI] [PubMed] [Google Scholar]
- Shen R, and Seshan VE (2016). FACETS: allele-specific copy number and clonal heterogeneity analysis tool for high-throughput DNA sequencing. Nucleic Acids Res 44, e131. [DOI] [PMC free article] [PubMed] [Google Scholar]
- Speiser DE, Pittet MJ, Valmori D, Dunbar R, Rimoldi D, Liénard D, MacDonald HR, Cerottini J-C, Cerundolo V, Romero P (1999). In Vivo Expression of Natural Killer Cell Inhibitory Receptors by Human Melanoma–specific Cytolytic T Lymphocytes. Journal of Experimental Medicine 190, 775–782. [DOI] [PMC free article] [PubMed] [Google Scholar]
- Sutton VR, Brennan AJ, Ellis S, Danne J, Thia K, Jenkins MR, Voskoboinik I, Pejler G, Johnstone RW, Andrews DM, et al. (2016). Serglycin determines secretory granule repertoire and regulates natural killer cell and cytotoxic T lymphocyte cytotoxicity. FEBS J 283, 947–961. [DOI] [PubMed] [Google Scholar]
- Thommen DS, and Schumacher TN (2018). T Cell Dysfunction in Cancer. Cancer Cell 33, 547–562. [DOI] [PMC free article] [PubMed] [Google Scholar]
- Topalian SL, Hodi FS, Brahmer JR, Gettinger SN, Smith DC, McDermott DF, Powderly JD, Sosman JA, Atkins MB, Leming PD, et al. (2019). Five-Year Survival and Correlates Among Patients With Advanced Melanoma, Renal Cell Carcinoma, or Non-Small Cell Lung Cancer Treated With Nivolumab. JAMA Oncol 5, 1411–1420. [DOI] [PMC free article] [PubMed] [Google Scholar]
- van Hall T, Andre P, Horowitz A, Ruan DF, Borst L, Zerbib R, Narni-Mancinelli E, van der Burg SH, and Vivier E (2019). Monalizumab: inhibiting the novel immune checkpoint NKG2A. J Immunother Cancer 7, 263. [DOI] [PMC free article] [PubMed] [Google Scholar]
- Wang B, Wu S, Zeng H, Liu Z, Dong W, He W, Chen X, Dong X, Zheng L, Lin T, et al. (2015). CD103+ Tumor Infiltrating Lymphocytes Predict a Favorable Prognosis in Urothelial Cell Carcinoma of the Bladder. J Urol 194, 556–562. [DOI] [PubMed] [Google Scholar]
- Wang L, Sfakianos JP, Beaumont KG, Akturk G, Horowitz A, Sebra RP, Farkas AM, Gnjatic S, Hake A, Izadmehr S, et al. (2021). Myeloid Cell-associated Resistance to PD-1/PD-L1 Blockade in Urothelial Cancer Revealed Through Bulk and Single-cell RNA Sequencing. Clin Cancer Res. [DOI] [PMC free article] [PubMed] [Google Scholar]
- Yokosuka T, Takamatsu M, Kobayashi-Imanishi W, Hashimoto-Tane A, Azuma M, and Saito T (2012). Programmed cell death 1 forms negative costimulatory microclusters that directly inhibit T cell receptor signaling by recruiting phosphatase SHP2. J Exp Med 209, 1201–1217. [DOI] [PMC free article] [PubMed] [Google Scholar]
- Zerbino DR, Frankish A, and Flicek P (2020). Progress, Challenges, and Surprises in Annotating the Human Genome. Annu Rev Genomics Hum Genet 21, 55–79. [DOI] [PMC free article] [PubMed] [Google Scholar]
Associated Data
This section collects any data citations, data availability statements, or supplementary materials included in this article.
Supplementary Materials
Table S2 Single-cell RNA sequencing cluster assignment, Related to Figure 2
Table S5 RNA velocity analysis, Related to Figure 5
Data Availability Statement
The single-cell RNA sequencing data generated in this article were deposited on Mendeley at DOI 10.17632/7yb7s9769c.1.