

Abstract
T-Box Brain Transcription Factor 1 (TBR1) plays essential roles in brain development, mediating neuronal migration, fate specification, and axon tract formation. While heterozygous loss-of-function and missense TBR1 mutations are associated with neurodevelopmental conditions, the effects of these heterogeneous mutations on brain development have yet to be fully explored. We characterized multiple mouse lines carrying Tbr1 mutations differing by type and exonic location, including the previously generated Tbr1 exon 2-3 knock-out (KO) line, and we analyzed male and female mice at neonatal and adult stages. The frameshift patient mutation A136PfsX80 (A136fs) caused reduced TBR1 protein in cortex similar to Tbr1 KO, while the missense patient mutation K228E caused significant TBR1 upregulation. Analysis of cortical layer formation found similar defects between KO and A136fs homozygotes in their CUX1+ and CTIP2+ layer positions, while K228E homozygosity produced layering defects distinct from these mutants. Meanwhile, the examination of cortical apoptosis found extensive cell death in KO homozygotes but limited cell death in A136fs or K228E homozygotes. Despite their discordant cortical phenotypes, these Tbr1 mutations produced several congruent phenotypes, including anterior commissure reduction in heterozygotes, which was previously observed in humans with TBR1 mutations. These results indicate that patient-specific Tbr1 mutant mice will be valuable translational models for pinpointing shared and distinct etiologies among patients with TBR1-related developmental conditions.
SIGNIFICANCE STATEMENT Mutations of the TBR1 gene increase the likelihood of neurodevelopmental conditions such as intellectual disability and autism. Therefore, the study of TBR1 can offer insights into the biological mechanisms underlying these conditions, which affect millions worldwide. To improve the modeling of TBR1-related conditions over current Tbr1 knock-out mice, we created mouse lines carrying Tbr1 mutations identical to those found in human patients. Mice with one mutant Tbr1 copy show reduced amygdalar connections regardless of mutation type, suggesting a core biomarker for TBR1-related disorders. In mice with two mutant Tbr1 copies, brain phenotypes diverge by mutation type, suggesting differences in Tbr1 gene functionality in different patients. These mouse models will serve as valuable tools for understanding genotype–phenotype relationships among patients with neurodevelopmental conditions.
Keywords: autism, cortex, developmental biology, genetics, mouse, TBR1
Introduction
Neurodevelopmental conditions such as developmental delay (DD), intellectual disability (ID), and autism impact numerous individuals and their caretakers worldwide (American Psychiatric Association, 2013). These conditions are highly heritable, yet their genetic architectures encompass a vast allelic spectrum and pleiotropic effects of multiple loci (Iakoucheva et al., 2019; Lee et al., 2019). A large contributor to the likelihood of these conditions is de novo mutations, accounting for 30–50% of cases (Hamdan et al., 2014; Iossifov et al., 2014; McRae et al., 2017; Yoon et al., 2021). Such mutations are informative for understanding their biological mechanisms, as they typically induce large phenotypic effect sizes and impact single genes.
TBR1 (T-Box Brain Transcription factor 1) was among the first genes linked to ID and/or autism via de novo mutations (Neale et al., 2012; O'Roak et al., 2012a,b, 2014). Over 100 variants impacting TBR1 have been reported in ClinVar, and TBR1 is highly intolerant to both loss-of-function and missense mutations (Landrum et al., 2018; Karczewski et al., 2020). Accordingly, no biallelic TBR1 mutations have been identified in humans, and Tbr1–/– mice die perinatally (Bulfone et al., 1998; Nambot et al., 2020). The spatiotemporal expression of TBR1 in human brain places it at the center of an autism-associated gene network specific to mid-fetal glutamatergic cortical neurons (Willsey et al., 2013). During the equivalent period in mouse cortex, TBR1 directly regulates the transcription of other high-confidence autism-associated genes (Notwell et al., 2016). Tbr1 is expressed in several early-born neuronal populations essential for proper mouse corticogenesis, and complete genetic knock-out (KO) consequently impairs cortical lamination, cell survival, neuronal fate acquisition, and axon tract formation (Hevner et al., 2001; Bedogni et al., 2010; Han et al., 2011; McKenna et al., 2011).
Individuals with de novo TBR1 mutations exhibit moderate-to-severe DD/ID, speech delays, autism or autistic traits, and aggression (McDermott et al., 2018; Nambot et al., 2020). Over half of patients examined by MRI showed anterior commissure (AC) reduction, hippocampal dysplasia, and/or cortical malformations (Vegas et al., 2018; Nambot et al., 2020). Likewise, heterozygous Tbr1 knock-out mice (Tbr1+/–) modeling human TBR1 haploinsufficiency showed anterior commissure reduction, cognitive impairment, and reduced social interaction (Huang et al., 2014). Mouse models in which Tbr1 was conditionally deleted (Tbr1cKO) from cortical deep-layer glutamatergic neurons also showed reduced social interaction or increased aggression (Fazel Darbandi et al., 2018, 2020). While both Tbr1+/– and Tbr1cKO models showed congruent defects in dendritic spine density, Tbr1cKO models may have limited clinical translatability because of the delayed deletion of Tbr1 several days after its initial expression. Moreover, Tbr1 deletion models do not capture the allelic heterogeneity of human TBR1 mutations, and in vitro studies indicate that mutant TBR1 proteins differ in their stability, transcriptional activity, localization, and cofactor binding (Deriziotis et al., 2014; den Hoed et al., 2018).
Mice harboring the K228E patient mutation in the T-box of TBR1 were recently generated and characterized (Yook et al., 2019). In contrast to Tbr1 deletion mutants, K228E mutants showed elevated levels of TBR1 protein, and the mutant K228E protein exhibited decreased DNA affinity and increased structural stability in vitro. Moreover, K228E mutants showed altered anxiety-like and social behaviors, which were accompanied by transcriptional dysregulation, displacement of parvalbumin (PV)-positive interneurons, and increased inhibitory synaptic transmission in the cortex. However, the degree of functionality of the mutant allele remains unclear, as do its effects on other Tbr1-regulated processes such as axon tract formation and cell survival.
Here, we independently generated Tbr1 mutant mice with the K228E mutation, as well as mice with the early-truncating frameshift patient mutation A136PfsX80 (A136fs). We also characterized an in-frame Tbr1 deletion line (p.E348_P353del or Δ6aa) encompassing five reported human TBR1 variants in the T-box. With the Tbr1 exon 2-3 knockout as a comparison (Bulfone et al., 1998), we used molecular, histologic, and genetic approaches to determine the impacts of these mutations on Tbr1 expression and cortical development.
Materials and Methods
Experimental design and statistical analysis.
Mice of each sex were used for all experiments. For molecular and histologic experiments, mice were analyzed at postnatal day 0 (P0) or adulthood (9–39 weeks). For weight and behavior assessments, mice were analyzed at P4, P7, P10, and P14. Cohorts for each experiment were composed of littermate wild-type (WT) and mutant mice from at least two independent litters. For Western blot and quantitative PCR (qPCR) experiments, at least three mice/genotype/line were analyzed. For histologic experiments, at least two mice/genotype/line were analyzed. Data plotting and statistical tests were performed using Prism 9 (GraphPad Software). Data are represented as the mean ± SEM or as violin plots. Each dot represents one animal where applicable. Analyses between two groups were performed using unpaired t tests. Analyses among three groups were performed using one-way ANOVA with Tukey's multiple-comparisons test or two-way ANOVA with Šidák's multiple-comparisons test. Analysis of postnatal weight and motor assessment was performed using two-way repeated-measures ANOVA with Šidák's multiple-comparisons test. Analysis of cumulative interneuron distribution was performed using Kolmogorov–Smirnov tests. Significance was defined as p < 0.05.
Animals.
All animal procedures were approved by Oregon Health & Science University Institutional Animal Care and Use Committee. Tbr1KO mice (Bulfone et al., 1998) were rederived from cryopreserved sperm obtained from MMRRC (Mutant Mouse Resource & Research Centers) at the University of California, Davis (catalog #030263-UCD) and backcrossed to a C57BL/6 background for at least two generations before data collection. Tbr1A136PfsX80 (abbreviated to Tbr1A136fs), Tbr1K228E, and Tbr1Δ6aa mice were generated on a C57BL/6NJ background and backcrossed to C57BL/6NJ for at least two generations before data collection. Tbr1KO mice were PCR genotyped using primers amplifying genomic Tbr1 and the neomycin (neo) cassette. Tbr1A136fs and Tbr1K228E mice were genotyped using PCR amplification of the mutation-containing genomic region followed by restriction enzyme digest of the PCR product (BtsCI for A136fs, BtsIMutI for K228E, New England Biolabs). Tbr1Δ6aa mice were PCR genotyped using primers amplifying genomic Tbr1 (Extended Data Fig. 1-2, primer sequences). Mice were group housed under a 12 h light/dark cycle and given ad libitum access to food and water.
CRISPR generation of mouse lines.
CRISPR synthetic guide RNA (sgRNA) design to generate Tbr1A136fs, Tbr1K228E, and Tbr1Δ6aa founders was performed using the CRISPOR tool (http://crispor.tefor.net/; Concordet and Haeussler, 2018). The generation of mutant mice was performed by the Oregon Health & Science University Transgenic Mouse Models Core based on published methods (Aida et al., 2015). C57BL/6NJ zygotes were coinjected with Cas9 protein (50 ng/µl; New England Biolabs) or Cas9 mRNA (1000 ng/µl; TriLink BioTechnologies), sgRNA (30 ng/µl; Synthego), and single-stranded-oligodeoxynucleotide (ssODN) donor (100 ng/µl; Integrated DNA Technologies) containing the patient mutation. Embryos were transplanted into pseudopregnant recipient female CD-1 mice, and founders from these litters were identified via Sanger sequencing (Extended Data Fig. 1-2, sgRNA, ssODN donor, and Sanger primer sequences).
Western blotting.
Cortex was dissected at P0 or adulthood (10–39 weeks), flash frozen, and stored at −80°C until all samples were collected. Frozen tissue from one cortical hemisphere per mouse (∼30 mg at P0, ∼100 mg at adulthood) was dounce homogenized in ice-cold RIPA buffer (150 mm NaCl, 1% IGEPAL CA-630, 0.5% sodium deoxycholate, 0.1% SDS, 50 mm Tris-HCl pH 8.0, 2 mm EDTA pH 8.0) containing Protease Inhibitor Cocktail (Roche). Nuclei were lysed using a probe sonicator (model XL-2000, Misonix) at setting 6 with 5–10 s ON/20 s OFF intervals until the lysate was clear (two rounds for P0, four to five rounds for adult). Lysates were further incubated on ice for 30 min then centrifuged at 10,000 relative centrifugal force for 10 min at 4°C to remove debris. Protein concentrations were determined using the Pierce BCA Protein Assay Kit (Thermo Fisher Scientific). Alfa Aesar Laemmli SDS sample buffer (Thermo Fisher Scientific) was added to lysates, which were boiled at 95°C for 5 min before SDS-PAGE. Total protein (30 µg/sample) was resolved on 4–15% polyacrylamide gels (BIO-RAD) and transferred to PVDF membranes. Membranes were incubated in block solution [5% milk in TBS with 0.1% Tween-20 (TBST)] for 1 h at room temperature (RT), incubated in primary antibodies in block solution overnight at 4°C, washed in TBST four times for 5 min each, incubated in secondary antibodies in block solution for 1 h at room temperature, washed in TBST four times for 5 min each, and imaged with an Odyssey CLx using Image Studio software (LI-COR). The following primary antibodies and dilutions were used: rabbit anti-TBR1 (1:1000; catalog #ab31940, Abcam); rabbit anti-β-Tubulin III (1:1000; catalog #T2200, Sigma-Aldrich). The following secondary antibody and dilution was used: donkey anti-rabbit IgG IRDye 800CW (1:10,000; catalog #926–32213, LI-COR). Western blot band intensities were measured using “Analyze > Gels” in ImageJ2/FIJI software (Rueden et al., 2017). Within each blot, each TBR1 band signal was normalized to its corresponding loading control signal, and then each normalized TBR1 signal was adjusted to the average normalized TBR1 signal across WT replicates.
Reverse transcription qPCR.
Cortex was dissected at P0, flash frozen, and stored at −80°C until all samples were collected. Frozen tissue from one cortical hemisphere (∼30 g) was lysed in 1 ml TRIzol Reagent (Thermo Fisher Scientific) and homogenized by passing through a 25 ga needle. Total RNA was extracted using the RNeasy Lipid Tissue Mini Kit (catalog #74804, QIAGEN) with on-column DNase digestion with RNase-Free DNase Set (catalog #79254, QIAGEN) according to the manufacturer protocols. cDNA was synthesized from 1 µg of total RNA using the ProtoScript II First Strand cDNA Synthesis Kit (catalog #E6560S, New England Biolabs) with oligo-dT priming according to the manufacturer protocol. cDNA templates and no RT controls were diluted 1:20 for multiplexed PrimeTime qPCR Assays using Tbr1 and Actb primers with FAM- and SUN-labeled probes, respectively (Integrated DNA Technologies). qPCR assays were run in duplicate or triplicate. Probe fluorescence was measured with a CFX Connect Real-Time PCR Detection System using CFX Manager Software (BIO-RAD) running the following cycling program: 95°C for 3 min, 40 cycles of 95°C for 15 s and 60°C for 1 min, and 4°C hold. qPCR primer efficiencies were measured using WT cortex cDNA for the standard curve (undiluted to 1:10,000) and fell within 90–110%. Ct values were obtained using the “single threshold” Cq Determination Mode in CFX Manager Software (BIO-RAD). After averaging across technical replicates for each sample, Tbr1 fold gene expression was calculated using the 2–ΔΔCt method with Actb as the reference gene and adjustment to the WT average within the respective experimental batch of each sample. For Sanger sequencing of Tbr1A136fs cortex cDNA, 1 µl of cDNA was used as the PCR template for M13 sequence-containing primers spanning exons 1 and 2, and purified PCR product was Sanger sequenced using M13-forward primer. Sanger sequencing traces were visualized using Sequencher software (Gene Codes Corporation; Extended Data Fig. 1-2, primer sequences).
Immunohistochemistry.
For P0 samples, whole brains were drop fixed in 4% electron microscopy (EM)-grade paraformaldehyde (PFA) overnight at 4°C, then washed in PBS. For adult samples (9–19 weeks), brains were fixed via transcardial perfusion with 10 ml of PBS and 10 ml of 4% PFA, followed by postfix in 4% PFA for 1 h at 4°C, followed by PBS wash. For cortical layering, interneuron, axon, and apoptosis marker immunohistochemistry (IHC), brains were embedded in 3% low-melting point (LMP) agarose and sectioned coronally or horizontally at 100 µm using a vibratome (model VT1200 S, Leica). Free-floating sections anterior to the hippocampus were incubated in primary antibodies in block solution (2% normal donkey serum, 0.2% Triton X-100 in PBS) for 48–72 h at 4°C, washed in PBS for ≥5 h, incubated in secondary antibodies and Hoechst stain 1:5000 in block solution overnight at 4°C, washed in PBS for ≥5 h, mounted onto glass slides, and coverslipped with Fluoromount-G (Southern Biotech). For TBR1/NeuN IHC in Tbr1K228E cortex, fixed brains were cryoprotected in 30% sucrose overnight at 4°C, washed in PBS, embedded in O.C.T. (optimal cutting temperature) Compound (Tissue-Tek), and sectioned coronally at 20 µm using a cryostat (model TN50, Tanner). Free-floating cryosections were incubated in primary antibodies in block solution overnight at 4°C, washed in PBS three times for 10 min each, incubated in secondary antibodies and Hoechst stain 1:5000 in block solution for 1 h at room temperature, washed in PBS three times for 10 min each, mounted onto glass slides, and coverslipped with Fluoromount-G (Southern Biotech). The following primary antibodies and dilutions were used: rabbit anti-cleaved caspase-3 (CC3; 1:500; model 9661, Cell Signaling Technology); rat anti-CTIP2 (1:500; catalog #ab18465, Abcam); rabbit anti-CDP/CUX1 (1:500; catalog #sc-13 024, Santa Cruz Biotechnology); rat anti-L1 (1:500; catalog #MAB5272, Millipore); mouse anti-NeuN (1:500; catalog #ab104224, Abcam); mouse anti-neurofilament/neurofilament M (NF-M; 1:500; catalog #2H3, Developmental Studies Hybridoma Bank); goat anti-parvalbumin (1:2000; catalog #PVG-213, Swant); rabbit anti-somatostatin (SST; 1:500; catalog #T-4103.0050, Peninsula Laboratories); and rabbit anti-TBR1 (1:500; catalog #AB10554, Millipore). The following secondary antibodies and dilutions were used: donkey anti-mouse IgG (H + L) Alexa Fluor 488 (1:500; catalog #A-21202, Thermo Fisher Scientific); donkey anti-rabbit IgG (H + L) Alexa Fluor 546 (1:500; catalog #A10040, Thermo Fisher Scientific); donkey anti-goat IgG (H + L) Alexa Fluor 647 (1:500; catalog #A-21447, Thermo Fisher Scientific); and donkey anti-rat IgG (H + L) Alexa Fluor 647 (1:500; catalog #712–605-153, Jackson ImmunoResearch).
Neonatal weight and motor assessments.
Weight measurements and negative geotaxis testing were performed at P4, P7, P10, and P14 as previously described (Hill et al., 2008). For negative geotaxis, each pup was placed with its head pointing downward on a 45° incline, and the latency for the pup to face upward on the incline was recorded. If the pup failed to turn within 60 s, or if the pup fell down the incline three times, the latency was recorded as 60 s.
DiI labeling.
P0 whole brains were drop-fixed in 4% EM-grade PFA for at least 24 h at 4°C, then washed in PBS. For corticothalamic labeling, DiI crystals (catalog #D3911, Thermo Fisher Scientific) were embedded in primary somatosensory (S1) cortex along the anteroposterior axis. For thalamocortical labeling, DiI crystals were embedded in thalamus after removal of hindbrain. Labeled brains were incubated in 4% PFA at 37°C until labeling was visible in the target brain regions or axon tracts (∼9 d). Brains were embedded in 3% LMP agarose and sectioned coronally at 150 µm using a vibratome (model VT1200 S, Leica). Sections were stained with Hoechst 1:5000 in PBS for 10 min, mounted onto glass slides, and coverslipped with Fluoromount-G (Southern Biotech).
Fluorescence image acquisition.
Images were acquired using ZEN Blue software (Zeiss). IHC sections were imaged on an upright microscope (model Axio Imager M2, Zeiss) equipped with an ApoTome2. For cortical layering, interneuron, and apoptosis IHC, z-stacks were obtained through the tissue section using the optimal interval for each objective. For axon IHC, images were obtained using Tile Scan mode and stitched using ZEN. DiI-labeled sections were imaged on a dissecting microscope (model Axio Zoom.V16, Zeiss).
Cortical layering analysis.
Cortical layering analyses were performed on z-projection images of coronal sections using ImageJ2/FIJI software. Equivalent background subtraction and brightness/contrast adjustments were applied to all images within an experiment. Images were rotated until layers in S1 were approximately horizontal, then a 1024 × 1800 pixel rectangle was drawn over S1 and rescaled to encompass layer 1 through subplate. Pixel intensities were averaged horizontally within the rectangular selection using “Analyze > Plot Profile,” and then these values were averaged into 100 equal bins from layer 1 through subplate (percentage of cortical distance). Binned values for each sample were minimum–maximum normalized using the minimum and maximum average bin values across WT replicates. For the binning of “percentage of cortical distance” into layers for CTIP2 fluorescence comparisons, the following bins were determined based on Hoechst fluorescence: L6, 0–35%; L5, 36–55%; L2–4, 56–100%.
Interneuron distribution analysis.
Interneuron distribution analyses were performed on z-projection images of coronal sections using ImageJ2/FIJI software. Equivalent background subtraction and binary thresholds were applied to all images within an experiment. Images were rotated until layers in S1 were approximately horizontal, then a rectangular region of interest (ROI) measuring a width of 1024 pixels × height measure in pixels of layer 1 through subplate was drawn over S1. Within this ROI, interneuron counts and x–y coordinates were obtained using “Measure > Analyze Particles” with equivalent particle size parameters for all images. These values were then used to determine the number of cells per ROI, the fraction of cells per bin (10 bins or 2 bins), and the cumulative density of cells along the ROI.
Apoptosis analysis.
Apoptosis analyses were performed on z-projection images of coronal sections using ImageJ2/FIJI software. Cells within one cortical hemisphere of one section per animal were manually counted using “Plugins > Analyze > Cell Counter.” Cortical area was calculated using the Polygon tool to manually select the ROI.
Results
Generation of Tbr1 mutant mouse lines
Using CRISPR/Cas9 genome editing (Aida et al., 2015), we generated the following three Tbr1 mouse lines: Tbr1A136fs (c.402del; p.A136PfsX80), Tbr1K228E (c.682A>G; p.K228E), and Tbr1Δ6aa (c.1042_1059del; p.E348_P353del; Fig. 1A). The sequence changes producing these predicted mutant proteins are identical between human and mouse. A136PfsX80 is an autism-associated frameshift mutation predicted to yield a truncated protein missing the T-box DNA-binding domain, while K228E is an autism-associated missense mutation within the T-box (O'Roak et al., 2012a,b). Both mutations impact highly conserved residues among vertebrates, and the residues following the frameshift of A136fs are conserved between human and mouse (Fig. 1B,C). The in-frame deletion mutant p.E348_P353del (Δ6aa) was generated through chance nonhomologous end joining during CRISPR editing intended to generate a different point mutation. This deletion is also located within the T-box and encompasses the following five reported human TBR1 variants in ClinVar and gnomAD: two nonsense mutations classified as pathogenic or likely pathogenic (S351X, Q352X); and three missense mutations of uncertain or conflicting significance (T350A, S351R, P353A; Extended Data Fig. 1-1; Landrum et al., 2018; Karczewski et al., 2020). Despite strong species conservation of residues 348–353, these residues fall within a poorly conserved site among mouse T-box family proteins (Fig. 1B,D).
Figure 1.
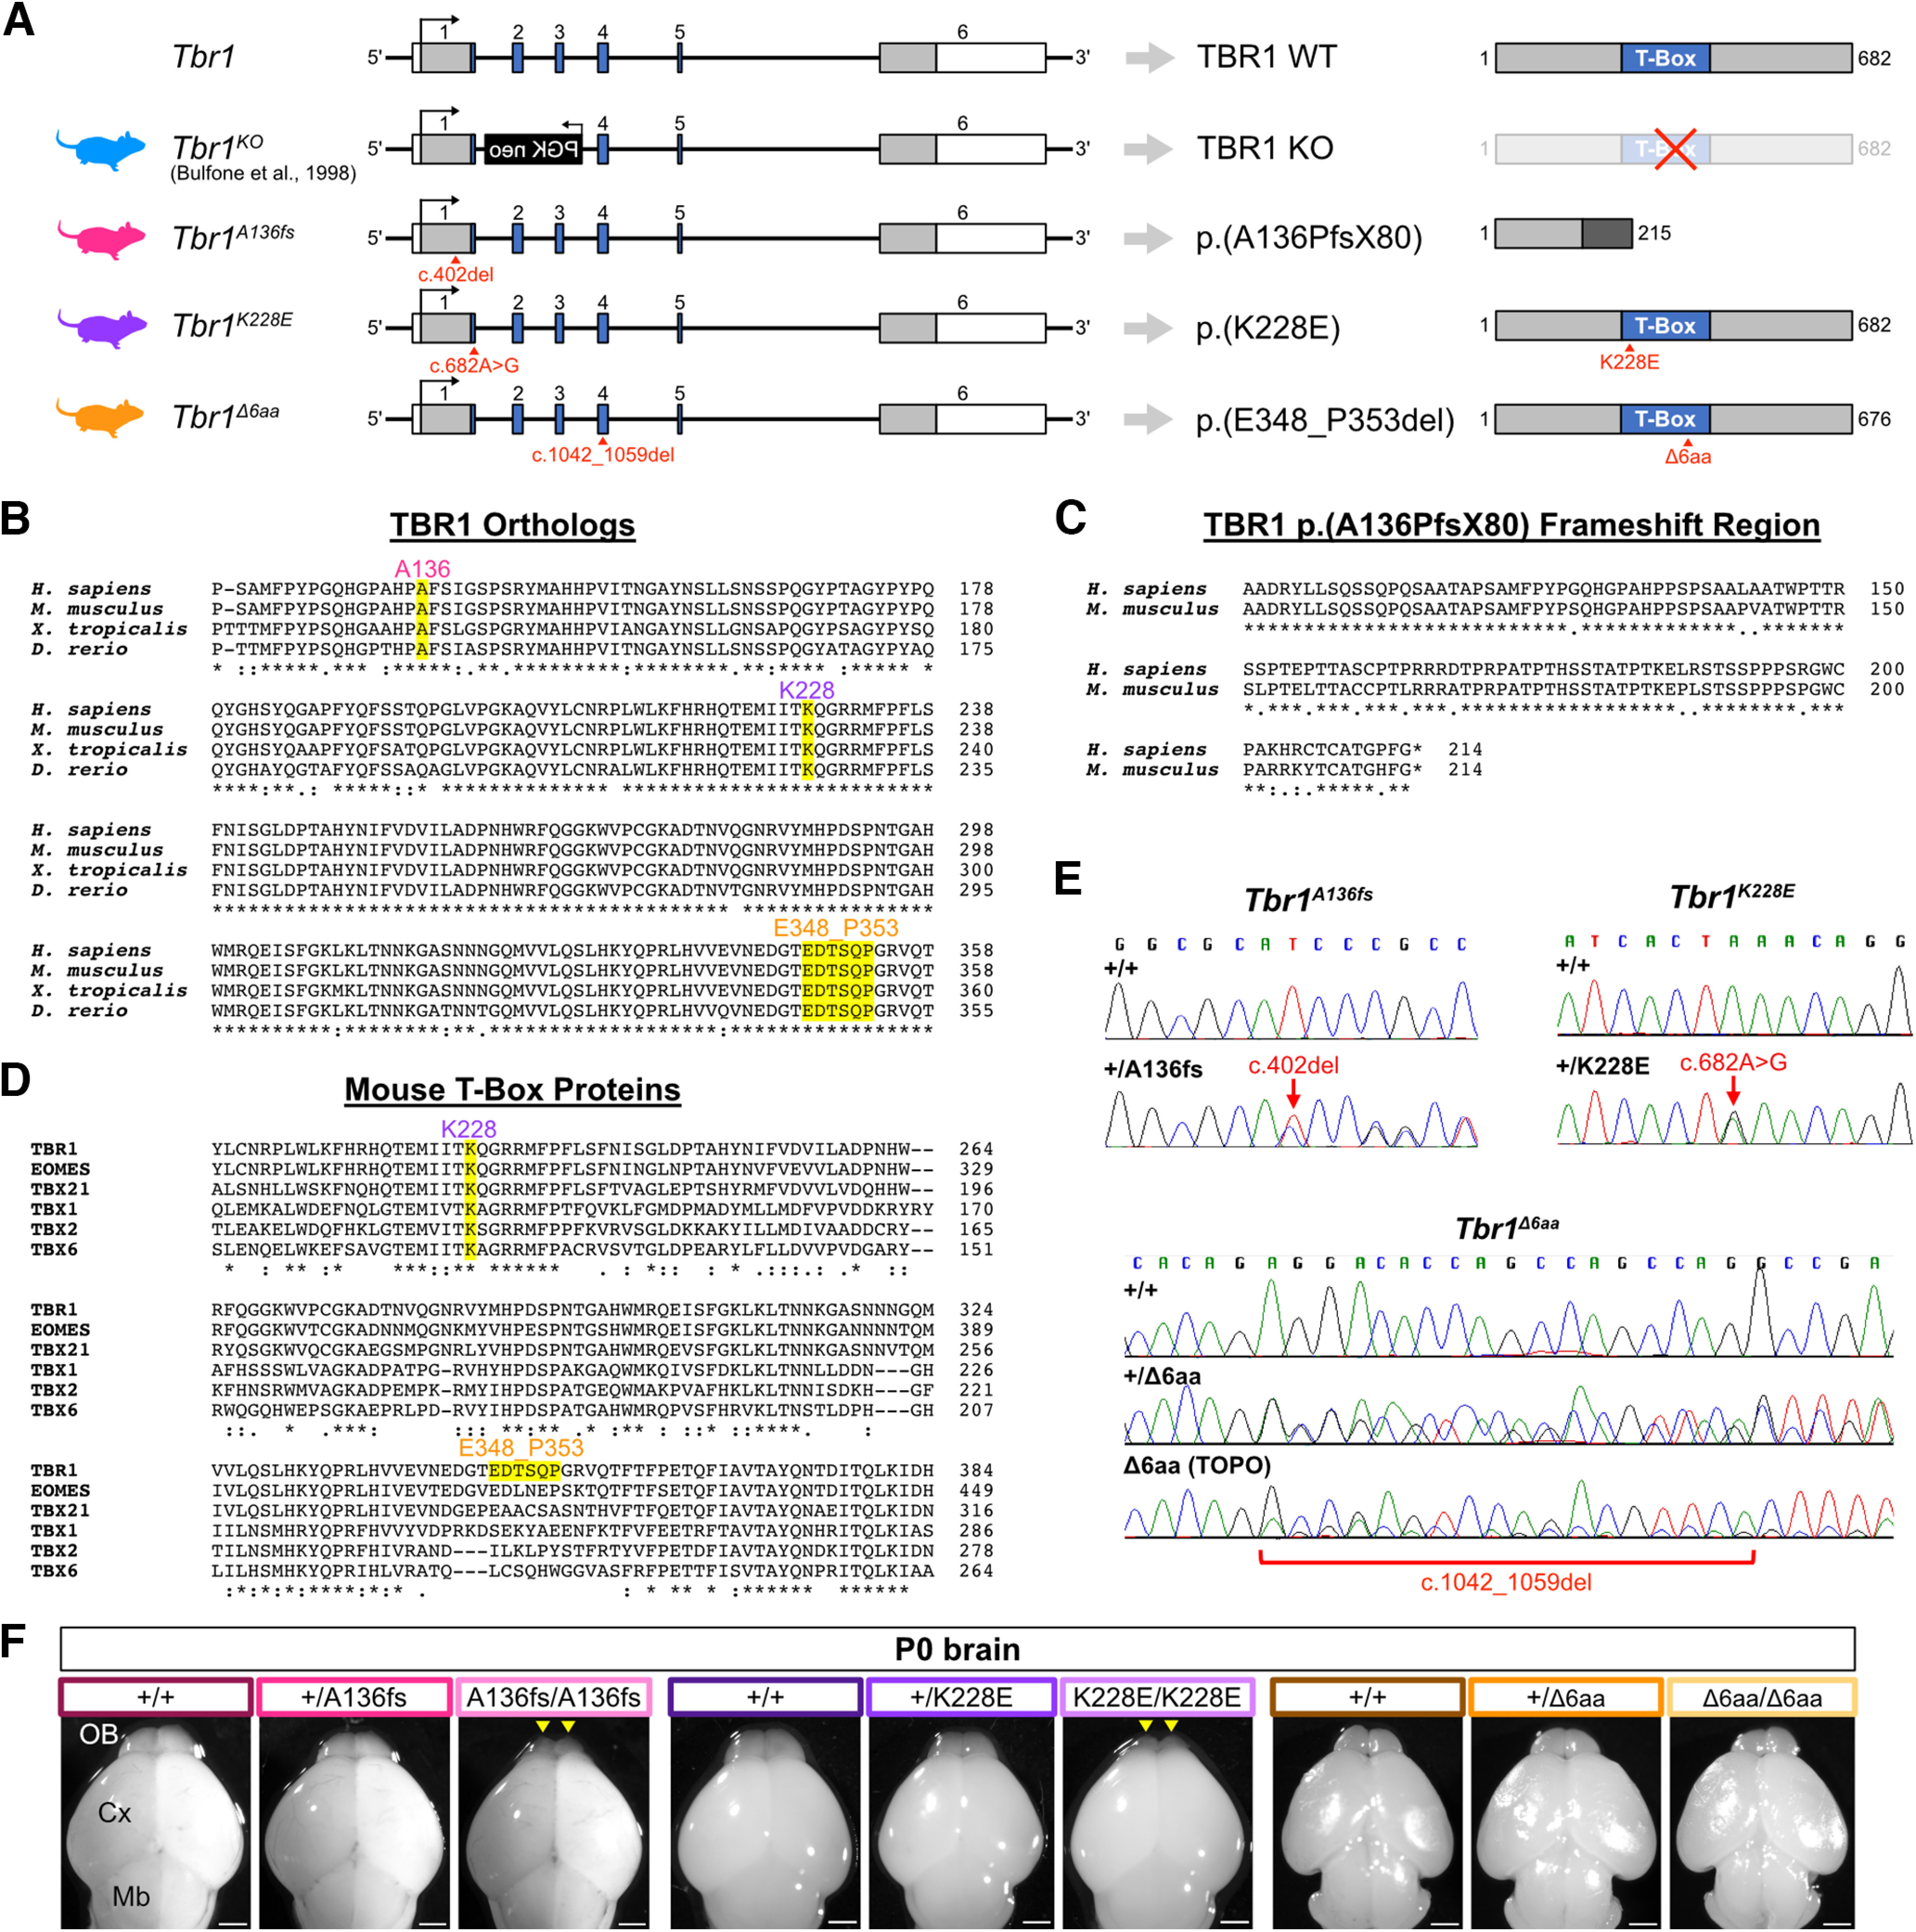
Generation of mouse lines carrying Tbr1 mutations. A, Schematic of Tbr1 gene structure (left) and predicted protein products (right) for Tbr1 mutant mouse lines used in this study: published Tbr1KO line replacing exons 2-3 with a neomycin cassette (Bulfone et al., 1998) and three CRISPR-generated lines carrying a frameshift mutation (A136PfsX80 or A136fs), missense mutation (K228E), or in-frame deletion of 6 aa (E348_P353del or Δ6aa). See Extended Data Figure 1-1 for reported human mutations within the in-frame deletion site of Tbr1Δ6aa mice. For Tbr1 gene, blue boxes indicate T-box coding sequence, gray boxes indicate other coding sequence, and white boxes indicate untranslated regions. B, Multiple sequence alignment of TBR1 mutation sites across vertebrate species. C, Pairwise alignment of predicted frameshift regions of human and mouse TBR1-A136PfsX80 proteins. D, Multiple sequence alignment of K228 and E348_P353 sites across mouse T-box family proteins. E, Sanger sequencing of genomic or TOPO-cloned DNA showing CRISPR-generated Tbr1A136fs, Tbr1K228E, and Tbr1Δ6aa mutations. See Extended Data Figure 1-2 for CRISPR oligonucleotide and Sanger primer sequences. F, Dorsal view of brains from postnatal day 0 Tbr1A136fs, Tbr1K228E, and Tbr1Δ6aa mutant mice and wild-type littermates. Arrowheads indicate underdeveloped olfactory bulbs in Tbr1A136fs/A136fs and Tbr1K228E/K228E mice. Scale bar, 1 mm.
Reported human mutations within in-frame deletion site of Tbr1Δ6aa mice. This extended data table supports Figure 1. Human mutations affecting TBR1 residues 348–353, which are deleted in Tbr1Δ6aa mice, and accompanying clinical genetic information are provided. Download Figure 1-1, DOCX file (13.8KB, docx) .
For each line, we tested multiple CRISPR sgRNA sequences, and for Tbr1A136fs and Tbr1K228E we designed single-stranded oligo DNA donors to knock in the mutations through homology-directed repair (Extended Data Fig. 1-2). Using Sanger sequencing, we confirmed the Tbr1 patient mutations and lack of local (∼300 bp) off-target edits in the founder mice (F0) and their offspring (Fig. 1E). While the sgRNAs had limited potential for exonic off-target effects (two or fewer off-target mismatches), we further accounted for any off-target edits by backcrossing each line to the parental C57BL/6NJ strain for at least two generations and always comparing littermate controls and mutants within experiments. For Tbr1A136fs, we also characterized three separate F1-descendant branches and identified no brain phenotypic differences among these lineages, further suggesting that any phenotypes observed were specific to the primary Tbr1 editing event.
Primers and oligonucleotides used in this study. This extended data table supports Figures 1 and 2. Primers and oligonucleotides for mouse CRISPR/Cas9, Sanger sequencing, PCR genotyping, and real-time qPCR are provided. Asterisks indicate a phosphorothioate bond. Download Figure 1-2, DOCX file (16.6KB, docx) .
Heterozygous mutants from the Tbr1A136fs, Tbr1K228E, and Tbr1Δ6aa lines, as well as Tbr1Δ6aa homozygotes, appeared healthy with normal outward morphology. In contrast, Tbr1A136fs/A136fs and Tbr1K228E/K228E mice died perinatally and had small olfactory bulbs (Fig. 1F). Underdevelopment of the olfactory bulbs was previously described in homozygous mutants from the Tbr1 knock-out (Tbr1KO) line, which was generated by replacement of exons 2-3 with a PGK-neomycin cassette (Fig. 1A; Bulfone et al., 1998). We proceeded to characterize Tbr1 expression in the Tbr1A136fs, Tbr1K228E, and Tbr1Δ6aa lines in comparison with the Tbr1KO line.
Contrasting effects of Tbr1 mutations on TBR1 protein levels in cortex
We first measured TBR1 protein levels in P0 cortex from Tbr1KO mice (heterozygotes denoted as Tbr1+/–, homozygotes denoted as Tbr1–/–) and the CRISPR-generated mutant mouse lines. Full-length TBR1 signal was reduced by ∼25% in both Tbr1+/– and Tbr1+/A136fs and completely absent in both Tbr1–/– and Tbr1A136fs/A136fs (Tbr1KO: F(2,15) = 60.2, p < 0.001; Tbr1A136fs: F(2,15) = 33.0, p < 0.001; ANOVA; Fig. 2A,B). The predicted truncated TBR1-A136PfsX80 protein was also undetectable using an N-terminal TBR1 antibody. In contrast, TBR1 levels were increased by twofold and fivefold in Tbr1+/K228E and Tbr1K228E/K228E cortices, respectively, while TBR1 was unchanged in Tbr1Δ6aa mutants (Tbr1K228E: F(2,6) = 55.0, p = 0.001; Tbr1Δ6aa: F(2,8) = 0.414, p = 0.674; ANOVA). These TBR1 alterations were maintained in adult heterozygous mutant cortex (Tbr1KO, p = 0.007; Tbr1A136fs, p = 0.016; Tbr1K228E, p = 0.012; t test; Fig. 2C). Despite decreases in TBR1 protein in Tbr1KO and Tbr1A136fs mutants, qPCR analysis using primers downstream of these mutations revealed that Tbr1 transcript levels were not decreased in heterozygotes, and were modestly decreased in homozygotes, suggesting that the protein reductions resulted from post-transcriptional processes (Tbr1KO: F(2,15) = 18.4, p < 0.001; Tbr1A136fs: F(2,15) = 4.45, p = 0.030; ANOVA; Fig. 2D,E). To validate this finding and compare transcript degradation at the 5′ end versus the 3′ end of mutant transcripts, we repeated qPCR with primers targeting the 5′ end of Tbr1 and obtained similar results as the 3′ qPCR (Tbr1KO: F(2,15) = 11.4, p = 0.001; Tbr1A136fs: F(2,15) = 10.1, p = 0.002; ANOVA; Fig. 2D,F). However, when we performed Sanger sequencing of cDNA from Tbr1+/A136fs cortex, transcripts from the mutant allele comprised only a small proportion of the overall Tbr1 transcript, suggesting upregulation from the WT allele and/or degradation of mutant transcripts via nonsense-mediated decay or other mRNA surveillance mechanisms (Fig. 2G,H). In Tbr1+/K228E, and Tbr1K228E/K228E, Tbr1 was increased by 1.5-fold and 3.5-fold, respectively, indicating that their increased TBR1 protein levels are attributable to transcriptional upregulation (Tbr1K228E: F(2,6) = 156.6, p < 0.001; ANOVA; Fig. 2E). Tbr1 transcript levels were unchanged in Tbr1Δ6aa mutants (Tbr1Δ6aa: F(2,8) = 1.31, p = 0.337; ANOVA; Fig. 2E).
Figure 2.
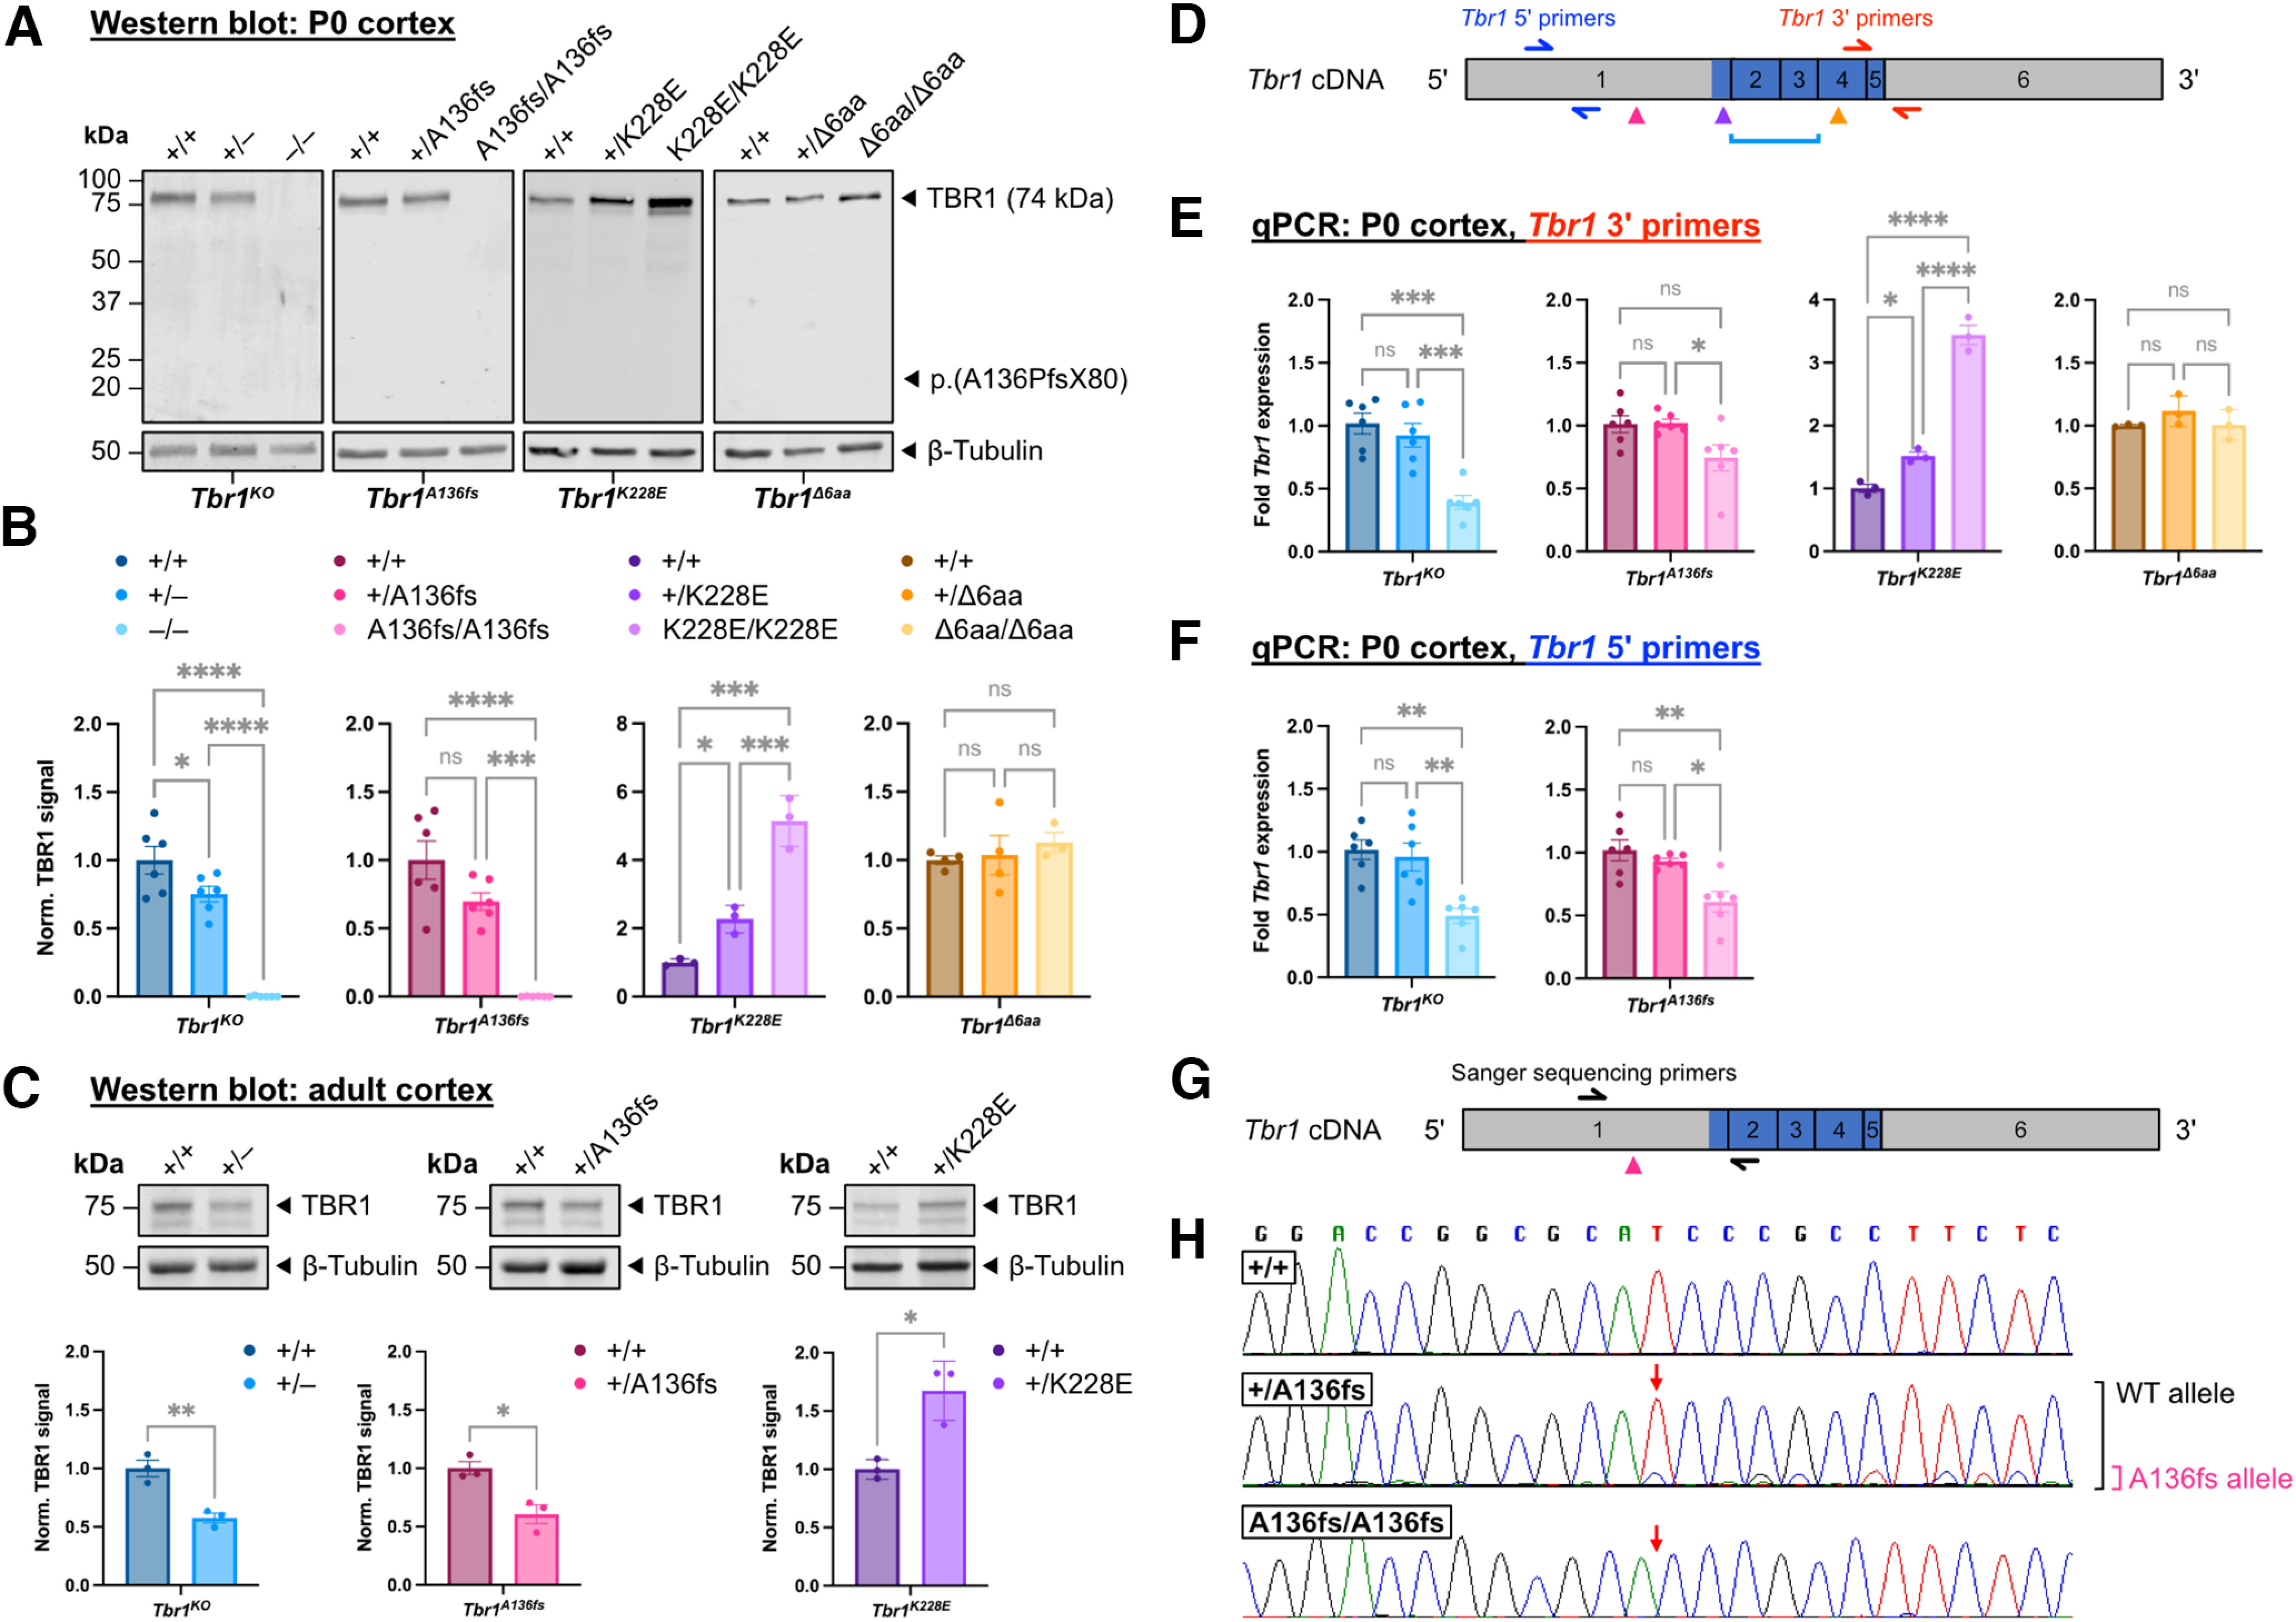
Tbr1 A136PfsX80 is a loss-of-function mutation, while K228E mutation causes TBR1 upregulation. A, B, Western blots for TBR1 in P0 cortical lysates from Tbr1 mutant mouse lines (n = 3–6 mice/genotype). β-III-Tubulin was used as loading control. Predicted molecular weight of truncated TBR1-A136PfsX80 protein is indicated but not detectable in Tbr1A136fs mutants. C, Western blots for TBR1 in adult cortical lysates from Tbr1KO and patient mutant lines (n = 3 mice per genotype). D, Schematic of Tbr1 cDNA indicating locations of Tbr1 mutations (arrowheads or bracket) and qPCR primers. Mutations are color-coded as in B. Blue shading indicates T-box coding region. See Extended Data Figure 1-2 for qPCR primer sequences. E, F, qPCR for Tbr1 using two primer sets in P0 Tbr1 mutant mouse line cortex (n = 3–6 mice per genotype). Genotypes are color coded as in B. G, H, Sanger sequencing of Tbr1 cDNA from P0 Tbr1A136fs mutant cortex. Red arrows indicate the position of mutation. Brackets indicate peaks corresponding to WT (black) and mutant (magenta) allele in Tbr1+/A136fs cDNA. Data are plotted as the mean ± SEM. Each dot represents one animal. One-way ANOVA with Tukey's multiple-comparisons test was used in B, E, and F; unpaired Student's t test was used in C. *p < 0.05; **p < 0.01; ***p < 0.001; ****p < 0.0001. ns, Not significant.
In the developing cortex, TBR1 is present at high levels in deep-layer excitatory projection neurons, and in adulthood is present in both upper-layer and deep-layer excitatory neurons (Hevner et al., 2001). To assess TBR1 layer distribution and levels, we immunostained for TBR1 in P0 and adult brain sections and plotted fluorescence profiles across the cortical layers. At both neonatal and adult stages, heterozygotes of each mutant line showed TBR1 layer distributions similar to those of WT (Fig. 3A–D). While Tbr1–/– and Tbr1A136fs/A136fs showed minimal TBR1 fluorescence at P0, Tbr1K228E/K228E unexpectedly showed substantial TBR1 upregulation across all cortical layers (Fig. 3A,B). In these mice, the vast majority of NeuN+ cortical neurons expressed TBR1 (Fig. 3E). In contrast to the other homozygous mutants, Tbr1Δ6aa/Δ6aa showed normal deep-layer TBR1 expression in P0 cortex (Fig. 3A,B). Overall, these results show the following: (1) A136PfsX80 causes the absence of TBR1 protein; (2) K228E causes elevated TBR1 levels because of transcriptional upregulation and, in homozygotes, ectopic protein expression; and (3) the deletion of residues 348–353 has no impact on TBR1 levels.
Figure 3.
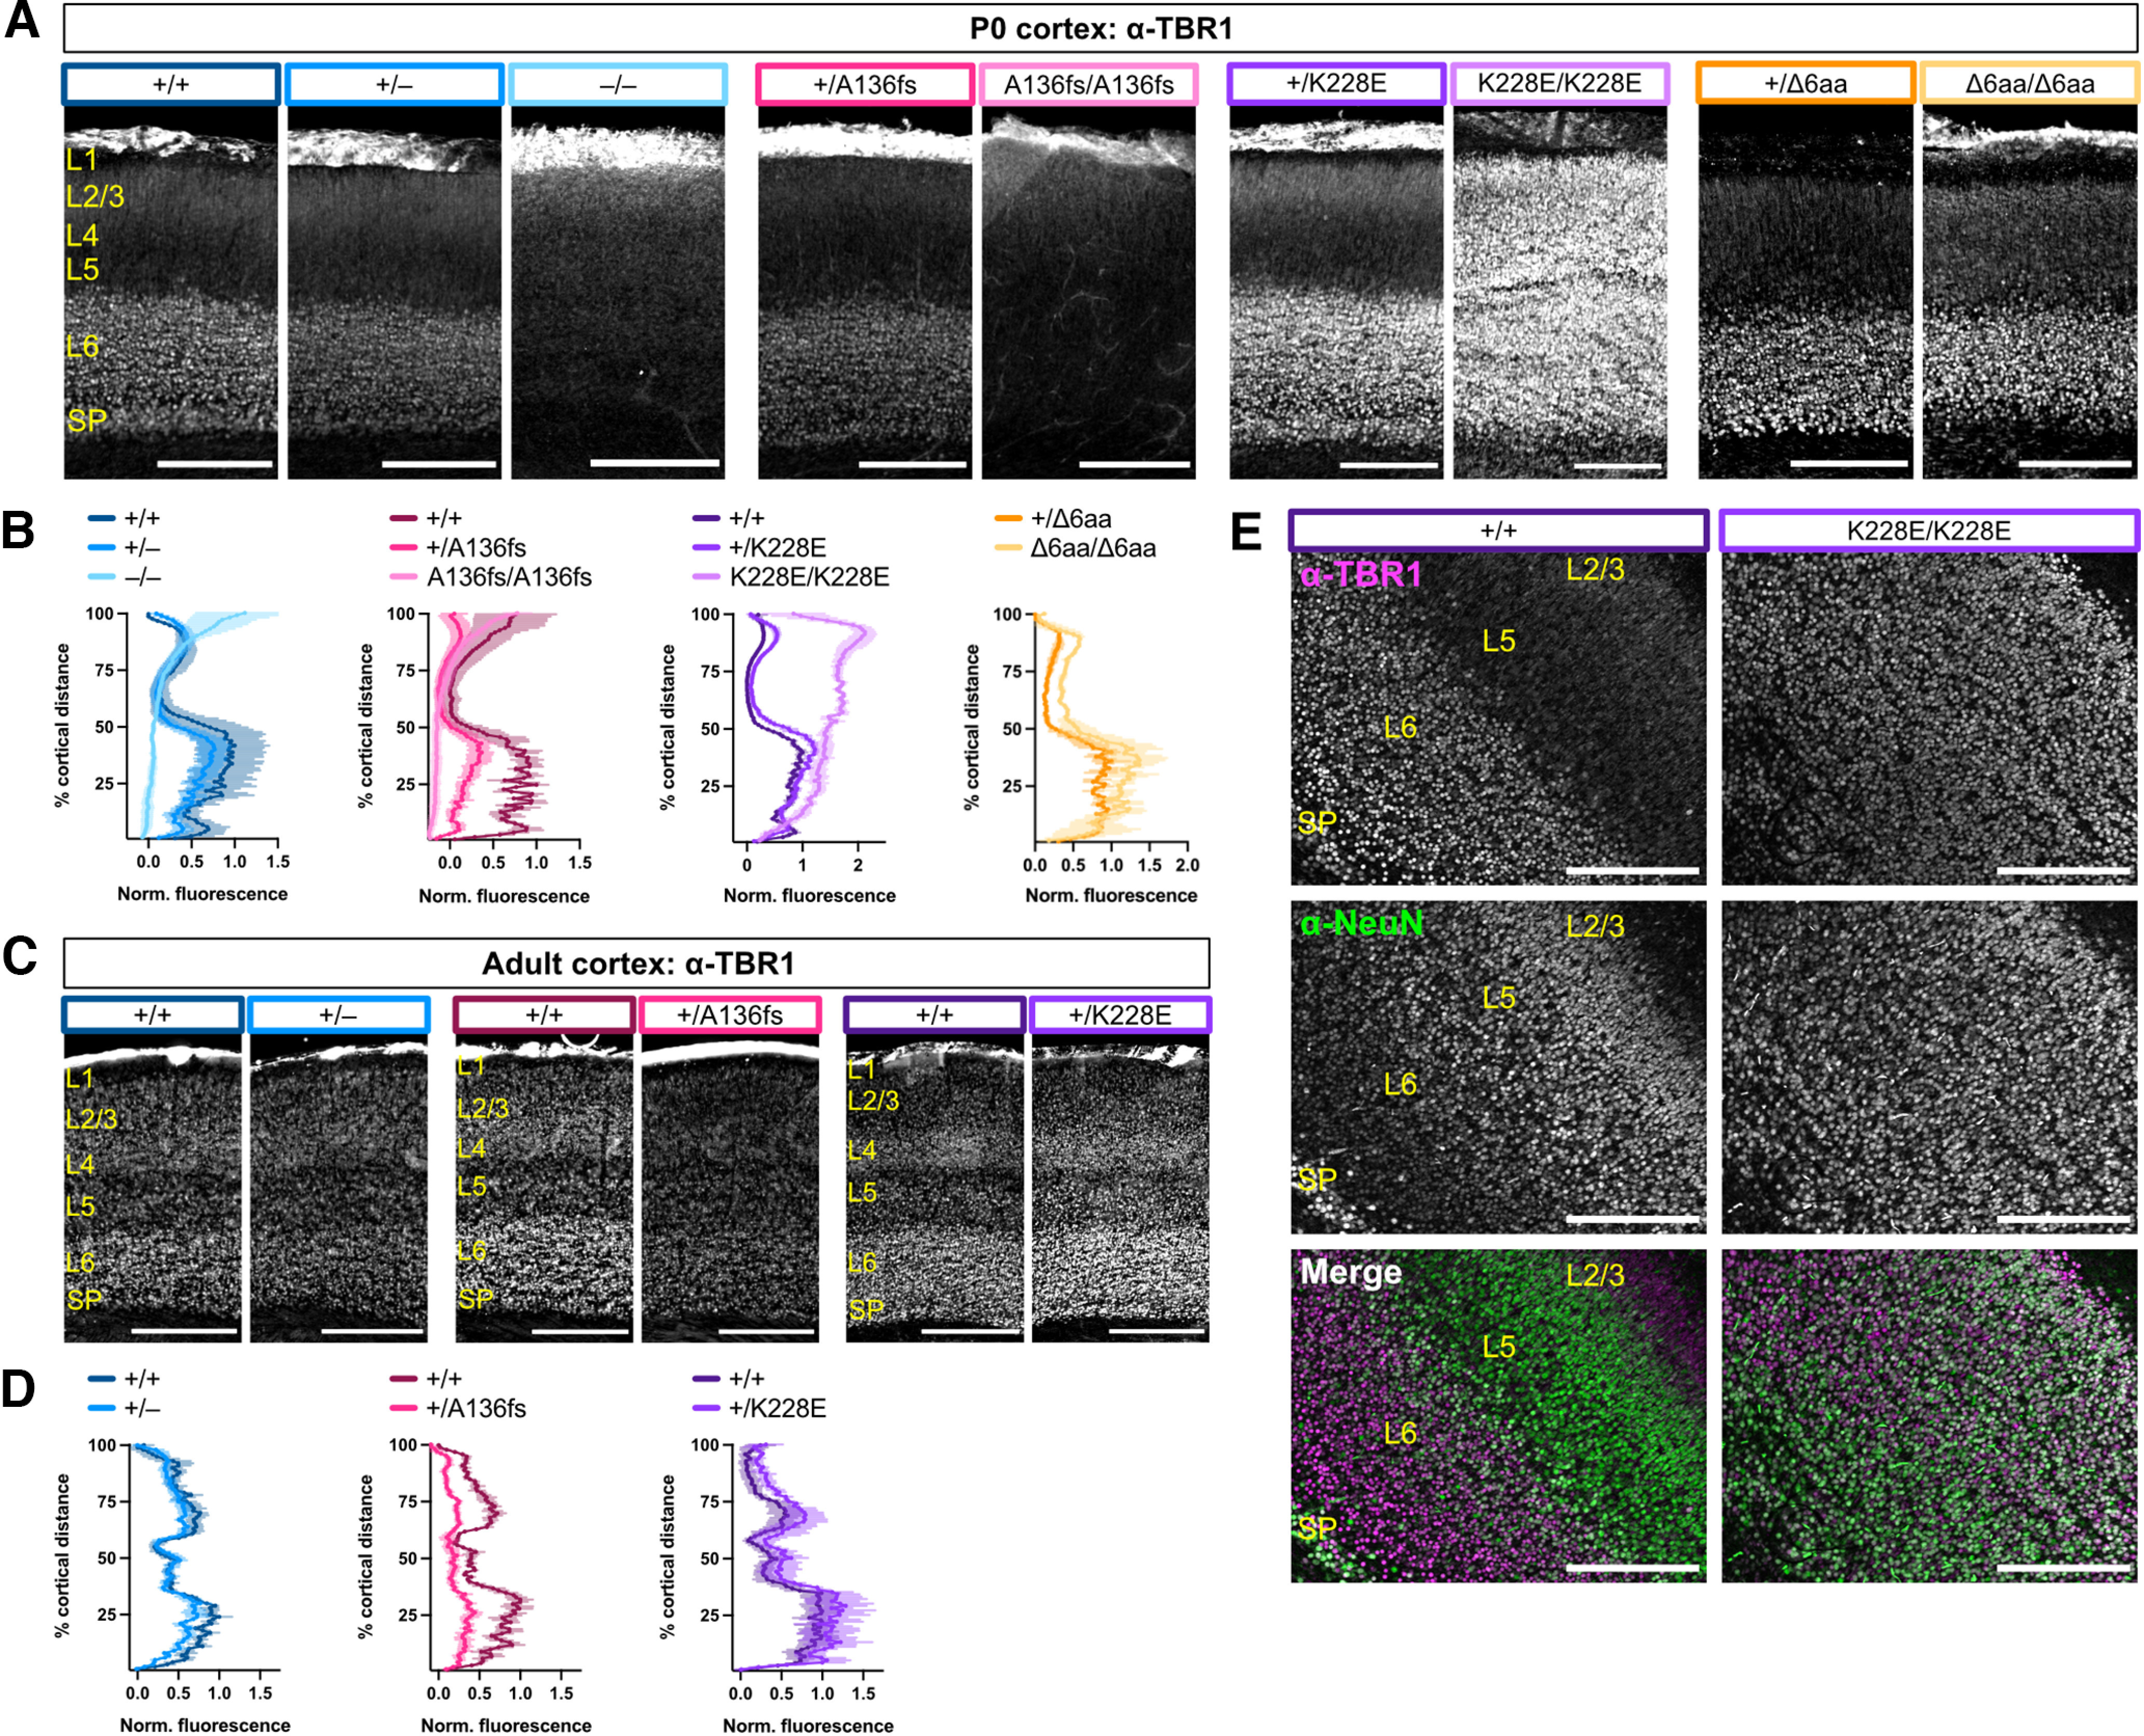
Homozygous K228E mutation causes ectopic TBR1 localization in cortex. A, TBR1 immunostaining in P0 Tbr1 mutant mouse line S1 cortex. B, Quantification of TBR1 fluorescence intensity across the cortical mantle from A (n = 2–4 mice/genotype). C, D, TBR1 immunostaining and quantification in adult Tbr1KO and patient mutant line S1 cortex. E, Coimmunostaining for TBR1 and NeuN in P0 Tbr1+/+ and Tbr1K228E/K228E S1 cortex. SP, Subplate. Scale bars: A, E, 200 μm; C, 500 μm. Data are plotted as the mean ± SEM.
Homozygosity of different Tbr1 mutations causes distinct cortical layering phenotypes
During corticogenesis, newborn neurons migrate outward from a germinal zone to form six cytoarchitectural layers, and neuronal subpopulations within each layer obtain distinct transcriptional and functional identities (Kwan et al., 2012). Tbr1–/– mice show reeler-like disorganization of cortical layering and misspecification of layer 6 (L6) neurons to L5-like neurons (Hevner et al., 2001; Han et al., 2011; McKenna et al., 2011). To examine cortical formation and neuronal identity in the Tbr1 mutant lines, we immunostained for layer markers CUX1 (L2–4) and CTIP2 (L5) and costained for nuclear marker Hoechst at P0 and adulthood. At both stages, all Tbr1 heterozygotes and Tbr1Δ6aa/Δ6aa homozygotes showed grossly normal layer formation in primary somatosensory (S1) cortex (Fig. 4A–D). By adulthood, Tbr1+/–, Tbr1+/A136fs, and Tbr1+/K228E heterozygotes showed reductions in CTIP2 fluorescence intensity in L6, suggesting downregulation of this transcription factor in mature heterozygous mutant cortex (Tbr1KO: F(1,15) = 11.1, p = 0.005; Tbr1A136fs: F(1,9) = 2.44, p = 0.153; Tbr1K228E: F(1,24) = 4.84, p = 0.038; ANOVA; Fig. 4C,E). Homozygous Tbr1–/–, Tbr1A136fs/A136fs, and Tbr1K228E/K228E mice showed major cortical layering defects differing by mutation (Fig. 4A,B). Specifically, in Tbr1–/– and Tbr1A136fs/A136fs mice, layer positions were inverted, with CUX1+ cells mostly residing in inner cortex and CTIP2+ cells almost exclusive to outer cortex. In contrast, Tbr1K228E/K228E mice showed a more complex layering phenotype, with CUX1+ cells forming a thin mid-cortical layer and CTIP2+ cells residing in both outer and inner cortex. Tbr1–/–, Tbr1A136fs/A136fs, and Tbr1K228E/K228E homozygotes also showed an overabundance of CTIP2+ neurons compared with WT, suggesting L6-to-L5 misspecification. Overall, these data indicate that one WT copy of Tbr1 is sufficient for normal cortical layer formation. Furthermore, KO, A136PfsX80, and K228E mutations have discordant effects on cortical layer formation, but congruent effects on deep-layer marker CTIP2 expression.
Figure 4.
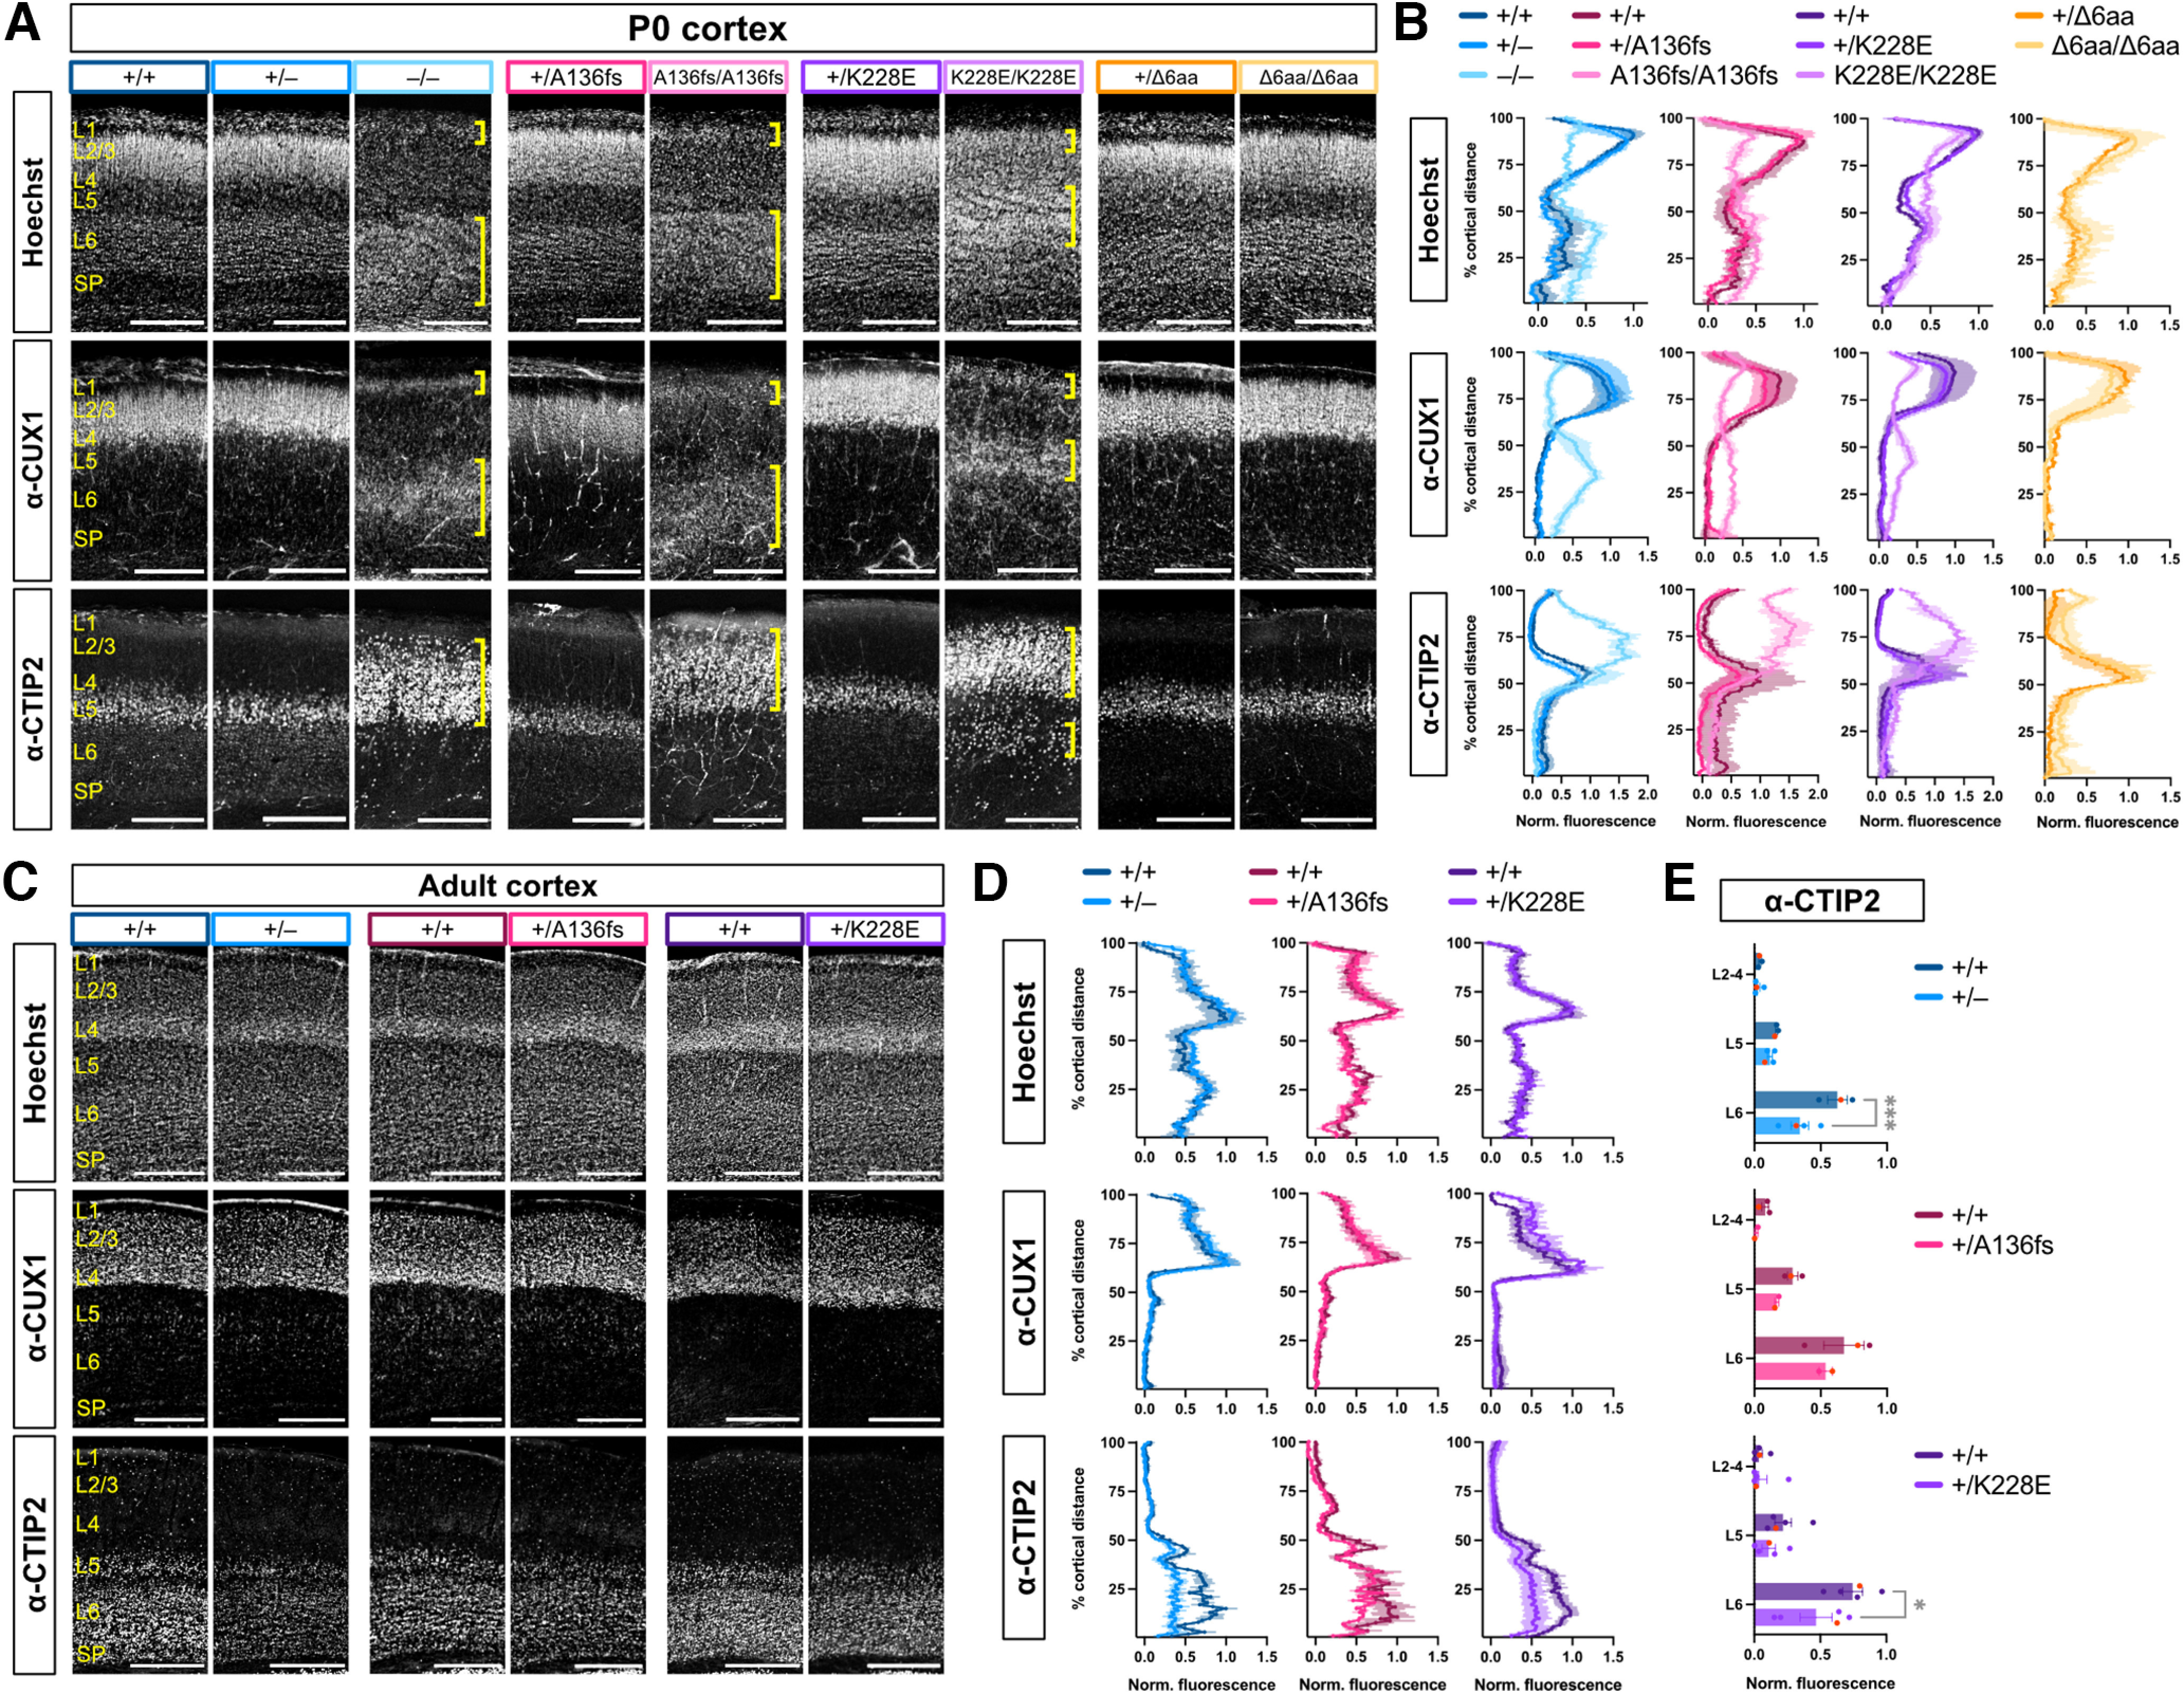
K228E mutation causes distinct cortical layering defects from Tbr1 knockout and A136PfsX80. A, Hoechst nuclear stain and immunostaining for cortical layer markers CUX1 (L2–4) and CTIP2 (L5) in P0 Tbr1 mutant mouse line S1 cortex. Yellow brackets indicate abnormal cortical layers formed in homozygous mutants. B, Quantification of Hoechst, CUX1, and CTIP2 fluorescence intensity across the cortical mantle from A (n = 2–4 mice/genotype). C, D, Hoechst, CUX1, and CTIP2 staining and quantification in adult Tbr1KO and patient line S1 cortex (n = 2–4 mice/genotype). E, CTIP2 fluorescence binned by cortical layers using fluorescence values from D. SP, Subplate. Scale bars: A, 200 μm; C, 500 μm. Data are plotted as the mean ± SEM. Each dot represents one animal; red dots correspond to representative images. Two-way ANOVA with Šídák's multiple-comparisons test was used in E. *p < 0.05; ***p < 0.001.
To further assess the functionality of the K228E and Δ6aa alleles, we performed genetic complementation tests by crossing each of these mutant lines with the Tbr1KO line. Tbr1K228E/– cortical layering was phenotypically intermediate between Tbr1–/– and Tbr1K228E/K228E, with CUX1 and Hoechst distributions resembling the former, and TBR1 and CTIP2 distributions resembling the latter (Fig. 5A,B). In contrast, Tbr1Δ6aa/– mice showed normal layer formation, despite having only one copy of the mutant allele on a null background (Fig. 5C,D). These results confirm that the T-box mutant K228E has insufficient functionality to mediate proper cortical layer formation, while amino acids 348–353 of the T-box are dispensable for layer formation. Thus, we limited further characterization of the Tbr1Δ6aa line to focus on the more pathogenic patient-specific mutations.
Figure 5.
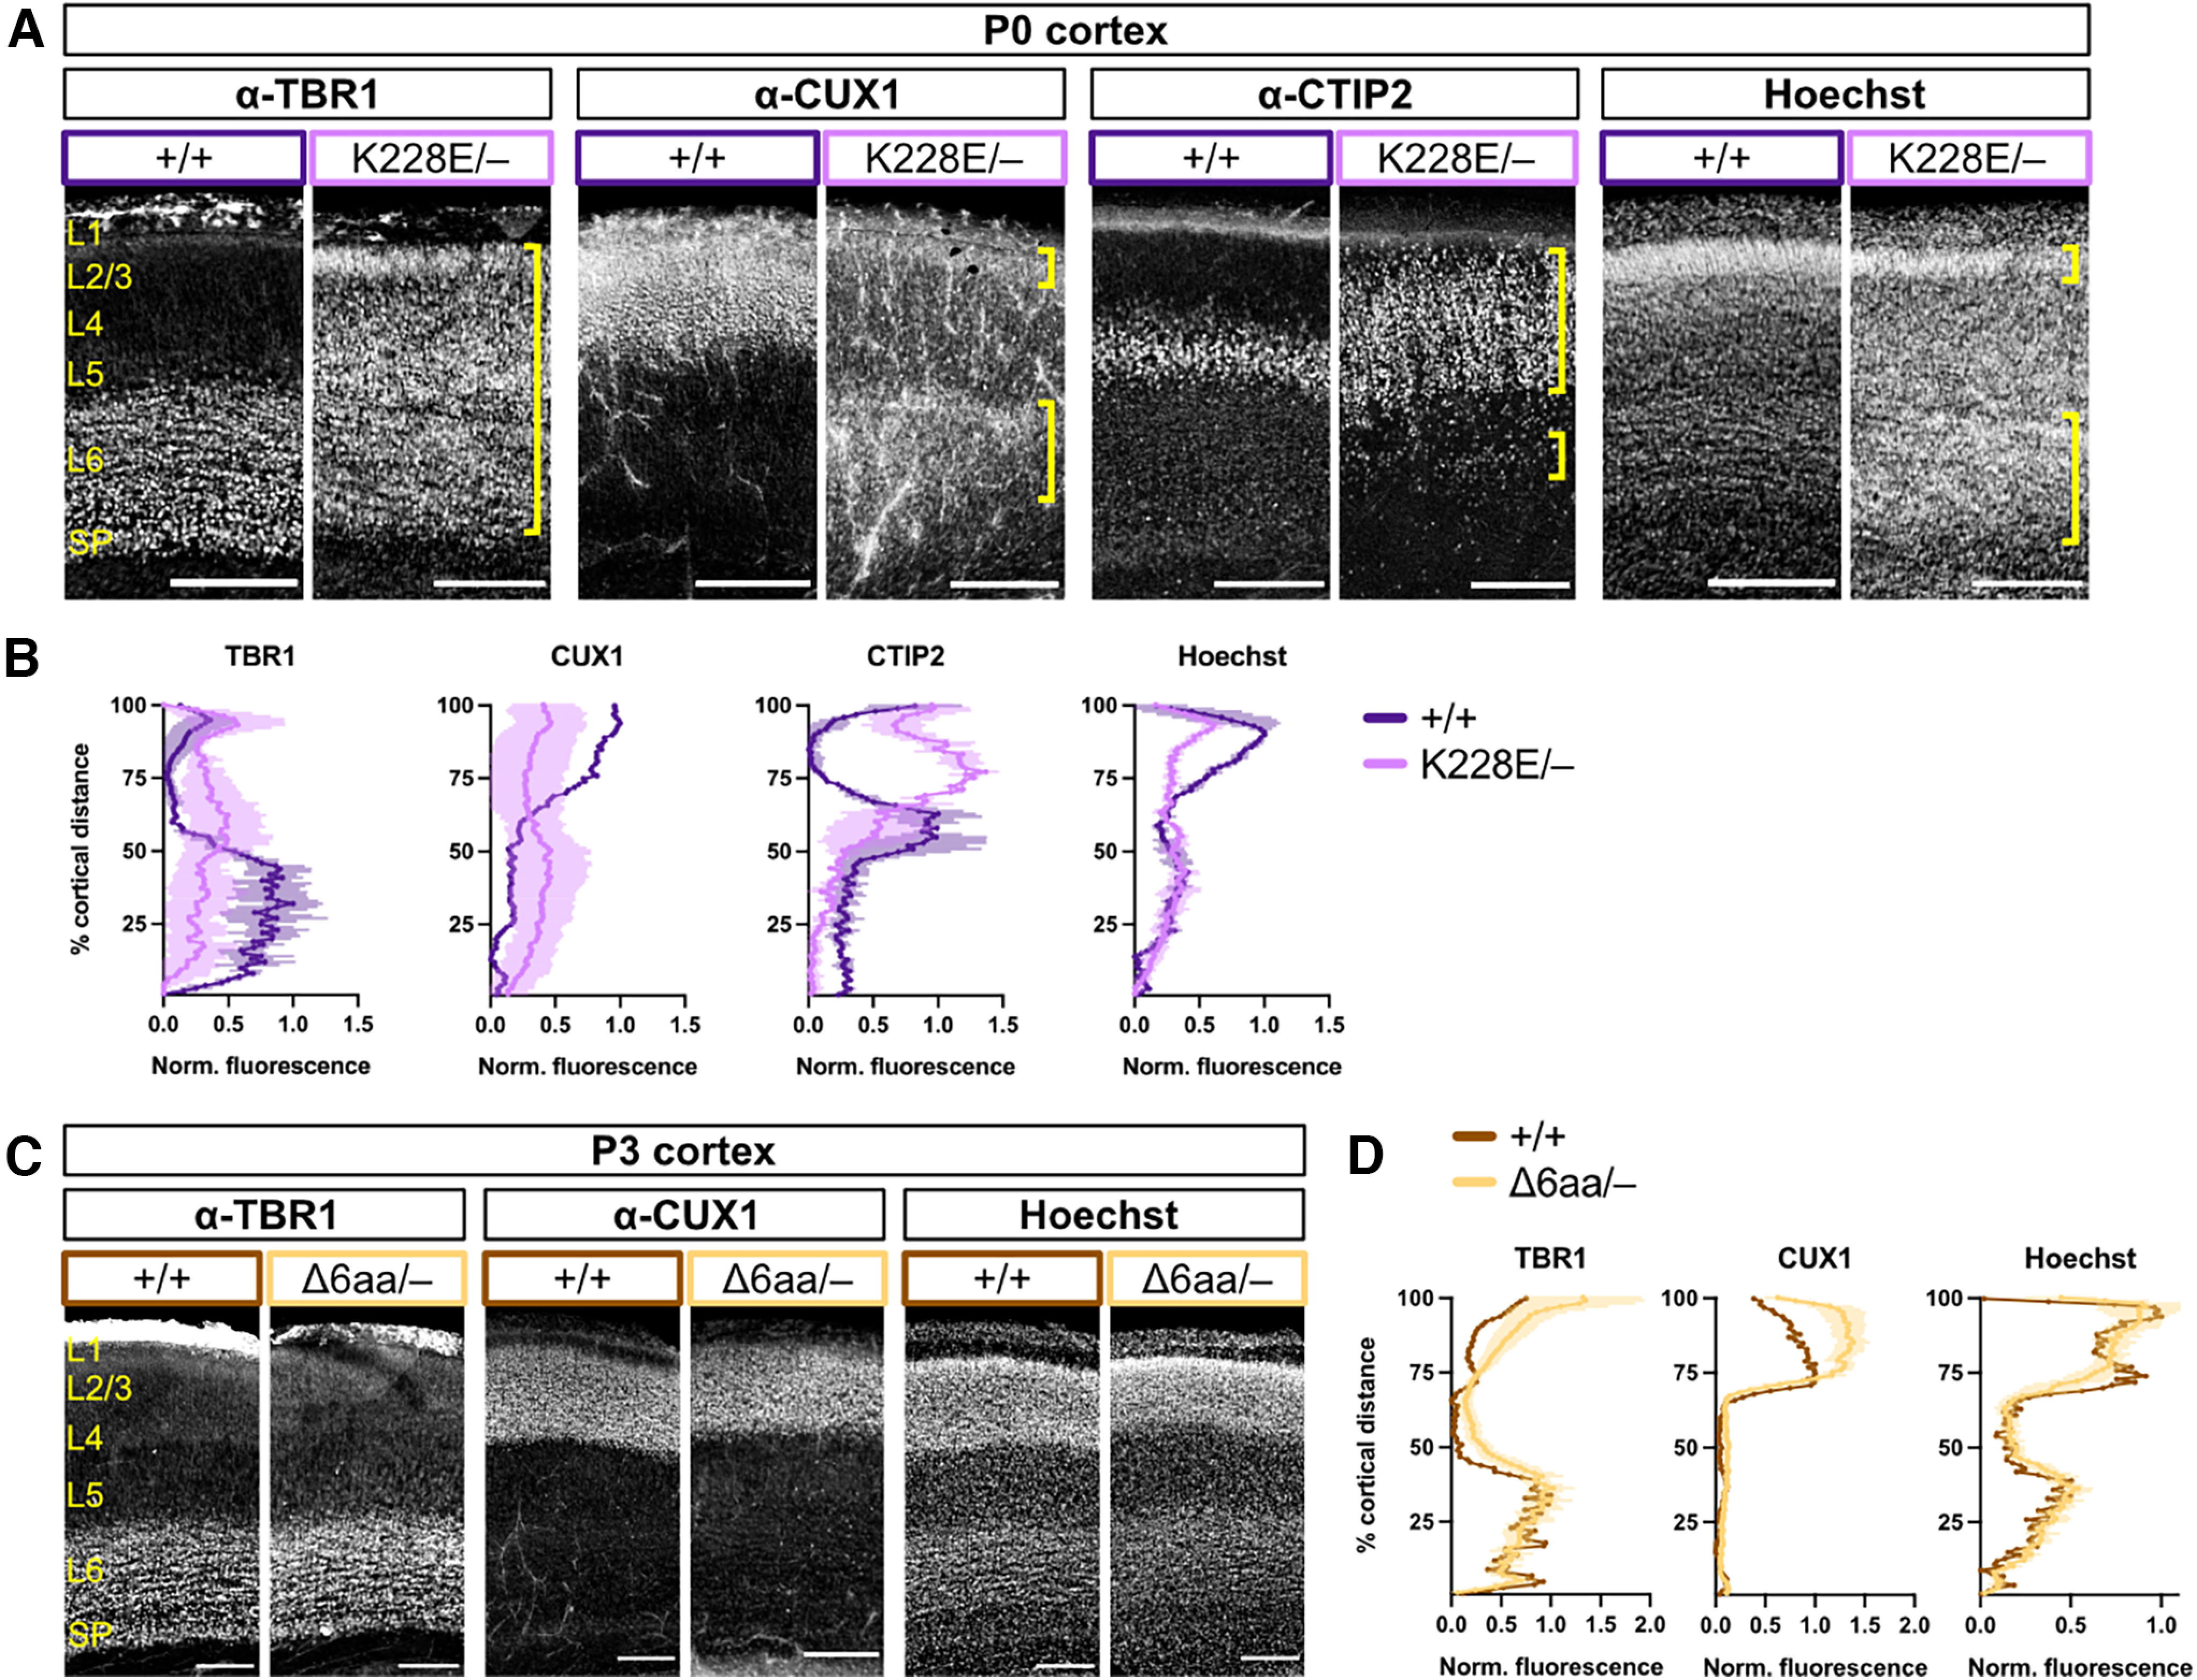
Complementation cross shows limited functionality of K228E allele. A, TBR1, CUX1, and CTIP2 immunostaining and Hoechst nuclear stain in S1 cortex of P0 offspring from Tbr1KO and Tbr1K228E complementation cross. Yellow brackets indicate abnormal cortical layers formed in Tbr1K228E/– mice. B, Quantification of TBR1, CUX1, CTIP2, and Hoechst fluorescence intensity across the cortical mantle from A (n = 1–2 mice/genotype). C, D, TBR1, CUX1, and Hoechst staining and fluorescence quantification in S1 cortex of P3 offspring from Tbr1KO and Tbr1Δ6aa complementation cross (n = 1–5 mice/genotype). SP, Subplate. Scale bars: A and C, 200 μm. Data are plotted as the mean ± SEM.
Tbr1 mutant mice show normal growth and motor function
Patients with TBR1 mutations have been reported to exhibit microcephaly, growth delay, developmental motor delay, and hypotonia (Palumbo et al., 2014; Nambot et al., 2020). We assessed postnatal growth in Tbr1KO, Tbr1A136fs, and Tbr1K228E mutant mice but found no changes in brain-to-body mass ratio at P0 (Tbr1KO: F(2,30) = 2.16, p = 0.133; Tbr1A136fs: F(2,18) = 1.56, p = 0.238; Tbr1K228E: F(2,28) = 0.665, p = 0.522; ANOVA), or in body mass from P4 to P14 (Tbr1KO: F(1,22) = 0.184, p = 0.673; Tbr1A136fs: F(1,40) = 0.941, p = 0.338; Tbr1K228E: F(1,23) = 0.00,895, p = 0.926; ANOVA; Fig. 6A,B). Furthermore, heterozygous mutants did not show impairment in the negative geotaxis motor test across postnatal development (Tbr1KO: F(1,14) = 1.17, p = 0.297; Tbr1A136fs: F(1,39) = 7.76e-005, p = 0.993; Tbr1K228E: F(1,22) = 0.305, p = 0.586; ANOVA; Fig. 6C). Thus, these Tbr1 mutations have minimal impact on the growth and gross motor function of mice during development.
Figure 6.

Normal growth and motor development of postnatal Tbr1 mutant mice. A, Brain mass, body mass, and brain/body mass ratio measurements for Tbr1KO and patient mutant mouse lines at P0 (n = 5–18 mice/genotype). B, Body mass measurements for Tbr1KO and patient mutant mouse lines across postnatal development (n = 10–27 mice/genotype). C, Latency for mouse pups to orient upward on a slope in the negative geotaxis test of motor coordination (n = 8–26 mice/genotype). One-way ANOVA with Tukey's multiple-comparisons test was used in A; two-way repeated-measures ANOVA with Šídák's multiple-comparisons test was used in B and C. ns, Not significant.
Tbr1 mutant mice show normal interneuron distributions in S1 cortex
While Tbr1 expression in the cortex is restricted to glutamatergic neurons, Tbr1–/– mice show abnormal distribution of GABAergic interneurons; furthermore, Tbr1+/K228E mice show displacement of PV-expressing interneurons, but not other interneuron subtypes, in medial prefrontal cortex (Hevner et al., 2001; Yook et al., 2019). To examine non-cell-autonomous effects of Tbr1 mutations on cortical interneuron distribution, we immunostained for the major interneuron subtype markers PV and SST in S1 cortex of adult Tbr1+/–, Tbr1+/A136fs, and Tbr1+/K228E mice (Fig. 7A,B). For each interneuron subtype, we found no changes in cell density (SST Tbr1KO, p = 0.293; SST Tbr1A136fs, p = 0.318; SST Tbr1K228E, p = 0.897; PV Tbr1KO, p = 0.821; PV Tbr1A136fs, p = 0.902; PV Tbr1K228E, p = 0.459; t test) or distribution (SST Tbr1KO, p = 0.994; SST Tbr1A136fs, p > 0.999; SST Tbr1K228E, p > 0.999; PV Tbr1KO, p = 0.699; PV Tbr1A136fs, p > 0.999; PV Tbr1K228E, p > 0.999; Kolmogorov–Smirnov test; Fig. 7C–J). These results indicate limited impact of Tbr1 mutations on interneuron distributions in S1 cortex.
Figure 7.

Normal distribution of cortical interneurons in Tbr1 mutant mice. A, Immunostaining for interneuron subtype markers SST (green) and PV (magenta) in adult Tbr1KO and patient mutant line S1 cortex. B, Schematic illustrating bins and ROI for interneuron quantification. C, Number of SST+ cells per ROI (n = 3–7 mice/genotype). D, Fraction of SST+ cells distributed across 10 equal-sized bins of ROI. E, Fraction of SST+ cells distributed between superficial (bins 1–5) and deep (bins 6–10) cortex. F, Cumulative density of SST+ cells across the cortical mantle. G–J, Quantification of PV+ cells as in B–E (n = 3–7 mice/genotype). Scale bar: A, 500 μm. Data are plotted as the mean ± SEM. Each dot represents one animal. Unpaired Student's t test was used in C and G; two-way ANOVA with Šídák's multiple-comparisons test was D, E, H, and I; Kolmogorov–Smirnov test was used in F and J. ns, Not significant.
Tbr1 patient mutations A136fs and K228E cause equivalent axon tract defects to Tbr1 KO
Tbr1 is required for normal axon tract development in the brain: Tbr1–/– mice show severe defects of the corpus callosum, internal capsule, and AC, and Tbr1+/– mice lack the posterior limb of the AC (Hevner et al., 2001; Huang et al., 2014). To examine axon tract formation in the Tbr1 patient mutant lines, we immunostained for axon markers L1 and NF-M at P0 and adulthood. At these stages, nearly all heterozygotes examined from each Tbr1 line lacked the posterior limb of the AC, indicating a congruent and highly penetrant phenotype of heterozygous Tbr1 mutation (Tbr1+/–, n = 10 of 10 missing posterior limb; Tbr1+/A136fs, n = 8 of 8 missing posterior limb; Tbr1+/K228E, n = 7 of 8 mice missing posterior limb; Fig. 8A–C). One adult Tbr1+/K228E mouse showed a very thinly formed posterior limb (Fig. 8C, arrowhead). Homozygotes from each Tbr1 line showed more severe axon defects, including misdirected callosal fibers and complete absence of the AC, as well as aberrant upregulation of NF-M in the cortex (Fig. 8A,B). We also examined the internal capsule, which contains corticothalamic and thalamocortical axon fibers, and observed grossly normal organization of this tract in heterozygotes and abnormal organization in homozygotes (Fig. 8D).
Figure 8.
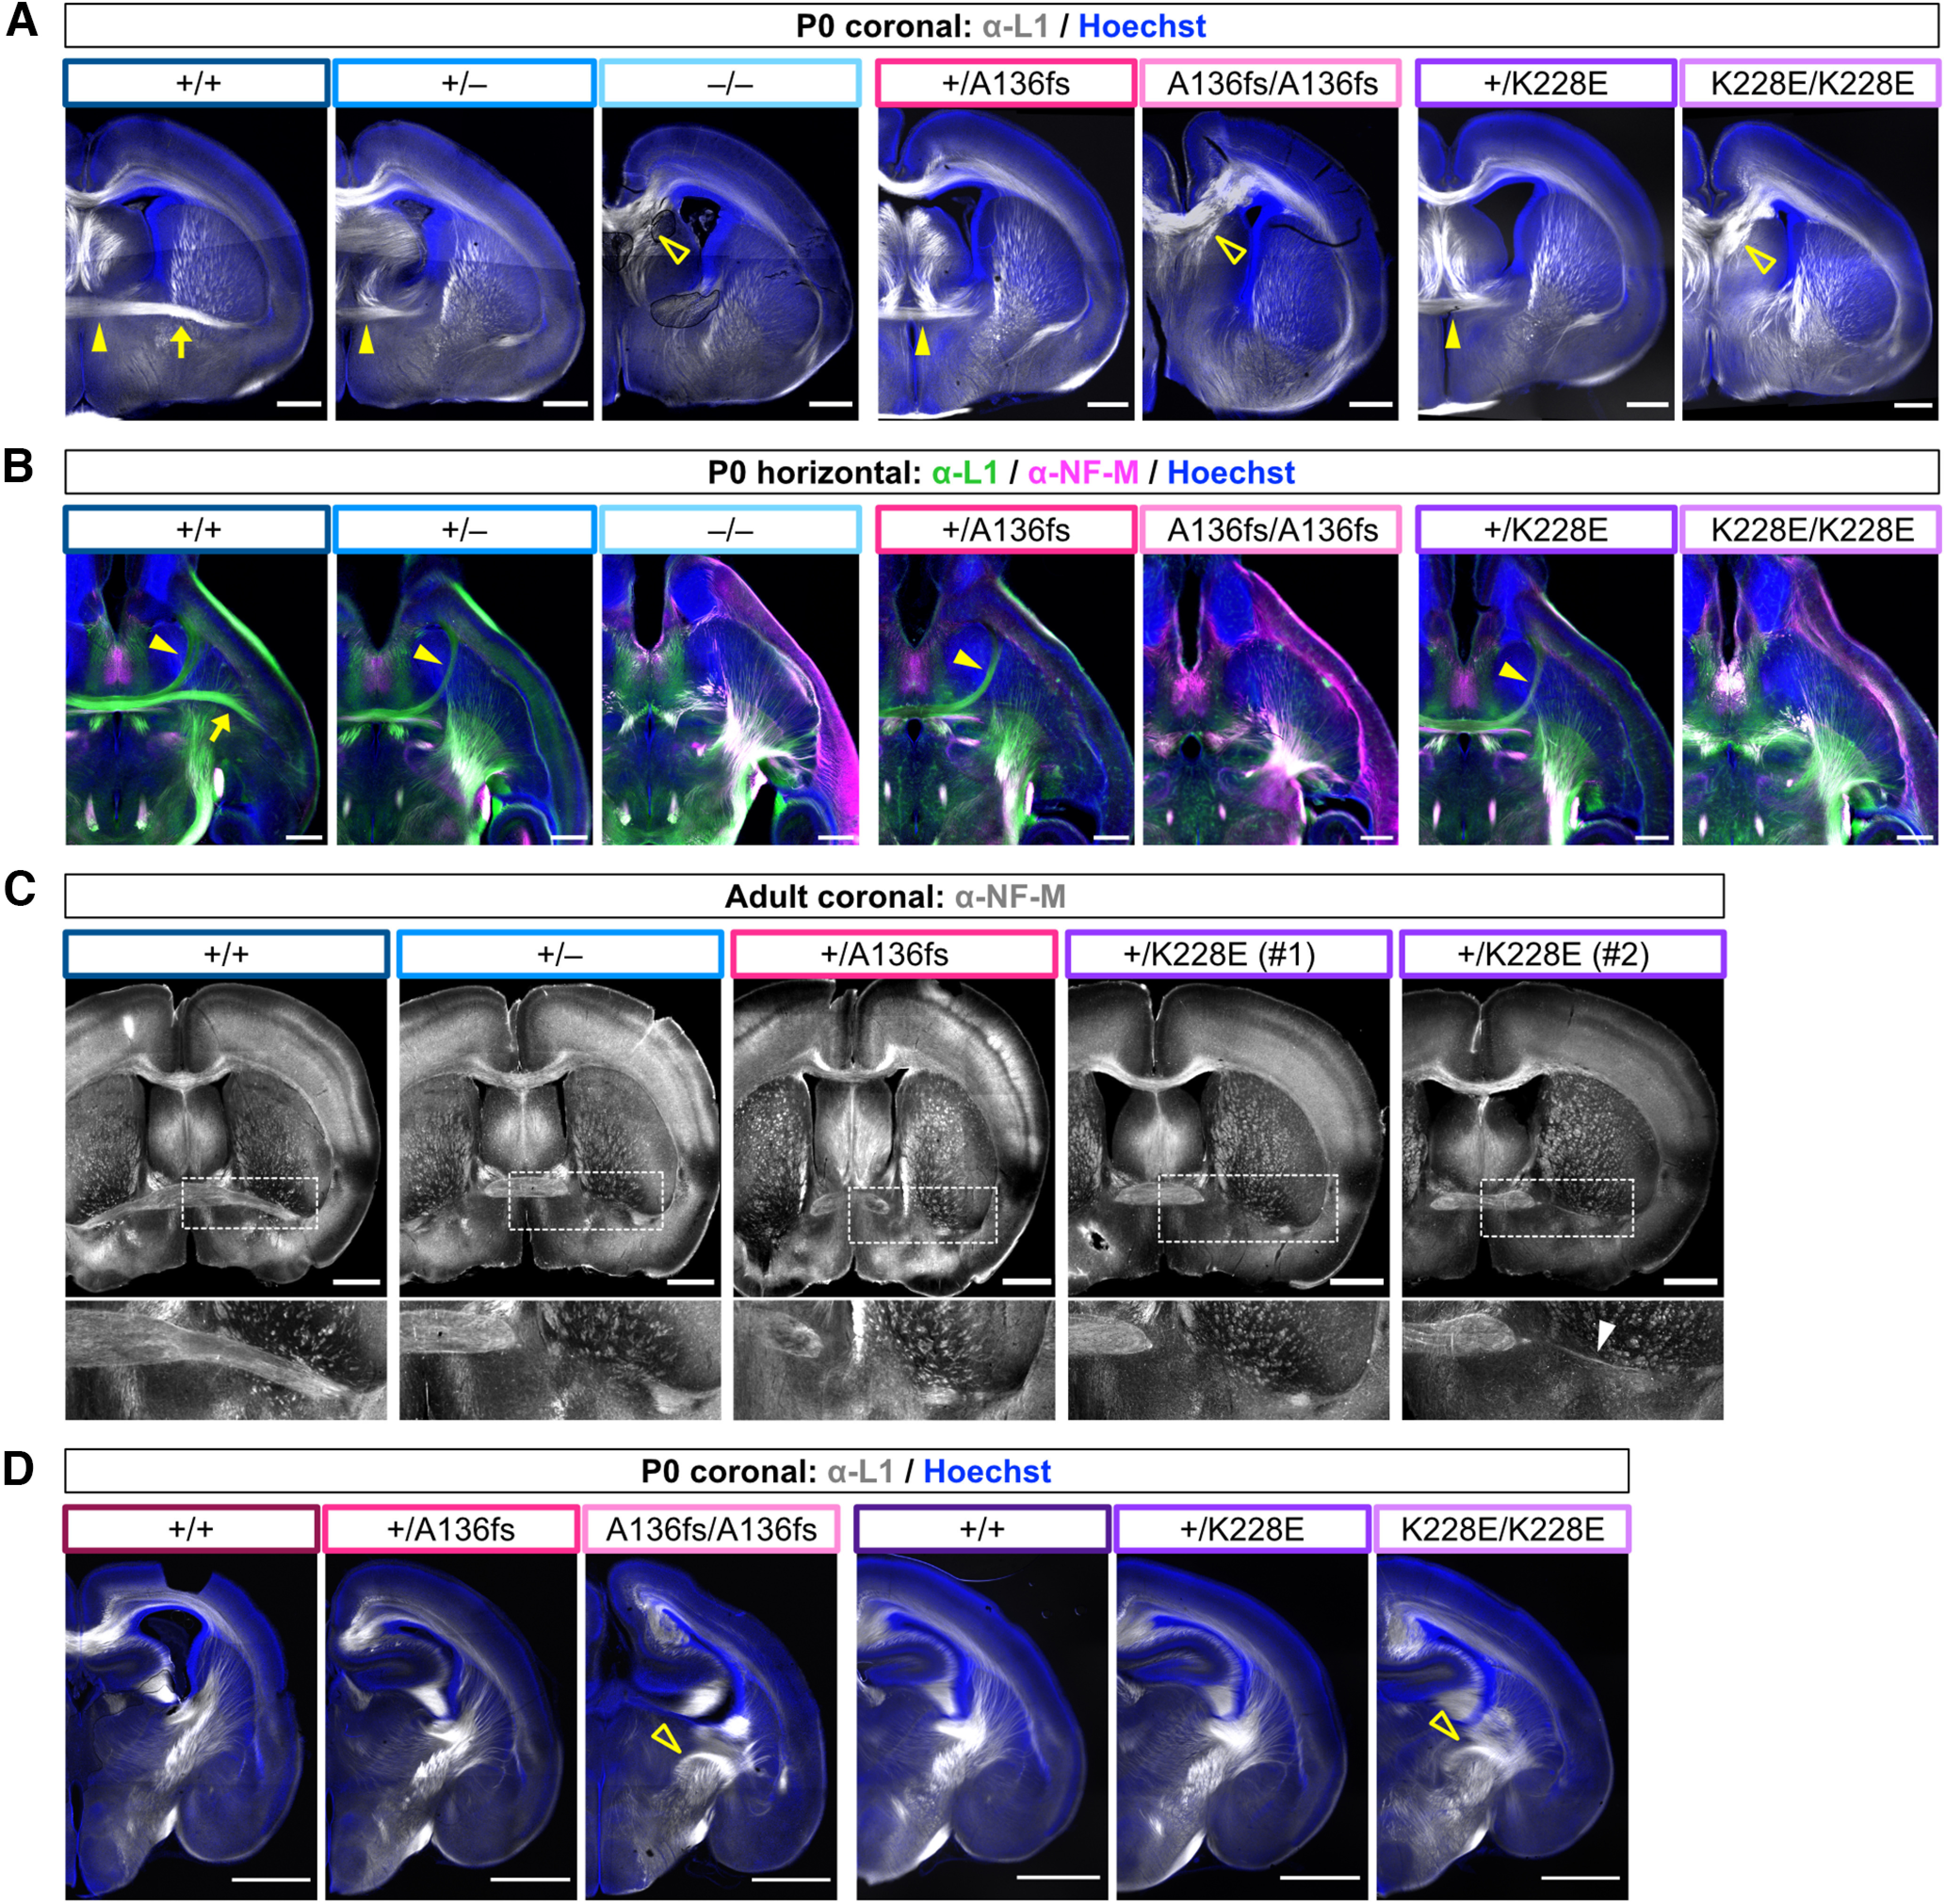
Congruent axon tract defects across Tbr1 mutant mouse lines. A, Immunostaining for axon marker L1 (white) and Hoechst nuclear stain (blue) in P0 coronal brain sections from Tbr1KO and patient mutant lines. Arrow indicates posterior limb of AC in wild-type mouse. Closed arrowhead indicates anterior limb of AC in wild-type and heterozygous mutant mice. Open arrowheads indicate bundled and misdirected callosal axons in homozygous mutants. n = 3–4 mice examined per genotype. B, Immunostaining for L1 (green) and NF-M (magenta) with Hoechst (blue) in P0 horizontal brain sections from Tbr1KO and patient mutant lines. Arrow indicates posterior limb of AC in wild-type mouse. Arrowhead indicates anterior limb of AC in wild-type and heterozygous mutant mice. n = 2 mice examined per genotype. C, Immunostaining for NF-M in adult coronal brain sections from Tbr1KO and patient mutant lines. Inset (dotted lines) shows higher magnification of posterior limb of AC. Arrowhead indicates thin AC posterior limb observed in one Tbr1K228E heterozygote. n = 3–6 mice examined per genotype. D, Immunostaining for L1 (white) and Hoechst (blue) in P0 coronal brain sections from Tbr1 patient lines. Arrowheads indicate abnormal organization of internal capsule axons in homozygotes. Scale bars: A, B, 500 μm; C, D, 1 mm.
In addition to these defects, we identified ectopic L1-labeled axons in the mid-cortex of Tbr1–/–, Tbr1A136fs/A136fs, and Tbr1K228E/K228E at P0 (Fig. 9A). These axons were constrained to the abnormal inner CUX1+ cortical layer in Tbr1–/– mice (Fig. 9B). Because Tbr1–/– mice lack the subplate layer along which thalamic axons normally travel to innervate the cortex (Hevner et al., 2001), we sought to determine whether these ectopic cortical axons were misguided thalamocortical afferents, or whether they originated intracortically. We placed DiI crystals in either the thalamus or the cortex of P0 brains, and we observed DiI-labeled cortical axons forming a narrow mid-cortical tract similar to the L1-labeled ectopic axons (Fig. 9B,C). Thalamic axons, on the other hand, were misrouted ventrally into the external capsule and did not enter the cortex (Fig. 9D). Altogether, our results show congruent axon defects across Tbr1KO and patient mutant mouse lines, including a newly observed intracortical axon defect in homozygous mutants.
Figure 9.
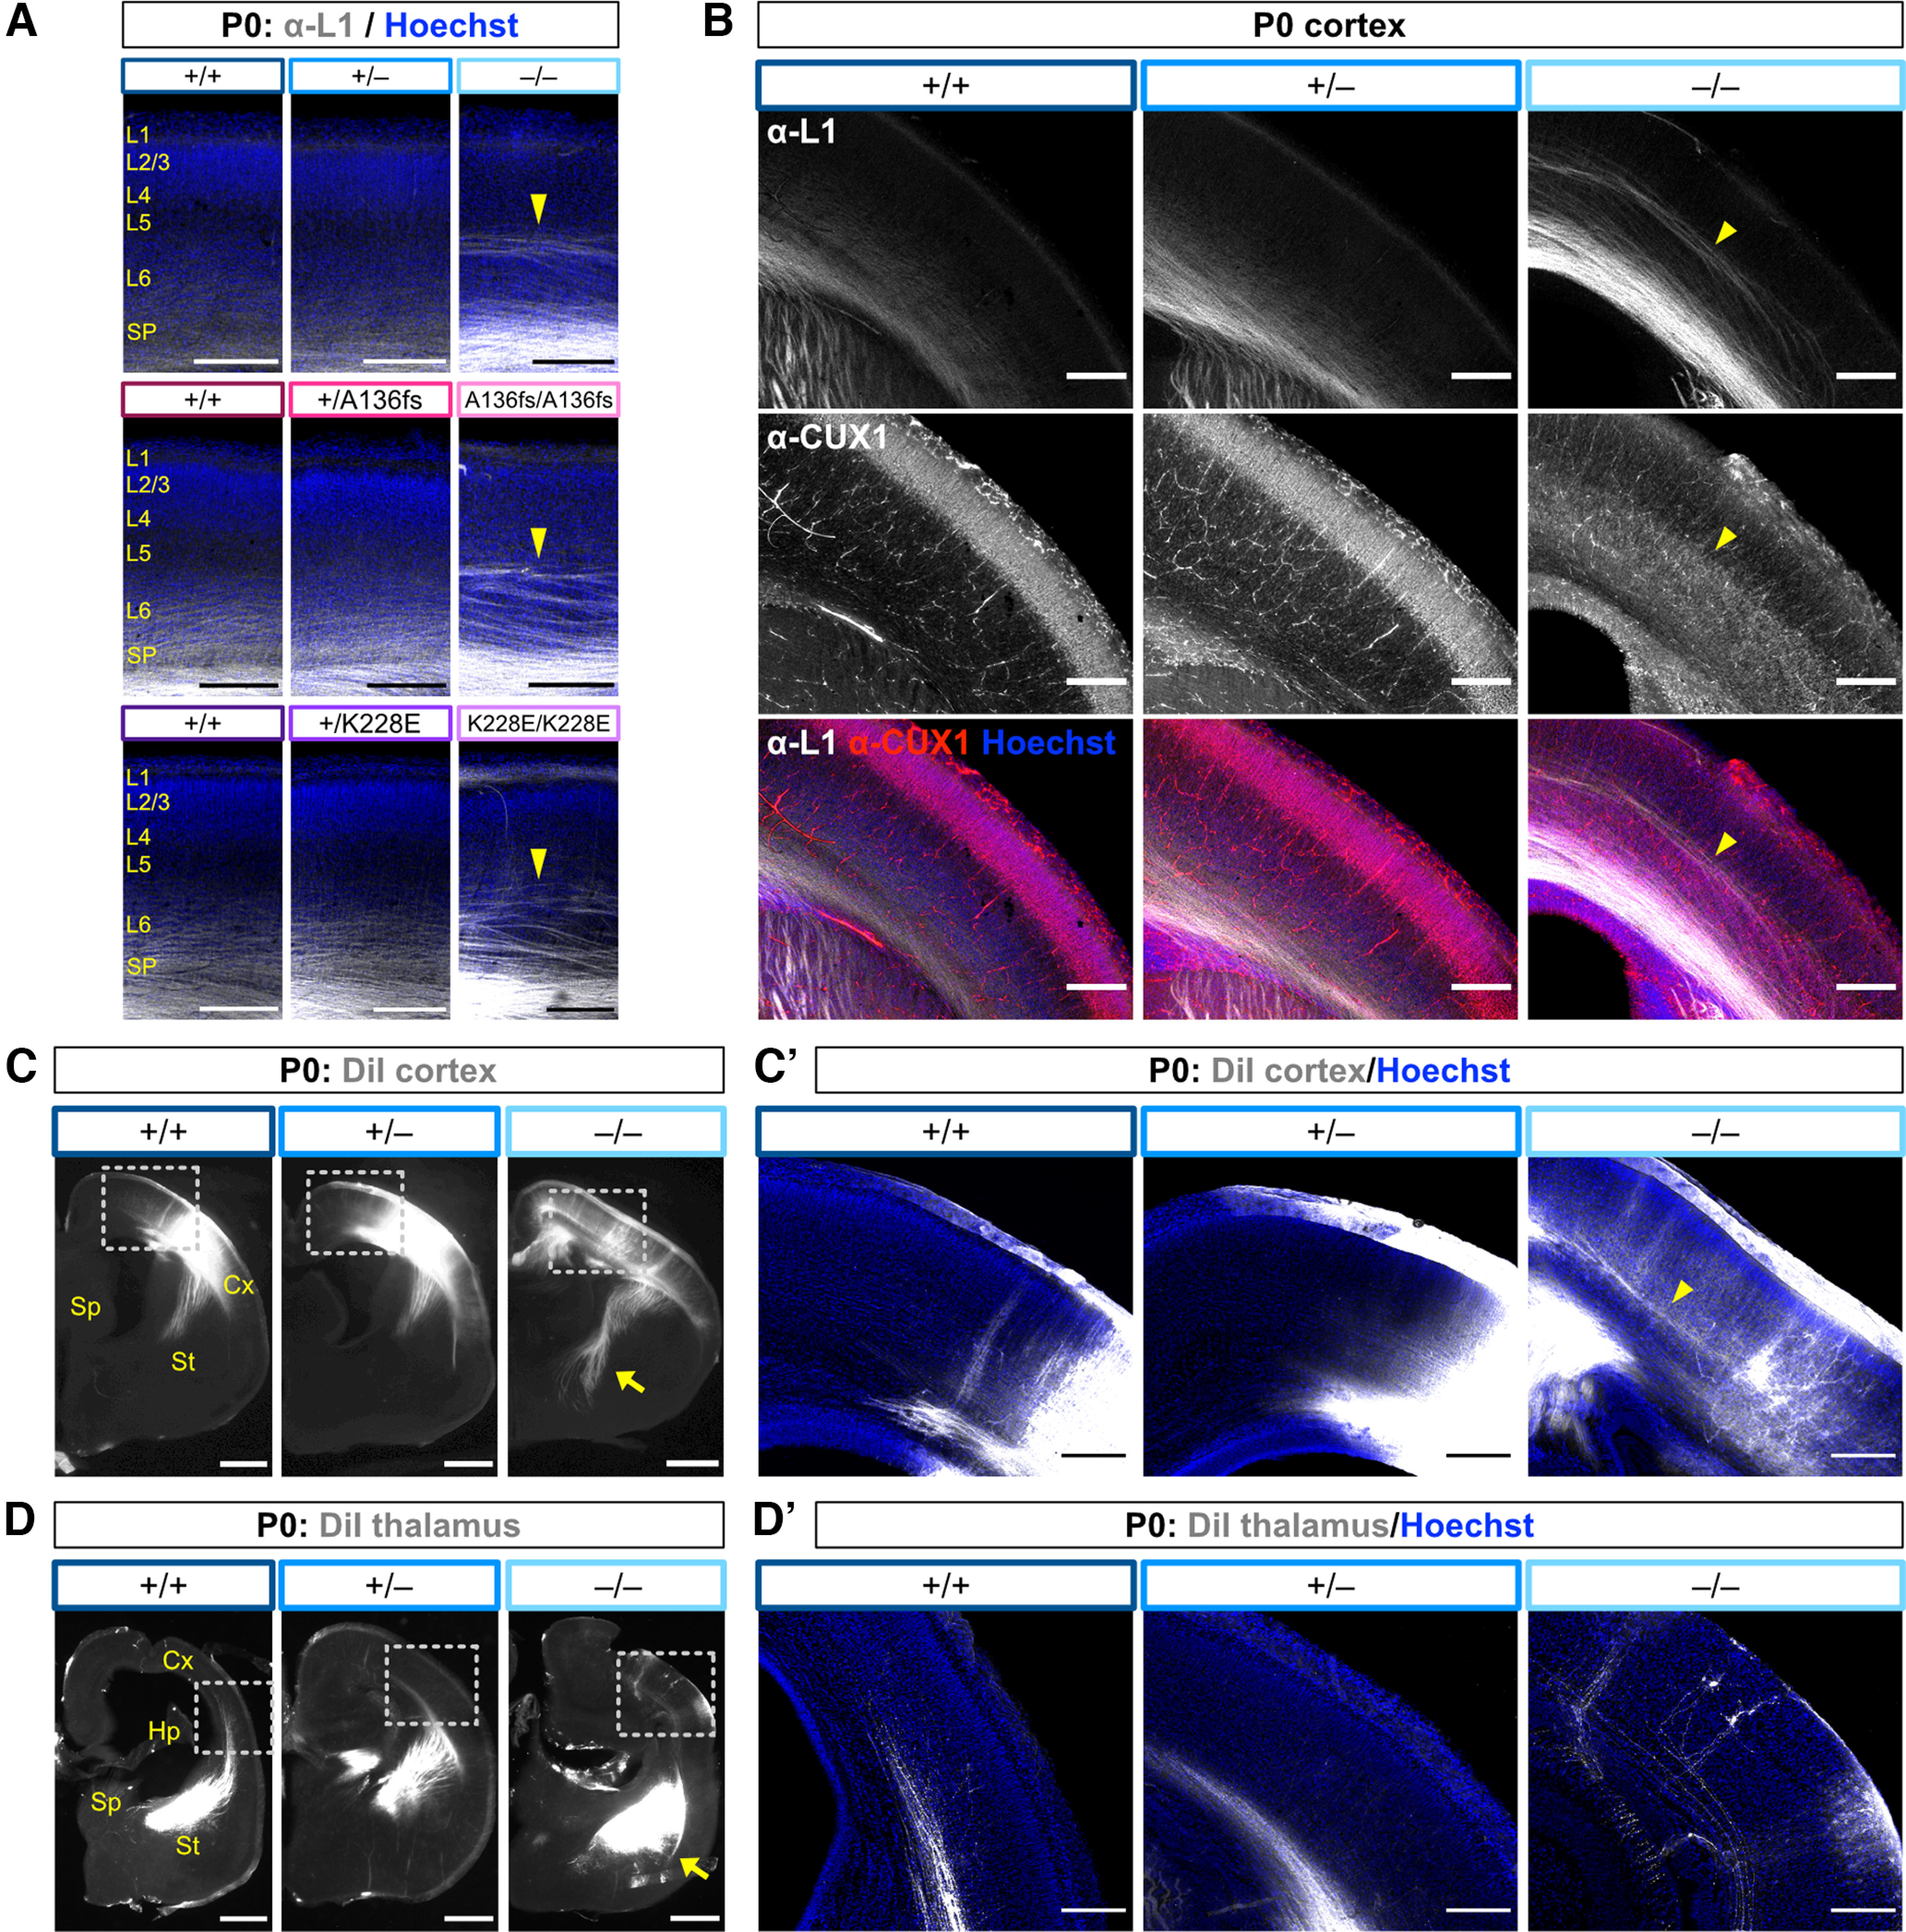
Ectopic axons in Tbr1 homozygous mutants originate within the cortex. A, Immunostaining for axon marker L1 (white) and Hoechst nuclear stain (blue) in P0 Tbr1KO and patient mutant line S1 cortex. Arrowheads indicate ectopic intracortical axons in homozygotes. B, Immunostaining for L1 (white), CUX1 (red), and Hoechst (blue) in P0 S1 cortex from Tbr1KO line. Arrowheads indicate positioning of ectopic axons at CUX1+ layer boundary in homozygous mutants. C–C′, DiI-labeled cortical axons (white) in P0 coronal brain sections from Tbr1KO line. Arrow indicates subcortical axon overgrowth in homozygous mutants. Dotted lines show inset of cortex in C′ with Hoechst counterstain (blue), and arrowhead indicates DiI-labeled cortical axons in homozygous mutant. D–D′, DiI labeled thalamic axons (white) in P0 coronal brain sections from Tbr1KO line. Arrow indicates misrouted thalamic axons in external capsule. Dotted lines show inset of cortex in D′ with Hoechst counterstain (blue). Cx, Cortex; Hp, hippocampus; Sp, septum; St, striatum. Scale bars: A, B, C′, D′, 200 μm; C, D, 500 μm.
Tbr1 KO mice, but not patient mutant mice, show extensive cortical apoptosis
Previous studies of cell survival in Tbr1–/– cortex found a substantial increase in the apoptotic marker CC3 starting by embryonic day 16.5 and continuing to P0 (Bedogni et al., 2010). To examine cortical cell survival in Tbr1KO and patient mutant mice, we immunostained for CC3 at P0. WT and heterozygous mutant mice of each line showed very few CC3+ cells at this time point (Fig. 10A,B). However, while we saw drastically increased CC3+ cell density in Tbr1–/– cortex, we saw a limited increase of CC3+ cells in Tbr1A136fs/A136fs and no increase in Tbr1K228E/K228E (Tbr1KO: F(2,6) = 13.2, p = 0.006; Tbr1A136fs: F(2,6) = 17.5, p = 0.003; Tbr1K228E: F(2,9) = 1.18, p = 0.350; ANOVA). Furthermore, CC3+ cells in Tbr1–/– cortex spanned multiple cortical areas, while CC3+ cells in Tbr1A136fs/A136fs were restricted to the piriform area (Fig. 10A, arrowhead). When we costained for CC3 and L5 marker CTIP2 in Tbr1–/– cortex, we found that CC3+ cells were not confined to the CTIP2+ layer, and that 16.8% of the total CC3+ cells were CTIP2+ (Fig. 10C,D). Thus, homozygosity of the Tbr1 exon 2-3 knock-out allele causes widespread cortical apoptosis, while patient mutant alleles A136PfsX80 and K228E have limited impacts on cortical cell survival.
Figure 10.
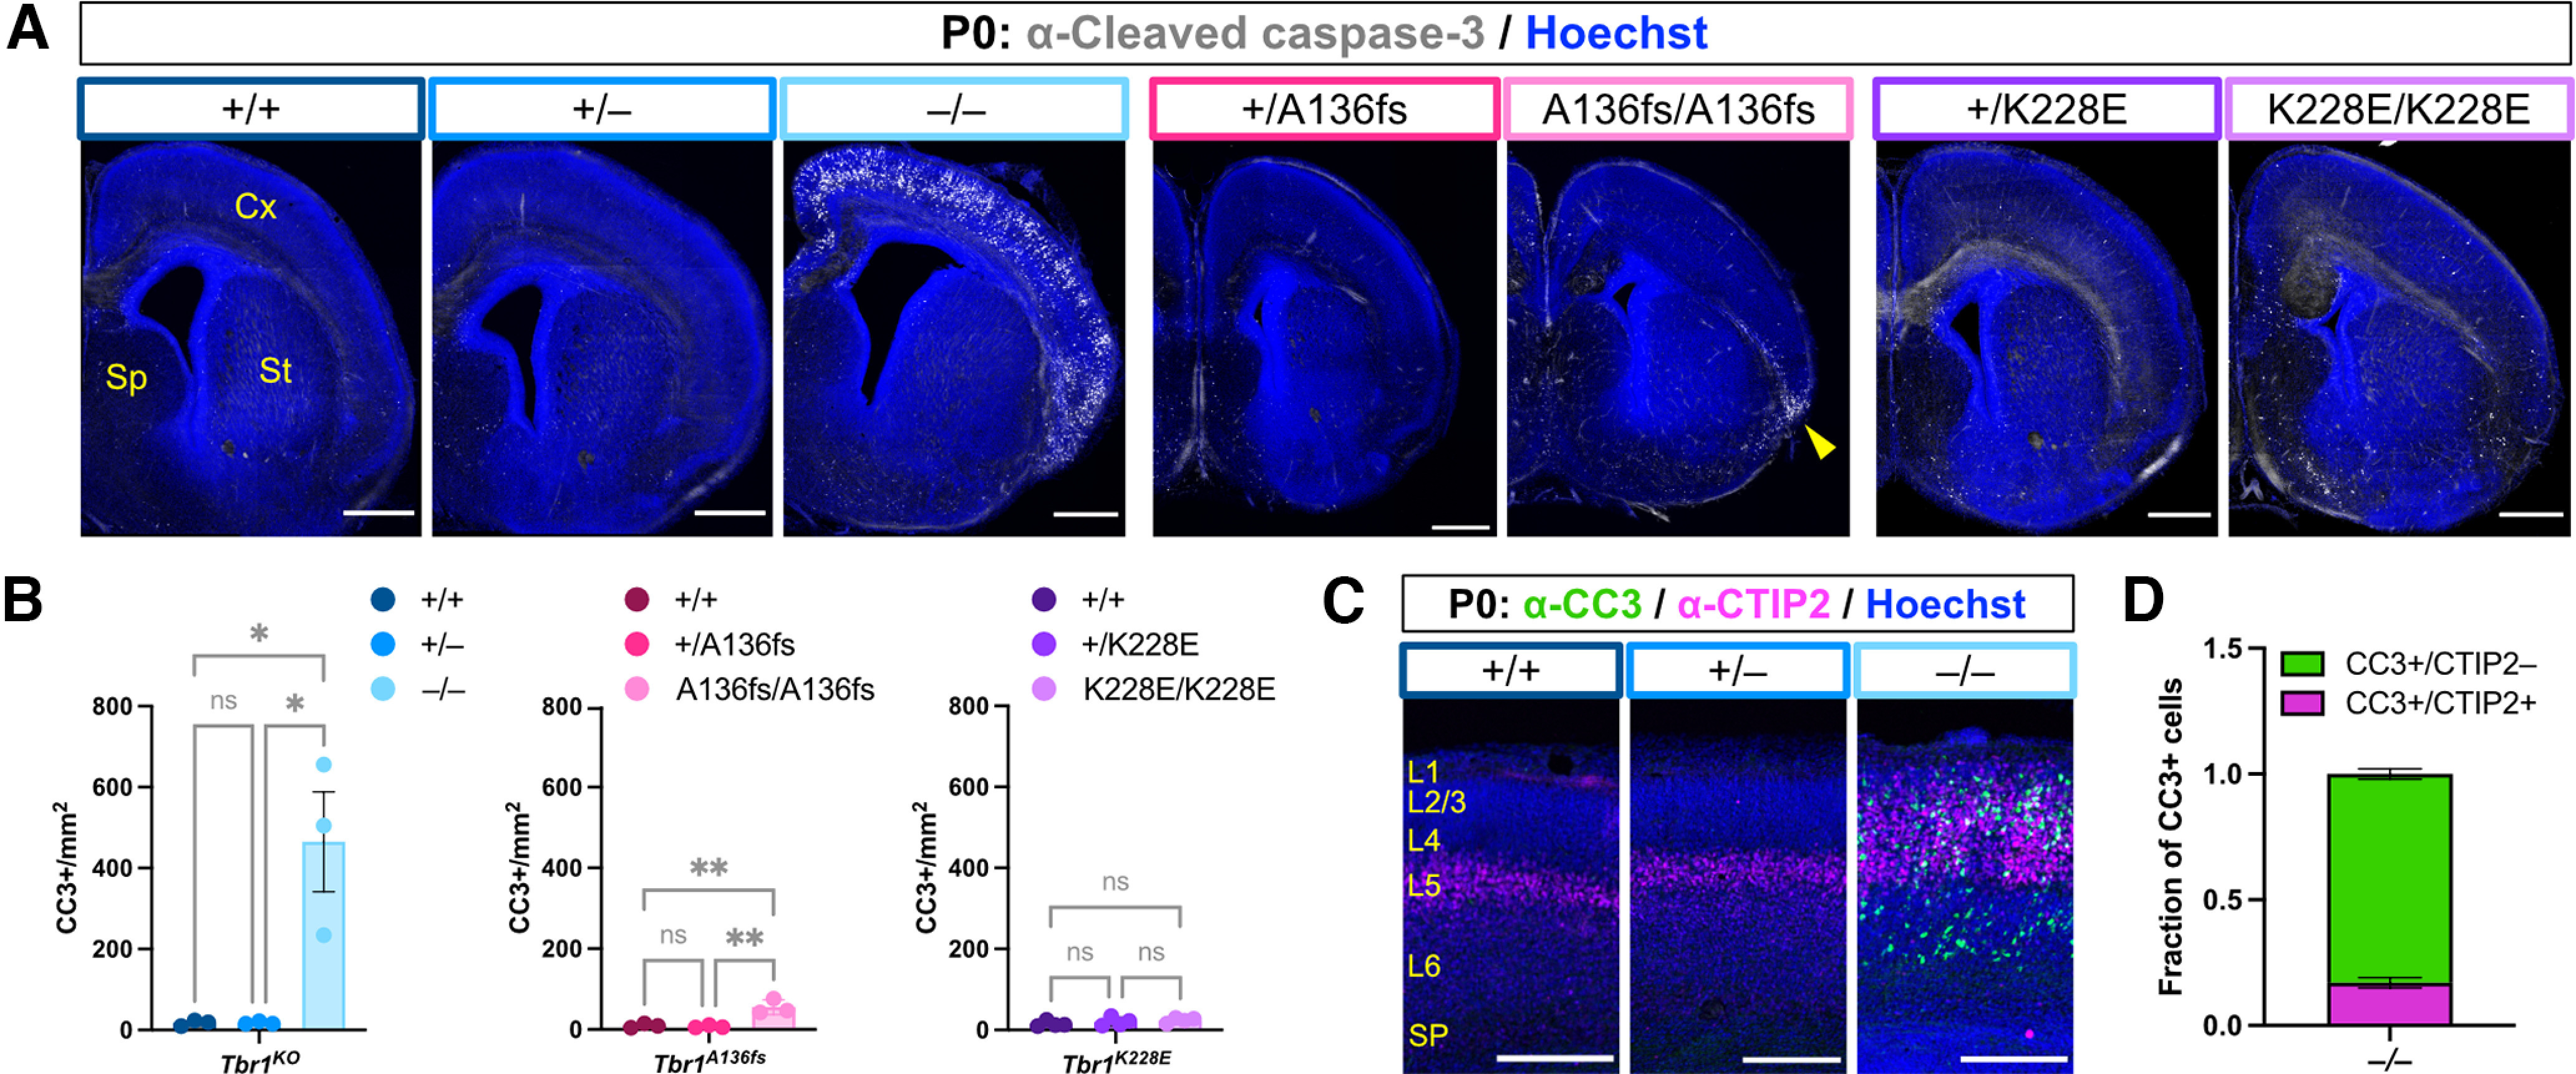
Tbr1 knock-out mice, but not patient mutant mice, show widespread cortical apoptosis. A, B, Immunostaining and quantification of CC3+ apoptotic cells (white) in P0 cortex from Tbr1KO and patient mutant mouse lines (n = 3 mice/genotype). Hoechst nuclear stain is shown in blue. C, D, Immunostaining and quantification of CC3+ apoptotic cells (green) colabeled with CTIP2 (magenta) in cortex of P0 Tbr1–/– mice (n = 3). Hoechst stain is shown in blue. Scale bars: A, 500 μm; C, 200 μm. Data are plotted as the mean ± SEM. Each dot represents one animal. One-way ANOVA with Tukey's multiple-comparisons test was used in B. *p < 0.05; **p < 0.01. ns, Not significant.
Discussion
In this study, we sought to understand the etiology of TBR1-related neurodevelopmental conditions via modeling of patient-specific de novo mutations in mice. Comparing directly with Tbr1KO mice previously used to study this transcription factor, we identified a number of shared and distinct phenotypic effects (Fig. 11A). The de novo frameshift mutant A136PfsX80 (A136fs) generally phenocopied the KO, suggesting that this mutation is loss-of-function, while the de novo missense mutant K228E showed cortical disorganization distinct from KO and A136fs. One key difference among all three Tbr1 mutant lines was the extent of cortical apoptosis, with homozygous KO causing severe apoptosis, A136fs limited apoptosis, and K228E normal apoptosis. In addition to these discordant phenotypes, we found several congruent defects across Tbr1 lines in olfactory bulb development, axon tract formation, and CTIP2 and NF-M levels. These findings reveal molecular and cellular processes sensitive to Tbr1 gene disruption regardless of mutation type, suggesting core biomarkers or therapeutic targets for TBR1-related conditions. Furthermore, identification of mutation-specific effects may lend insight into the phenotypic variability of these conditions.
Figure 11.
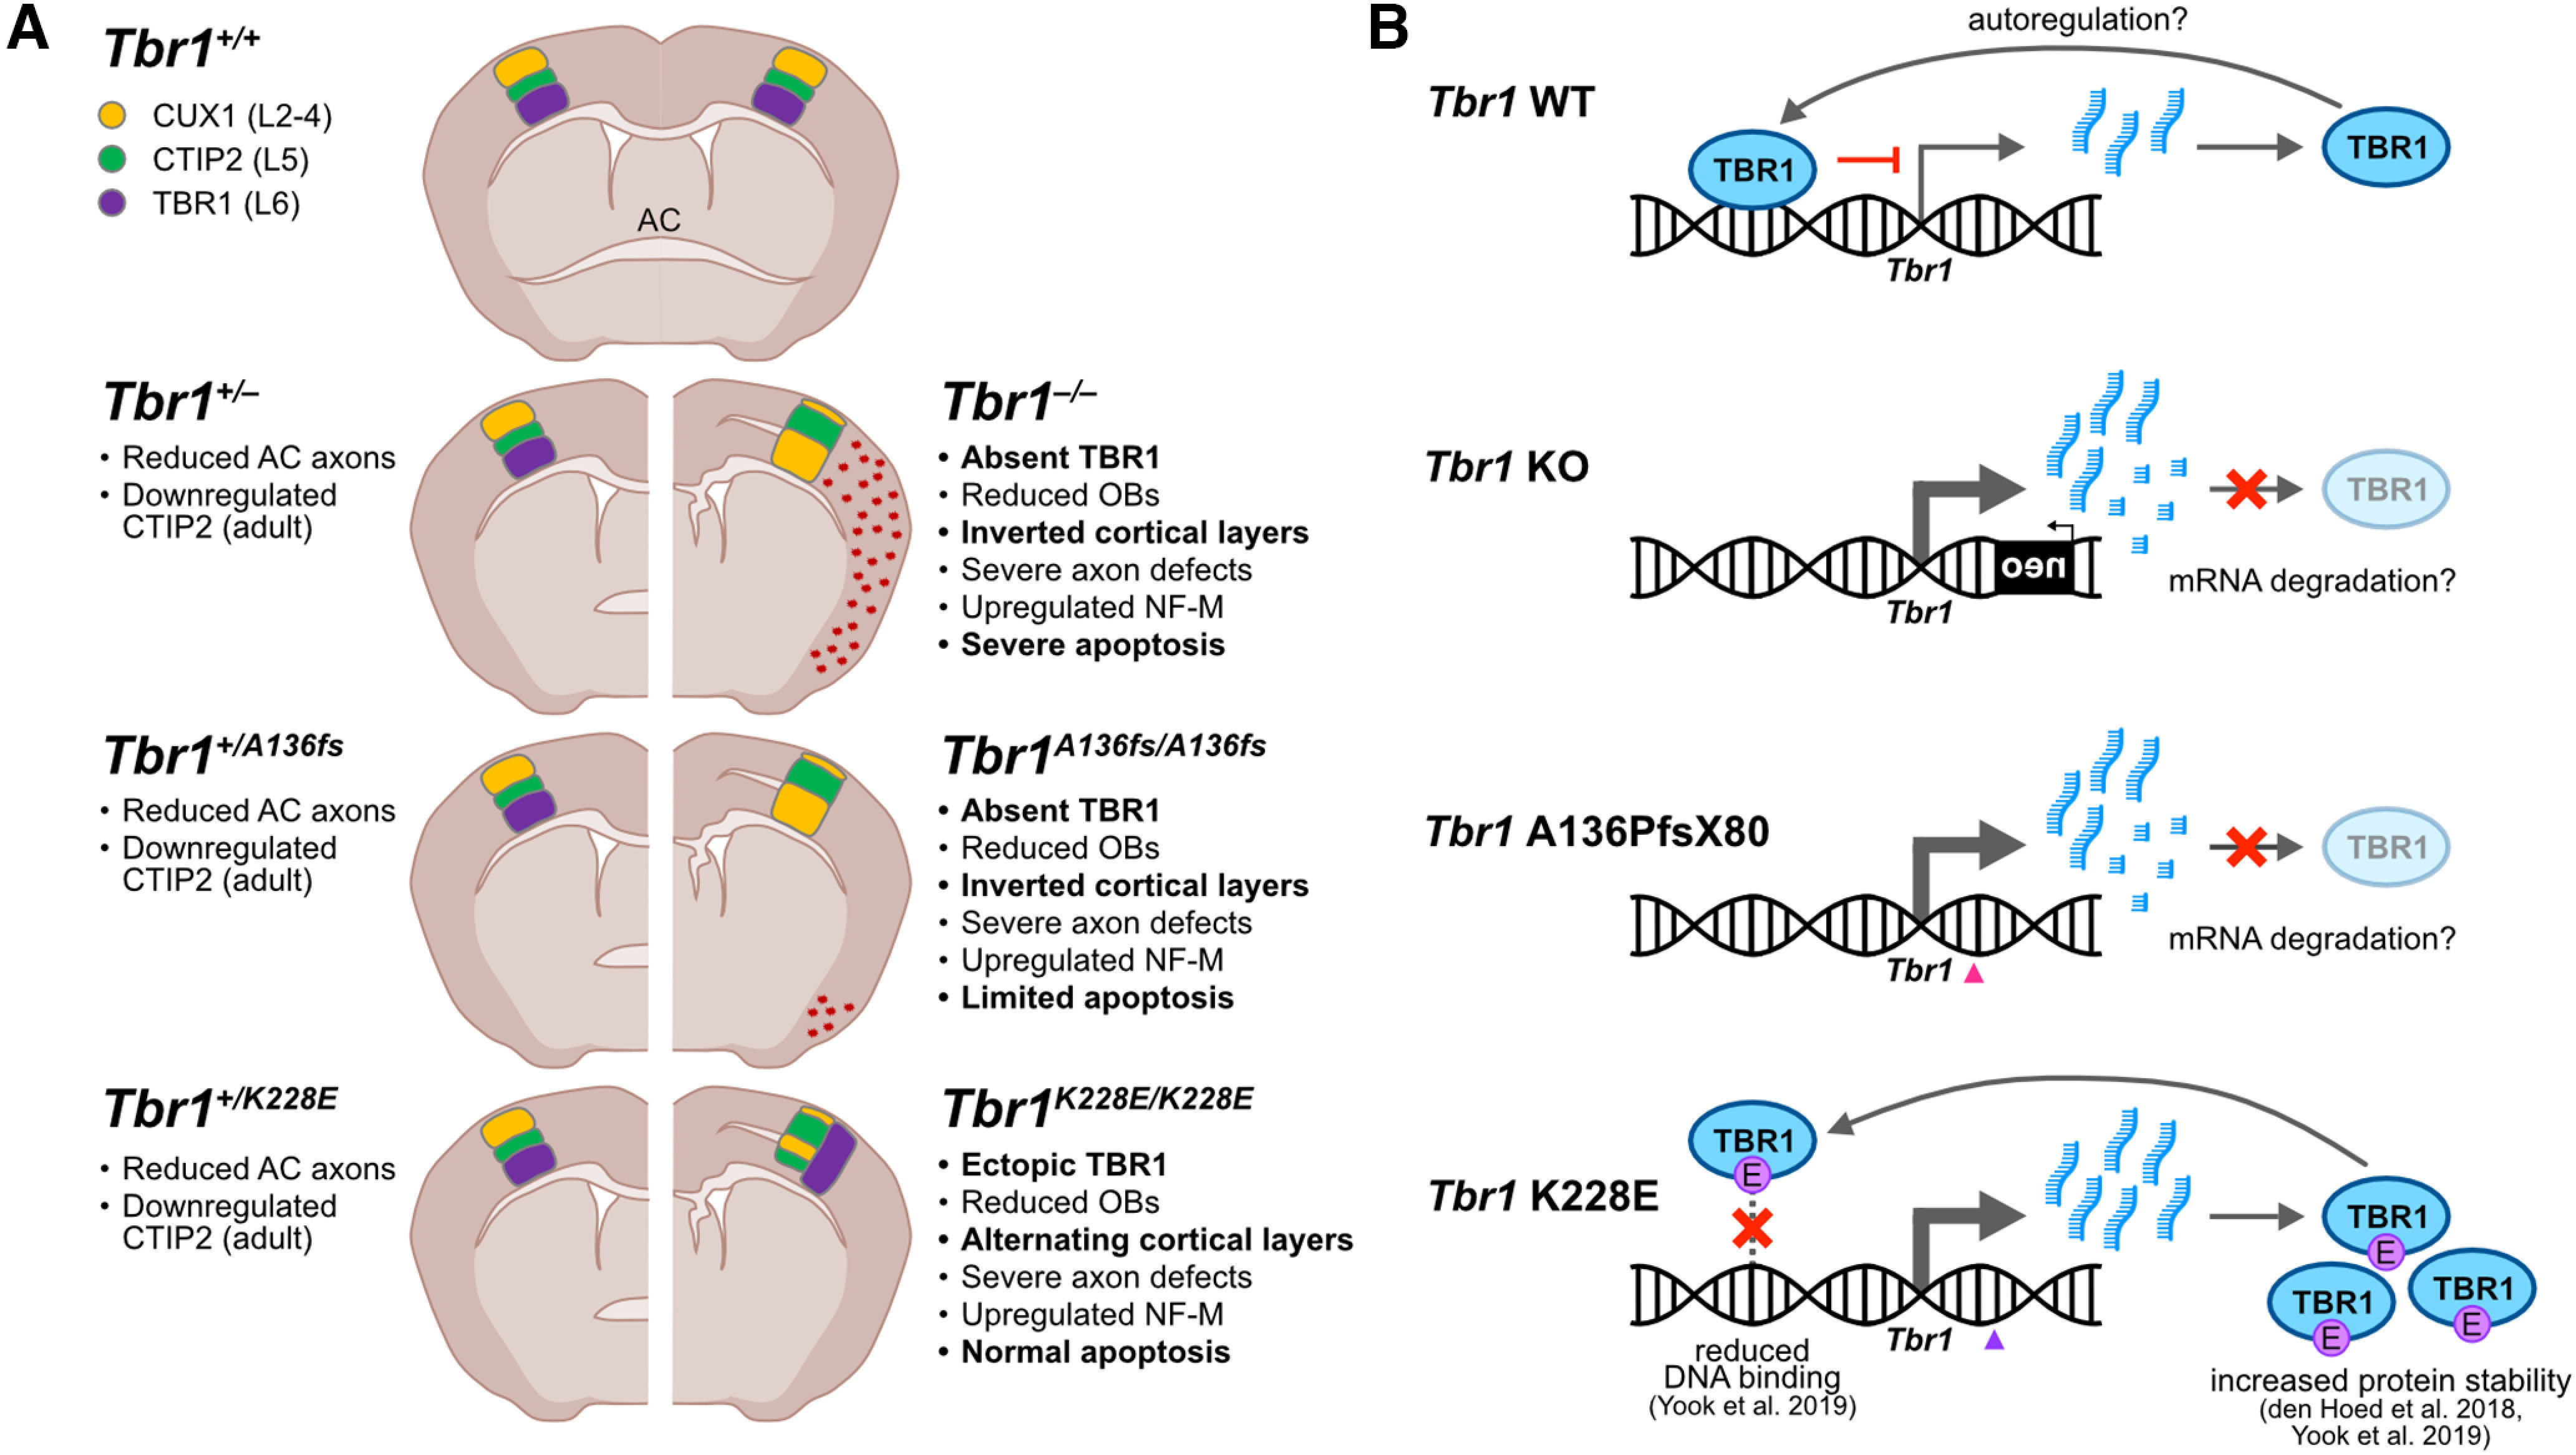
Summary of phenotypic findings and proposed molecular mechanisms in Tbr1 mutant mice. A, Summary of phenotypic findings in Tbr1KO line and patient mutant mouse lines Tbr1A136fs and Tbr1K228E compared with wild type. Phenotypes listed in bold text are discordant across the three mutant lines. B, Proposed molecular effects of Tbr1KO and patient mutations on the regulation of TBR1 levels in postnatal cortex. TBR1 may negatively autoregulate its expression, leading to transcriptional upregulation in Tbr1 mutant mice. Transcripts from the KO and A136fs alleles may be degraded, leading to the absence of TBR1 protein, while K228E transcripts persist and lead to high protein levels. OB, Olfactory bulb.
Construct validity of Tbr1 mouse models for neurodevelopmental conditions
Upon the association of TBR1 mutations with neurodevelopmental conditions, several Tbr1 mutant mouse models were generated to study their underlying biological mechanisms. Mice with one copy of Tbr1 disrupted by insertion of a PGK-neo cassette were used to model human TBR1 haploinsufficiency (Bulfone et al., 1998; Huang et al., 2014). To identify autism-related functions of Tbr1 within cortical neuron subpopulations, Cre-loxP recombination was used to delete Tbr1 in layer 5 or layer 6 during late embryonic to early postnatal development (Fazel Darbandi et al., 2018, 2020, 2022). Cre-loxP was also used to generate mice carrying the K228E patient mutation before our study (Yook et al., 2019). While these models have revealed potential molecular and cellular mechanisms underlying TBR1-related conditions, their construct validity is limited by the retention of genomic artifacts (i.e., neo cassette, loxP sites) and/or the timing of Tbr1 deletion several days after its initial expression. With CRISPR genome editing, we addressed these potential limitations in our Tbr1 models by incorporating the exact patient mutations into the mouse genome without the inclusion of additional sequences.
These differences in mouse line generation methods could explain the phenotypic discrepancies between our CRISPR-generated Tbr1 models and previous models. For example, the severe cortical apoptosis unique to Tbr1–/– mice (Fig. 10) could potentially result from the production of an aberrant transcript from the neo cassette, as was previously reported for Men1 KO mice (Scacheri et al., 2001; Bedogni et al., 2010). Alternatively, the neo cassette could disrupt regulatory elements within the Tbr1 locus for nearby genes, in which case the Tbr1 KO line could still serve to model intragenic TBR1 deletions (Olson et al., 1996; Pham et al., 1996; Meier et al., 2010; Jin et al., 2021). Another example of a potential off-target effect is the altered interneuron distribution seen in previously generated K228E mutants, which retain an intronic loxP site (Yook et al., 2019). While this study found a shifted distribution of parvalbumin interneurons from superficial to deep layers in Tbr1+/K228E cortex, our CRISPR-generated Tbr1+/K228E mice showed no changes to the distribution of cortical interneurons (Fig. 7). However, this discrepancy could also arise from differences in cortical area examined, as the prior study analyzed medial prefrontal cortex while we analyzed somatosensory cortex.
Despite the potential limitations of previously generated Tbr1 mouse models, they can recapitulate features of human TBR1-related conditions. Namely, in the study by Huang et al. (2014), Tbr1+/– mice showed reduction of the AC, a phenotype later observed in seven of seven individuals of a TBR1 patient cohort examined by MRI (Nambot et al., 2020). Analysis of Tbr1+/– mice found an absence of the posterior limb of the AC using histologic stains, and axon labeling approaches showed severe reduction of the interamygdalar axons comprising this structure (Huang et al., 2014). A follow-up study also found a reduction of the anterior limb of the AC, which connects the two olfactory bulbs (Huang et al., 2019). When we immunostained for axon markers L1 and NF-M, Tbr1+/A136fs and Tbr1+/K228E mice lacked an apparent posterior limb, further reinforcing that this brain structure is highly sensitive to the mutation of one Tbr1 copy (Fig. 8). We speculate that the posterior limb defect in Tbr1 patient mutation mice could also be attributed to diminished interamygdalar axons, considering their similarity to Tbr1+/– mice analyzed alongside. Thus, Tbr1 mutant mice with inserted DNA elements can be valid for modeling TBR1 deficiency, but results should be interpreted with caution and, if possible, validated in multiple Tbr1 mutant mouse lines.
In addition to our main findings, we observed that the p.E348_P353del (Δ6aa) mutation did not alter TBR1 levels (Figs. 2, 3) or cortical layer formation (Fig. 4). This result, combined with the low conservation of these residues among mouse T-box proteins (Fig. 1), suggests that substitutions or in-frame deletions within this region may not substantially impact TBR1 function. Accordingly, the reported human missense variants T350A, S351R, and P353A may be of low clinical impact as predicted by PolyPhen and SIFT analyses (Extended Data Fig. 1-1; Landrum et al., 2018; Karczewski et al., 2020). In contrast, the nonsense mutations S351X and Q352X show higher pathogenicity predictions, and the S351X protein was verified to be dysfunctional in vitro (Deriziotis et al., 2014). While TBR1-Δ6aa functionality is sufficient for corticogenesis, we cannot rule out subtler effects of this deletion on cortical development or neuronal function.
Potential Tbr1 autoregulation in early postnatal cortex
Our analyses of Tbr1 transcript and TBR1 protein levels provide insights into the regulation of this gene in early postnatal cortex (Fig. 11B). In P0 Tbr1KO and Tbr1A136fs mutants, transcript changes did not mirror protein changes: heterozygotes showed a 25–30% reduction in TBR1 protein but <8% reduction in Tbr1 transcript, while homozygotes showed nearly 100% reduction in protein but only 25–60% reduction in transcript (Fig. 2). Based on these results, we speculate that TBR1 negatively autoregulates its expression in postnatal cortex, as transcription factors commonly perform autoregulatory functions to ensure proper abundance in cells (Crews and Pearson, 2009). Supporting this possibility, TBR1-bound sites near the Tbr1 gene (i.e., potential autoregulatory elements) have been previously identified using ChIP (chromatin immunoprecipitation)-sequencing (seq) assays in developing mouse cortex (Notwell et al., 2016; Fazel Darbandi et al., 2018). In Tbr1KO and Tbr1A136fs mutants, transcripts from the mutant allele may undergo nonsense-mediated decay or other mRNA degradation processes, as suggested by the low A136fs transcript levels in Figure 2H, leading to reduced TBR1 protein levels and reduced negative autoregulation. In Tbr1K228E mutants, the K228E mutation likely inhibits TBR1 binding to DNA, also leading to reduced negative autoregulation and increased Tbr1 transcript/protein levels (Yook et al., 2019). The overabundance of TBR1 protein in these mice may also result from increased stability of the K228E protein (den Hoed et al., 2018; Yook et al., 2019).
Failure of negative autoregulation could also contribute to the unexpected ectopic TBR1 in nearly all cortical neurons of Tbr1K228E/K228E mice (Fig. 3). It has been postulated that the activation of TBR1 is an obligatory step in the differentiation of cortical radial glia into postmitotic neurons (Englund et al., 2005). Supporting this, single-cell RNA-seq of mouse corticogenesis found that cells born during the neurogenic period (embryonic days 12–15) highly express Tbr1 on differentiation (http://genebrowser.unige.ch/telagirdon/; Telley et al., 2019). Newborn neurons then either maintain or repress Tbr1 depending on their subtype specification: Tbr1 is maintained in L6 corticothalamic neurons, while in other neuronal subtypes Tbr1 is repressed by transcription factors including BCL11A (CTIP1) and FOXG1 (Toma et al., 2014; Cánovas et al., 2015; Liu et al., 2022). In noncorticothalamic neurons, negative autoregulation by TBR1 could perhaps then serve to inactivate its own expression through direct binding with its repressor BCL11A (den Hoed et al., 2018). Exploration of this hypothesis could lend important insights into TBR1-dependent regulatory networks and neuronal fate specification in the developing cortex.
Future directions
Future studies using patient-specific Tbr1 mutant mice to model human conditions should focus on construct validity for underlying mechanisms, face validity for symptoms, and predictive validity for therapeutics. Molecular profiles and physiological properties of neurons should be compared across Tbr1 mouse lines to identify shared etiologies. In addition, behavioral profiles should be characterized for comparison to TBR1-related conditions, particularly for anxiety, aggression, epilepsy, and other debilitating symptoms (Nambot et al., 2020). Testing therapeutics for such symptoms in Tbr1 patient mutant mice could greatly benefit patients with TBR1-related or other neurodevelopmental conditions. Finally, beyond these translational directions, studying Tbr1 patient mutant mice can inform our basic understanding of corticogenesis. We identified mutation-specific cortical layering defects, which hint at differential impacts on TBR1+/Reelin+ Cajal–Retzius cells during early cortical development (Fig. 4; Hevner et al., 2001). Furthermore, we identified ectopic intracortical axons in Tbr1 mutants, but whether this defect arises cell autonomously from Tbr1-deficient projection neurons or is secondary to cortical disorganization in these mice remains unclear (Fig. 9). Future studies examining TBR1 functions in different cortical neuron subtypes can shed light on these fundamental neurodevelopmental processes.
Footnotes
This work was supported by National Institutes of Health Grant R01-MH-113926 (to B.J.O.) and an Oregon Health & Science University (OHSU) Shared Resources Pilot Award (to B.J.O.). We thank current and former members of the O'Roak, Wright, and Adey laboratory groups for feedback and technical support, including Dominica Cao, Brooke DeRosa, Sara Evans-Dutson, Bridget Fitzgerald, Destine Krenik, Cierra LeBlanc, Neville Lee, Amanda Mar, Ryan Mulqueen, Andrew Nishida, and Lindsay Wourms. We also thank Yingming Wang at the OHSU Transgenic Mouse Models Core for assistance with generating mouse lines. In addition, we thank the following current and past members of the BRAINS R01 Advisory Committee: Eric Fombonne, Marc Freeman, Gail Mandel, Tomasz Nowakowski, and Soo-Kyung Lee.
The authors declare no competing financial interests.
References
- Aida T, Chiyo K, Usami T, Ishikubo H, Imahashi R, Wada Y, Tanaka KF, Sakuma T, Yamamoto T, Tanaka K (2015) Cloning-free CRISPR/Cas system facilitates functional cassette knock-in in mice. Genome Biol 16:87. 10.1186/s13059-015-0653-x [DOI] [PMC free article] [PubMed] [Google Scholar]
- American Psychiatric Association (2013) Neurodevelopmental disorders. In: Diagnostic and statistical manual of mental disorders: DSM-5, Ed 5. Washington, DC: American Psychiatric Association. [Google Scholar]
- Bedogni F, Hodge RD, Elsen GE, Nelson BR, Daza RA, Beyer RP, Bammler TK, Rubenstein JL, Hevner RF (2010) Tbr1 regulates regional and laminar identity of postmitotic neurons in developing neocortex. Proc Natl Acad Sci U|S|A 107:13129–13134. 10.1073/pnas.1002285107 [DOI] [PMC free article] [PubMed] [Google Scholar]
- Bulfone A, Wang F, Hevner R, Anderson S, Cutforth T, Chen S, Meneses J, Pedersen R, Axel R, Rubenstein JL (1998) An olfactory sensory map develops in the absence of normal projection neurons or GABAergic interneurons. Neuron 21:1273–1282. 10.1016/s0896-6273(00)80647-9 [DOI] [PubMed] [Google Scholar]
- Cánovas J, Berndt FA, Sepúlveda H, Aguilar R, Veloso FA, Montecino M, Oliva C, Maass JC, Sierralta J, Kukuljan M (2015) The specification of cortical subcerebral projection neurons depends on the direct repression of TBR1 by CTIP1/BCL11a. J Neurosci 35:7552–7564. 10.1523/JNEUROSCI.0169-15.2015 [DOI] [PMC free article] [PubMed] [Google Scholar]
- Concordet J-P, Haeussler M (2018) CRISPOR: intuitive guide selection for CRISPR/Cas9 genome editing experiments and screens. Nucleic Acids Res 46:W242–W245. 10.1093/nar/gky354 [DOI] [PMC free article] [PubMed] [Google Scholar]
- Crews ST, Pearson JC (2009) Transcriptional autoregulation in development. Curr Biol 19:R241–R246. 10.1016/j.cub.2009.01.015 [DOI] [PMC free article] [PubMed] [Google Scholar]
- den Hoed J, Sollis E, Venselaar H, Estruch SB, Deriziotis P, Fisher SE (2018) Functional characterization of TBR1 variants in neurodevelopmental disorder. Sci Rep 8:14279. 10.1038/s41598-018-32053-6 [DOI] [PMC free article] [PubMed] [Google Scholar]
- Deriziotis P, O'Roak BJ, Graham SA, Estruch SB, Dimitropoulou D, Bernier RA, Gerdts J, Shendure J, Eichler EE, Fisher SE (2014) De novo TBR1 mutations in sporadic autism disrupt protein functions. Nat Commun 5:4954. 10.1038/ncomms5954 [DOI] [PMC free article] [PubMed] [Google Scholar]
- Englund C, Fink A, Lau C, Pham D, Daza RA, Bulfone A, Kowalczyk T, Hevner RF (2005) Pax6, Tbr2, and Tbr1 are expressed sequentially by radial glia, intermediate progenitor cells, and postmitotic neurons in developing neocortex. J Neurosci 25:247–251. 10.1523/JNEUROSCI.2899-04.2005 [DOI] [PMC free article] [PubMed] [Google Scholar]
- Fazel Darbandi S, Robinson Schwartz SE, Qi Q, Catta-Preta R, Pai EL, Mandell JD, Everitt A, Rubin A, Krasnoff RA, Katzman S, Tastad D, Nord AS, Willsey AJ, Chen B, State MW, Sohal VS, Rubenstein JLR (2018) Neonatal Tbr1 dosage controls cortical layer 6 connectivity. Neuron 100:831–845.e7. 10.1016/j.neuron.2018.09.027 [DOI] [PMC free article] [PubMed] [Google Scholar]
- Fazel Darbandi S, Robinson Schwartz SE, Pai EL-L, Everitt A, Turner ML, Cheyette BNR, Willsey AJ, State MW, Sohal VS, Rubenstein JLR (2020) Enhancing WNT signaling restores cortical neuronal spine maturation and synaptogenesis in Tbr1 mutants. Cell Rep 31:107495. 10.1016/j.celrep.2020.03.059 [DOI] [PMC free article] [PubMed] [Google Scholar]
- Fazel Darbandi S, Nelson AD, Pai EL-l, Bender KJ, Rubenstein JLR (2022) LiCl treatment leads to long-term restoration of spine maturation and synaptogenesis in adult Tbr1 mutants. J Neurodev Disord 14:11. 10.1186/s11689-022-09421-5 [DOI] [PMC free article] [PubMed] [Google Scholar]
- Hamdan FF, Srour M, Capo-Chichi JM, Daoud H, Nassif C, Patry L, Massicotte C, Ambalavanan A, Spiegelman D, Diallo O, Henrion E, Dionne-Laporte A, Fougerat A, Pshezhetsky AV, Venkateswaran S, Rouleau GA, Michaud JL (2014) De novo mutations in moderate or severe intellectual disability. PLoS Genet 10:e1004772. 10.1371/journal.pgen.1004772 [DOI] [PMC free article] [PubMed] [Google Scholar]
- Han W, Kwan KY, Shim S, Lam MM, Shin Y, Xu X, Zhu Y, Li M, Sestan N (2011) TBR1 directly represses Fezf2 to control the laminar origin and development of the corticospinal tract. Proc Natl Acad Sci U|S|A 108:3041–3046. 10.1073/pnas.1016723108 [DOI] [PMC free article] [PubMed] [Google Scholar]
- Hevner RF, Shi L, Justice N, Hsueh Y, Sheng M, Smiga S, Bulfone A, Goffinet AM, Campagnoni AT, Rubenstein JL (2001) Tbr1 regulates differentiation of the preplate and layer 6. Neuron 29:353–366. 10.1016/s0896-6273(01)00211-2 [DOI] [PubMed] [Google Scholar]
- Hill JM, Lim MA, Stone MM (2008) Developmental milestones in the newborn mouse. In: Neuropeptide techniques (Gozes I, ed), pp 131–149. Totowa, NJ: Humana. [Google Scholar]
- Huang TN, Chuang HC, Chou WH, Chen CY, Wang HF, Chou SJ, Hsueh YP (2014) Tbr1 haploinsufficiency impairs amygdalar axonal projections and results in cognitive abnormality. Nat Neurosci 17:240–247. 10.1038/nn.3626 [DOI] [PubMed] [Google Scholar]
- Huang TN, Yen TL, Qiu LR, Chuang HC, Lerch JP, Hsueh YP (2019) Haploinsufficiency of autism causative gene Tbr1 impairs olfactory discrimination and neuronal activation of the olfactory system in mice. Mol Autism 10:5. 10.1186/s13229-019-0257-5 [DOI] [PMC free article] [PubMed] [Google Scholar]
- Iakoucheva LM, Muotri AR, Sebat J (2019) Getting to the cores of autism. Cell 178:1287–1298. 10.1016/j.cell.2019.07.037 [DOI] [PMC free article] [PubMed] [Google Scholar]
- Iossifov I, et al. (2014) The contribution of de novo coding mutations to autism spectrum disorder. Nature 515:216–221. 10.1038/nature13908 [DOI] [PMC free article] [PubMed] [Google Scholar]
- Jin C, Kang H, Yoo T, Ryu JR, Yoo Y-E, Ma R, Zhang Y, Kang HR, Kim Y, Seong H, Bang G, Park S, Kwon S-K, Sun W, Kim H, Kim JY, Kim E, Han K (2021) The neomycin resistance cassette in the targeted allele of Shank3B knock-out mice has potential off-target effects to produce an unusual Shank3 isoform. Front Mol Neurosci 13:614435. 10.3389/fnmol.2020.614435 [DOI] [PMC free article] [PubMed] [Google Scholar]
- Karczewski KJ, et al. (2020) The mutational constraint spectrum quantified from variation in 141,456 humans. Nature 581:434–443. 10.1038/s41586-020-2308-7 [DOI] [PMC free article] [PubMed] [Google Scholar]
- Kwan KY, Šestan N, Anton ES (2012) Transcriptional co-regulation of neuronal migration and laminar identity in the neocortex. Development 139:1535–1546. 10.1242/dev.069963 [DOI] [PMC free article] [PubMed] [Google Scholar]
- Landrum MJ, et al. (2018) ClinVar: improving access to variant interpretations and supporting evidence. Nucleic Acids Res 46:D1062–D1067. 10.1093/nar/gkx1153 [DOI] [PMC free article] [PubMed] [Google Scholar]
- Lee PH, et al. (2019) Genomic relationships, novel loci, and pleiotropic mechanisms across eight psychiatric disorders. Cell 179:1469–1482.e11. 10.1016/j.cell.2019.11.020 [DOI] [PMC free article] [PubMed] [Google Scholar]
- Liu J, Yang M, Su M, Liu B, Zhou K, Sun C, Ba R, Yu B, Zhang B, Zhang Z, Fan W, Wang K, Zhong M, Han J, Zhao C (2022) FOXG1 sequentially orchestrates subtype specification of postmitotic cortical projection neurons. Sci Adv 8:eabh3568. 10.1126/sciadv.abh3568 [DOI] [PMC free article] [PubMed] [Google Scholar]
- McDermott JH, Study DDD, Clayton-Smith J, Briggs TA (2018) The TBR1-related autistic-spectrum-disorder phenotype and its clinical spectrum. Eur J Med Genet 61:253–256. 10.1016/j.ejmg.2017.12.009 [DOI] [PubMed] [Google Scholar]
- McKenna WL, Betancourt J, Larkin KA, Abrams B, Guo C, Rubenstein JL, Chen B (2011) Tbr1 and Fezf2 regulate alternate corticofugal neuronal identities during neocortical development. J Neurosci 31:549–564. 10.1523/JNEUROSCI.4131-10.2011 [DOI] [PMC free article] [PubMed] [Google Scholar]
- McRae JF, et al. (2017) Prevalence and architecture of de novo mutations in developmental disorders. Nature 542:433–438. [DOI] [PMC free article] [PubMed] [Google Scholar]
- Meier ID, Bernreuther C, Tilling T, Neidhardt J, Wong YW, Schulze C, Streichert T, Schachner M (2010) Short DNA sequences inserted for gene targeting can accidentally interfere with off-target gene expression. FASEB J 24:1714–1724. 10.1096/fj.09-140749 [DOI] [PubMed] [Google Scholar]
- Nambot S, et al. (2020) De novo TBR1 variants cause a neurocognitive phenotype with ID and autistic traits: report of 25 new individuals and review of the literature. Eur J Hum Genet 28:770–782. 10.1038/s41431-020-0571-6 [DOI] [PMC free article] [PubMed] [Google Scholar]
- Neale BM, et al. (2012) Patterns and rates of exonic de novo mutations in autism spectrum disorders. Nature 485:242–245. 10.1038/nature11011 [DOI] [PMC free article] [PubMed] [Google Scholar]
- Notwell JH, Heavner WE, Darbandi SF, Katzman S, McKenna WL, Ortiz-Londono CF, Tastad D, Eckler MJ, Rubenstein JL, McConnell SK, Chen B, Bejerano G (2016) TBR1 regulates autism risk genes in the developing neocortex. Genome Res 26:1013–1022. 10.1101/gr.203612.115 [DOI] [PMC free article] [PubMed] [Google Scholar]
- Olson EN, Arnold HH, Rigby PWJ, Wold BJ (1996) Know your neighbors: three phenotypes in null mutants of the myogenic bHLH gene MRF4. Cell 85:1–4. 10.1016/S0092-8674(00)81073-9 [DOI] [PubMed] [Google Scholar]
- O'Roak BJ, et al. (2012a) Sporadic autism exomes reveal a highly interconnected protein network of de novo mutations. Nature 485:246–250. [DOI] [PMC free article] [PubMed] [Google Scholar]
- O'Roak BJ, et al. (2012b) Multiplex targeted sequencing identifies recurrently mutated genes in autism spectrum disorders. Science 338:1619–1622. [DOI] [PMC free article] [PubMed] [Google Scholar]
- O'Roak BJ, Stessman HA, Boyle EA, Witherspoon KT, Martin B, Lee C, Vives L, Baker C, Hiatt JB, Nickerson DA, Bernier R, Shendure J, Eichler EE (2014) Recurrent de novo mutations implicate novel genes underlying simplex autism risk. Nat Commun 5:5595. 10.1038/ncomms6595 [DOI] [PMC free article] [PubMed] [Google Scholar]
- Palumbo O, Fichera M, Palumbo P, Rizzo R, Mazzolla E, Cocuzza DM, Carella M, Mattina T (2014) TBR1 is the candidate gene for intellectual disability in patients with a 2q24.2 interstitial deletion. Am J Med Genet A 164A:828–833. 10.1002/ajmg.a.36363 [DOI] [PubMed] [Google Scholar]
- Pham CT, MacIvor DM, Hug BA, Heusel JW, Ley TJ (1996) Long-range disruption of gene expression by a selectable marker cassette. Proc Natl Acad Sci U|S|A 93:13090–13095. 10.1073/pnas.93.23.13090 [DOI] [PMC free article] [PubMed] [Google Scholar]
- Rueden CT, Schindelin J, Hiner MC, DeZonia BE, Walter AE, Arena ET, Eliceiri KW (2017) ImageJ2: ImageJ for the next generation of scientific image data. BMC Bioinformatics 18:529. 10.1186/s12859-017-1934-z [DOI] [PMC free article] [PubMed] [Google Scholar]
- Scacheri PC, Crabtree JS, Novotny EA, Garrett-Beal L, Chen A, Edgemon KA, Marx SJ, Spiegel AM, Chandrasekharappa SC, Collins FS (2001) Bidirectional transcriptional activity of PGK-neomycin and unexpected embryonic lethality in heterozygote chimeric knockout mice. Genesis 30:259–263. 10.1002/gene.1072 [DOI] [PubMed] [Google Scholar]
- Telley L, Agirman G, Prados J, Amberg N, Fièvre S, Oberst P, Bartolini G, Vitali I, Cadilhac C, Hippenmeyer S, Nguyen L, Dayer A, Jabaudon D (2019) Temporal patterning of apical progenitors and their daughter neurons in the developing neocortex. Science 364: 10.1126/science.aav2522 [DOI] [PubMed] [Google Scholar]
- Toma K, Kumamoto T, Hanashima C (2014) The timing of upper-layer neurogenesis is conferred by sequential derepression and negative feedback from deep-layer neurons. J Neurosci 34:13259–13276. 10.1523/JNEUROSCI.2334-14.2014 [DOI] [PMC free article] [PubMed] [Google Scholar]
- Vegas N, Cavallin M, Kleefstra T, de Boer L, Philbert M, Maillard C, Boddaert N, Munnich A, Hubert L, Bery A, Besmond C, Bahi-Buisson N (2018) Mutations in TBR1 gene leads to cortical malformations and intellectual disability. Eur J Med Genet 61:759–764. 10.1016/j.ejmg.2018.09.012 [DOI] [PubMed] [Google Scholar]
- Willsey AJ, et al. (2013) Coexpression networks implicate human midfetal deep cortical projection neurons in the pathogenesis of autism. Cell 155:997–1007. 10.1016/j.cell.2013.10.020 [DOI] [PMC free article] [PubMed] [Google Scholar]
- Yook C, Kim K, Kim D, Kang H, Kim SG, Kim E, Kim SY (2019) A TBR1-K228E mutation induces Tbr1 upregulation, altered cortical distribution of interneurons, increased inhibitory synaptic transmission, and autistic-like behavioral deficits in mice. Front Mol Neurosci 12:241. 10.3389/fnmol.2019.00241 [DOI] [PMC free article] [PubMed] [Google Scholar]
- Yoon S, Munoz A, Yamrom B, Lee Y-h, Andrews P, Marks S, Wang Z, Reeves C, Winterkorn L, Krieger AM, Buja A, Pradhan K, Ronemus M, Baldwin KK, Levy D, Wigler M, Iossifov I (2021) Rates of contributory de novo mutation in high and low-risk autism families. Commun Biol 4:1026. 10.1038/s42003-021-02533-z [DOI] [PMC free article] [PubMed] [Google Scholar]
Associated Data
This section collects any data citations, data availability statements, or supplementary materials included in this article.
Supplementary Materials
Reported human mutations within in-frame deletion site of Tbr1Δ6aa mice. This extended data table supports Figure 1. Human mutations affecting TBR1 residues 348–353, which are deleted in Tbr1Δ6aa mice, and accompanying clinical genetic information are provided. Download Figure 1-1, DOCX file (13.8KB, docx) .
Primers and oligonucleotides used in this study. This extended data table supports Figures 1 and 2. Primers and oligonucleotides for mouse CRISPR/Cas9, Sanger sequencing, PCR genotyping, and real-time qPCR are provided. Asterisks indicate a phosphorothioate bond. Download Figure 1-2, DOCX file (16.6KB, docx) .