

Abstract
Breastfeeding (BF) initiation rates in French maternity units are among the lowest in Europe. After increasing for several years, they decreased between 2010 and 2016, although several maternal characteristics known to be positively associated with BF in France were more frequent. We aimed to (1) quantify adjusted trends in BF initiation rates between 2010 and 2016; (2) examine associations between BF initiation rates and newborn, maternal, maternity unit, and department‐level characteristics. Using data from the 2010 (n = 12,224) and 2016 (n = 11,089) French National Perinatal Surveys, we analysed BF initiation (exclusive, mixed, and any) through a succession of six mixed‐effect multinomial regression models, progressively adding adjustment covariates. Adjusted exclusive and any BF initiation rates decreased by 9.6 and 4.5 points, respectively, versus by 7.7 and 1.8 points, respectively, in the crude analysis. In both years, adjusted exclusive and any BF initiation rates were lowest in the following categories of mothers: low education level, single, high body mass index and multiple or premature births. Exclusive BF initiation decreased most in primiparous mothers, those with the lowest household income, mothers that had a vaginal delivery, women born in an African country and those who delivered in a maternity unit without Baby‐Friendly Hospital Initiative designation. The 2010–2016 decrease in BF initiation rates in France cannot be explained by changes in mothers' characteristics; quite the opposite, adjustment increased its magnitude. Additional efforts should be put in place to understand why this decrease is particularly sharp in some subgroups of mothers.
Keywords: breastfeeding initiation, exclusive breastfeeding, France, inequalities, mixed breastfeeding, trends
Differences in predicted exclusive, mixed and any breastfeeding (BF) initiation rates between 2016 and 2010 (i.e., marginal effect of the year) were estimated with six nested models that adjusted for an increasing number of covariates. Any BF initiation rates are equal to the sum of exclusive and mixed BF initiation rates. The six models were built cumulatively including a year index (Model 1), spatial random effect (Model 2), individual characteristics (Model 3), maternity unit characteristics (Model 4), French department characteristics (Model 5), and interaction terms between the year and the covariates (Model 6). Data for metropolitan France from the 2010 and 2016 French National Perinatal Surveys (NPS).
Key points
While some maternal characteristics previously known to be positively associated with breastfeeding (BF) in France were more frequent in 2016 than 2010, any BF initiation rate in maternity units in France decreased by 2 points (from 68.7% to 66.7%), and exclusive BF by 8 points (from 60.3% to 52.2%). Even greater decreases (4.5 and 9.6 points, respectively) were observed after adjusting for the characteristics of mothers, newborns, maternity units, and departments.
Between 2010 and 2016, the largest decreases in adjusted exclusive BF initiation rates were observed in primiparous mothers, those with the lowest household income, mothers that had a vaginal delivery, women born in an African country and those who delivered in a maternity unit without Baby‐Friendly Hospital Initiative designation.
1. INTRODUCTION
Breastfeeding (BF) provides unparalleled benefits for both infants and mothers in low‐ and high‐income countries (Victora, Rollins, et al., 2016). While Northern European countries as well as Poland, the Czech Republic and Bulgaria have high rates of BF initiation, the United Kingdom, Belgium and France have some of the lowest rates (Cattaneo et al., 2005; Victora, Bahl, et al., 2016; Yngve & Sjostrom, 2001). Although the French National Perinatal Surveys (NPS) from 1995 to 2010 reported an increase in any (i.e., exclusively breast milk and mixed breast milk with formula) BF initiation rates in maternity units (Blondel, Coulm, Bonnet, Goffinet, et al., 2017), any BF initiation rates decreased from 68.7% to 66.7% between 2010 and 2016 (Blondel, Coulm, Bonnet, Goffinet, et al., 2017). This decrease was even more pronounced for exclusive BF initiation, which declined from 60.3% to 52.2%, one of the lowest rates in Europe (Blondel, Coulm, Bonnet, Goffinet, et al., 2017).
A mother's choice to breastfeed is influenced by multiple levels of determinants, such as the newborn's and mother's characteristics, maternity unit practices and the historical, cultural and socioeconomic environment (Rollins et al., 2016). In the French ELFE cohort study, BF initiation was positively associated with being married, older age, primiparous birth, higher education level, higher social status and foreign nationality (Kersuzan, Gojard, Tichit, Thierry, Wagner, Nicklaus, & Lauzon‐Guillain, 2014; Salanave et al., 2012). It was also associated with the social characteristics of France's regions, particularly the percentage of residents with a university educational level, and the percentage of non‐French residents (Bonet et al., 2010).
The NPS include a representative sample of all maternity unit births in a given year. Accordingly, they can be used to monitor newborn and maternal indicators. The characteristics of mothers included in the NPS changed between the 2010 and 2016 editions (Blondel, Coulm, Bonnet, Vanhaesebrouck, et al., 2017). Some characteristics positively associated with high BF initiation rates in previous French surveys (not NPS) (Kersuzan, Gojard, Tichit, Thierry, Wagner, Nicklaus, 2014; Salanave et al., 2012) were more frequent in mothers in the 2016 NPS than in the 2010 edition (e.g., the percentage of women with a higher education level increased from 52.1% to 55.4%) (Blondel, Coulm, Bonnet, Vanhaesebrouck, et al., 2017). Despite this, a clear decrease in BF initiation rates was observed between 2010 and 2016. We hypothesised that adjusting for these characteristics could reveal a sharper decline in BF initiation rates than was first apparent. Accordingly, we built a model adjusting for all relevant covariates to estimate the direction and extent of the 2010–2016 trend in BF initiation rates and to disentangle it from changes observed in the NPS study population's characteristics.
Specifically, the present study aimed to (1) quantify the adjusted trends in exclusive, mixed and any BF initiation rates in maternity units in France between 2010 and 2016; (2) examine the association between exclusive, mixed and any BF initiation and individual and contextual characteristics, specifically infant, mother, maternity unit and French department‐level sociodemographic and clinical characteristics.
2. METHODS
2.1. Study population
The 2010 and 2016 NPS were conducted in metropolitan France and French overseas territories to monitor health indicators and practices during the perinatal period (Blondel & Kermarrec, 2011; Blondel, Coulm, Bonnet, Vanhaesebrouck, et al., 2017; Vilain, 2011). The surveys comprised three components: (1) a face‐to‐face interview with mothers in postpartum wards, which collected data on their demographic and social characteristics, as well as their experiences during their pregnancy and delivery; (2) data collection from medical records concerning the pregnancy, delivery and health status of the infant; (3) a maternal unit questionnaire completed by the head of participating maternity units to describe their structural characteristics and practices. Trained midwives conducted the face‐to‐face interviews and collected the medical record data. Both surveys included all live births, stillbirths and medical abortions with a gestational age of at least 22 weeks of amenorrhoea and a weight of at least 500 g in public and private maternity units (including children born alive outside maternity units who were subsequently transferred to one) (Blondel & Kermarrec, 2011; Blondel, Coulm, Bonnet, Vanhaesebrouck, et al., 2017).
Our study population included mothers who delivered in metropolitan France. BF initiation rates and the characteristics of mothers in metropolitan France and the French overseas are not comparable, so we did not include this population in the study. For instance, in the 2016 NPS, the rate of any BF initiation for the French overseas was higher than in metropolitan France (83.1% [80.1%–85.8%] vs. 66.7% [66.0%–67.4%], while the percentage of women with higher‐level education was lower in French overseas than in metropolitan France (32.7% [29.7%–35.9%] vs. 55.4% [54.7%–56.2%]) (Blondel, Coulm, Bonnet, Vanhaesebrouck, et al., 2017).
We excluded women with missing BF data (i.e., no face‐to‐face interview; face‐to‐face interview but with incomplete BF data, anonymous birth, aged less than 18 years). Figure A1 illustrates the selection criteria for the study population. To compare participants with non‐participants, in 2010, data were collected from the medical records of mothers who did not want to be interviewed (478 infants and 471 mothers). In 2016, the NPS included a short non‐participant questionnaire specifically for the mothers who did not want to be interviewed (594 infants and 579 mothers). These data allowed us to conclude that there were no notable differences between interviewed mothers and those not interviewed (see Table A1).
To compare different nested models for the same set of observations, observations with missing data on any of the variables of interest (except the length of time between giving birth and the interview) were removed from the sample (12.3% for 2010 and 6.8% for 2016). With regard to the length of time between giving birth and the interview, the 1.7% of missing, negative and outlier (>10 days) values were imputed by the year‐specific median, which was 1 in both years. The final study population comprised 12,224 infants and 12,059 mothers in 2010 and 11,089 infants and 10,927 mothers in 2016.
2.2. Definitions and variables
As part of the face‐to‐face interview, mothers were asked the following question: ‘How is your child fed today? (1) only breast milk; (2) only infant or preterm formula; (3) breast milk and infant or preterm formula’. The outcome variable of BF initiation was categorised into exclusive (only breast milk), mixed (breast milk and infant or preterm formula) and no BF (only infant or preterm formula). In the rest of this paper, we will refer to the combined exclusive and mixed BF categories as ‘any’ BF. The explanatory variables included the following individual and contextual characteristics:
-
1.
Individual (mother): age (in years), level of education (no/primary, lower secondary, upper secondary, 1–2 years of university, >2 years of university), place of birth (France, African country (North and sub‐Saharan), other countries), marital status (no, yes), current employment status (employed, housewife, unemployed, other), average monthly household income (<€1500, €1500–2999, ≥€3000), parity (i.e., number of births), pre‐pregnancy body mass index (BMI in kg/m2), mode of delivery (spontaneous vaginal, instrumental vaginal, caesarean section), length of time between giving birth and the survey interview (in days).
For the variable marital status, we used the question ‘Are you married?’ It had two possible responses in 2010: ‘no’ or ‘yes’, and was more specific in 2016 with three possible responses: ‘no’, ‘yes’ or ‘in civil union’. To be consistent with the 2016 NPS report, we grouped ‘civil union’ with ‘no’ in ‘2016’.
-
2.
Individual (infant): multiple births (yes/no) and preterm birth, <37 weeks (yes/no).
-
3.
Maternity unit: Baby‐Friendly designation (no/in process/yes) (World Health Organization, UNICEF & Wellstart International, 1991), size (annual number of deliveries), status (public regional or university, other public, non‐profit private, other private), level of care (I: obstetric unit, II: obstetric and neonatology or neonatal intensive care unit, III: obstetric, neonatology/neonatal intensive care and neonatal resuscitation unit) and presence in the healthcare facility of a professional trained in providing BF support defined as an IBCLC (International Board Certified Lactation Consultant) certified BF consultant and/or a professional with a university degree in BF (yes/no).
-
4.Department: In metropolitan France, there are 34,839 municipalities grouped into 96 departments (called départements) and 13 regions (French National Institute of Statistics and Economic Studies INSEE, 2018). The characteristics of the departments were derived from sociodemographic databases at the municipality level, made available by the French National Institute of Statistics and Economic Studies (INSEE). They included:
- The percentage of residents living in urban municipalities calculated from the 2010 and 2016 legal populations and the classification of the territory into urban or rural areas (French National Institute of Statistics and Economic Studies INSEE, 2019d).
- The percentage of residents aged 16 years old and over with a graduate or post‐graduate education in 2010 (French National Institute of Statistics and Economic Studies (French National Institute of Statistics and Economic Studies INSEE, 2013a) and 2016 (French National Institute of Statistics and Economic Studies INSEE, 2019a),
2.3. Statistical analysis
2.3.1. Regression models
To model BF initiation, which was a categorical variable with three levels (exclusive, mixed, no), we used multinomial regression models, with exclusive BF initiation as the reference level (Baxter et al., 2009).
A spatial random effect at the department level, modelled with a Gaussian Markov random field, allowed us to account for the department‐specific variations in BF initiation rates and the correlation between BF initiation rates from neighbouring departments (Besag et al., 1991; Wood, 2017). The time between giving birth and the survey interview was modelled using a linear approach, as the smooth‐term modelling with splines failed to converge. All other continuous variables were modelled with smooth terms, specifically thin‐plate splines (Wood, 2017): maternal age, parity, BMI, annual number of deliveries in maternity units and the four variables characterising each French department.
2.3.2. Main outcome measure
Our primary objective was to measure the 2010–2016 time trend and progressively disentangle it from changes in the characteristics of the sampled populations. We built a succession of six mixed‐effect multinomial regression models, cumulatively including the following variables: (1) an index variable equal to 1 for the observations made in the Year 2016 and 0 for the Year 2010, (2) a spatial random effect, (3) individual characteristics, (4) maternity unit characteristics, (5) French department characteristics and (6) interaction terms between the year and the covariates. Each model was built based on the preceding one by adding a new group of variables (e.g., Model 2, where the spatial random effect was added to Model 1). After introducing each group of variables, we used backward elimination to remove the parametric terms with a p‐value above 0.05 and the smooth terms whose plotted confidence interval included zero (Marra & Wood, 2011; Wood, 2001).
To facilitate the interpretation of the model outputs, we computed the marginal predictions of exclusive, mixed and any BF initiation rates, for the different levels of various covariates. The marginal prediction for the rate of any BF initiation was obtained by adding the marginal predictions of exclusive and mixed BF initiation rates. Marginal predictions were obtained by first replacing the values of the covariate of interest in the data set with a fixed value (e.g., delivery mode is set to ‘caesarean’ for all women), keeping all other covariates at their observed values, and then taking the sample mean of the predicted responses (Muller & MacLehose, 2014). This produced BF initiation rate estimates for each level of a covariate of interest, adjusted for the other covariates. The marginal effect of a covariate level was computed as the difference between the marginal prediction obtained with this level and that obtained with the reference level (Muller & MacLehose, 2014). The 95% confidence intervals for both marginal predictions and marginal effects were computed based on 1000 Monte‐Carlo simulations, by sampling in the distribution of the model coefficients.
As our principal aim was to measure the 2010–2016 time trend, special focus was placed on observing how the marginal effect of the year 2016 versus the year 2010 varied as more adjustment variables were introduced into the model (from Models 1 to 6). Finally, to assess whether time trends differed according to the different individual, maternity unit and department characteristics, the final model (Model 6) included the year–covariate interaction terms for which the p‐value was <0.2 or the smooth terms whose plotted confidence interval did not include zero.
The analyses were performed with the statistical software R 3.6.2 and the mgcv package 1.8‐31.
3. RESULTS
3.1. Changes in the study population between 2010 and 2016
Some of the individual, maternity unit, and department characteristics changed between 2010 and 2016 (see Table A2). In comparison to 2010, mothers in 2016 were more likely to be older, have more than 2 years of university education (37.2% vs. 32.5%), to have a household income above €3000/month (42.8% vs. 36.2%), to have had preterm deliveries (6.6% vs. 5.3%) and to give birth in maternity units that were Baby‐Friendly designated (6.4% vs. 2.0%). They were also less likely to be married (40.2% vs. 46.9%), to be employed (69.0% vs. 71.6%) and to be primiparous mothers (42.9% vs. 43.9%).
3.2. Selected models
After the selection process, 10 individual covariates were selected in Model 3 (level of education, place of birth, marital status, average monthly household income, parity, pre‐pregnancy BMI, mode of delivery, length of time between giving birth and the survey interview, multiple births and preterm birth). We added four maternity‐unit variables in Model 4: Baby‐Friendly designation, size, status and level of care. Model 5 included two additional department‐level covariates: the percentage of immigrants and the percentage of residents aged 16 years old and over with a graduate or post‐graduate education.
The final model, Model 6, included 16 adjusting covariates (in addition to the year effect). The interaction term of 8 covariates with the year index with a p < 0.2 were included in the final model: four individual variables (place of birth, average monthly household income, parity and mode of delivery), three maternity‐unit covariates (Baby‐Friendly designation, status, and level of care) and one department‐level covariate (percentage of immigrants).
3.3. Time trends of BF initiation rates
Figure 1 presents the time trends, as measured by the marginal effect of year 2016 versus year 2010, of exclusive, mixed and any BF initiation rates, obtained with the six nested models, from the crude model (Model 1) to the most adjusted one (Model 6).
Figure 1.

Difference in predicted exclusive, mixed and any breastfeeding (BF) initiation rates between 2016 and 2010 (i.e., marginal effect of the year), estimated with six nested models that adjusted for an increasing number of covariates. Any BF initiation rates are equal to the sum of exclusive and mixed BF initiation rates. The six models were built cumulatively including a year index (Model 1), spatial random effect (Model 2), individual characteristics (Model 3), maternity unit characteristics (Model 4), French department characteristics (Model 5) and interaction terms between the year and the covariates (Model 6). Data for metropolitan France from the 2010 and 2016 French National Perinatal Surveys.
In Model 1, which contained only the year effect, the estimated decrease in the exclusive BF initiation rate between 2010 and 2016 was −7.7 percentage points (95% confidence interval [−8.9, −6.5]). The addition of a spatial random effect (Model 2) did not change this estimate much. The successive addition of the individual, maternity unit and department characteristics resulted respectively in an additional decrease of −0.3, −0.8 and −0.6 percentage points (Models 3, 4, and 5). The addition of interactions to Model 5 did not change the final estimated decrease in exclusive BF initiation rates, which stabilised at −9.6 [−11.0, −8.2] percentage points.
The mixed BF initiation rate increased by +5.9 percentage points [5.2, 6.7] between 2010 and 2016 in the crude analysis (Model 1). The addition of more adjusting covariates slightly but consistently reduced this estimate, arriving at +5.1 percentage points [4.2, 6.0] in the full model (Model 6). In this case, the main difference was observed when adding the departmental characteristics (−0.4 percentage points).
As a result, between 2010 and 2016, any BF initiation rate in maternity units decreased by −1.8 [−2.9, −0.7] percentage points in the unadjusted model, and by −4.5 [−5.8, −3.3] in Model 6. As in the case of exclusive BF initiation, adding the characteristics of the maternity unit (Model 4) and the department (Model 5) resulted in the strongest changes in any BF initiation (−0.8 and −1.1 percentage points, respectively).
3.4. Characteristics associated with BF initiation
Marginal predictions of exclusive, mixed and any BF initiation rates were computed with the final model (Model 6) for different values of the explanatory covariates (see Figure 2). The results in this section will present the difference in predicted BF initiation rates between each variable level and the reference level (i.e., marginal effect) (see Table A3).
Figure 2.
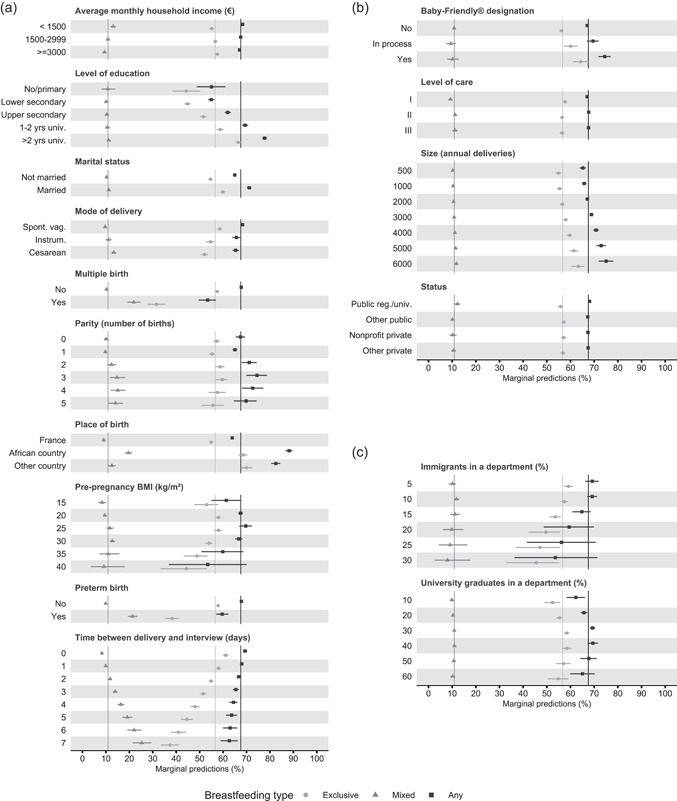
Marginal predictions of exclusive (light grey circle), mixed (grey triangle) and any (black square) breastfeeding (BF) initiation rates, for the different levels of the covariates included in the final model (Model 6). Any BF initiation rates are equal to the sum of exclusive and mixed BF initiation rates. Model 6 was built cumulatively including a year index (Model 1), spatial random effect (Model 2), individual characteristics (Model 3), maternity unit characteristics (Model 4), French department characteristics (Model 5) and interaction terms between the year and the covariates (Model 6). Section (a) includes the individual covariates; section (b) the maternity unit covariates and section (c) the French department covariates. The vertical lines indicate the mean prediction in the whole sample for each type of BF initiation. Data for metropolitan France from the 2010 and 2016 French National Perinatal Surveys.
3.5. Exclusive BF initiation
Exclusive BF initiation rates varied greatly by education level: the lower the level the lower the rate. Compared with mothers with more than 2 years of university education, mothers with 1–2 years of university education and those with no or primary level education had lower rates (−7.7 [−9.4, −6.0] and −22.3 [−28.4, −16.1] points, respectively).
The time between giving birth and the survey interview was also associated with BF initiation rates. The predicted rates of exclusive BF initiation were lower with every passing day. Compared with single mothers, married mothers had higher exclusive BF initiation rates, specifically by +5.2 [4.2, 6.3] points. The rate of exclusive BF initiation for mothers who had multiple births was −26.0 [−29.7, −22.3] points lower than that of mothers who had a single birth. Likewise, mothers who had a premature delivery had a −19.6 [−22.2, −17.0] point lower exclusive BF initiation rate than those who had a full‐term delivery.
The contextual covariate showing the strongest association with exclusive BF initiation rates was maternity unit Baby‐friendly designation. Rates were +8.1 [4.6–11.3] and +3.8 [1.0–6.6] points higher in women who gave birth in a maternity unit, which already had or was in the process of getting a Baby‐Friendly designation, respectively. Furthermore, the exclusive BF initiation rate for mothers living in departments where immigrants comprised 30% of the population was −11.8 [−25.6, −0.7] points lower than that for mothers living in departments with a 10% immigrant population (the average). The mean education level in a department was also slightly associated with exclusive BF initiation rates: the rate for mothers from departments where 10% of the population had a graduate or post‐graduate education was −5.7 [−9.6, −2.0] points lower than that of mothers from departments where 29% of the population had this level of education (the average).
3.6. Mixed BF initiation
Mixed BF initiation rates did not vary greatly according to education level, marital status or BMI. However, having multiple or premature births was strongly associated with mixed BF initiation rates. Specifically, rates were +11.6 [8.6, 14.6] points higher in mothers who had multiple births than those with a single birth, and +11.4 [9.4, 13.7] points higher in mothers who had a preterm delivery than those that delivered at full term. Contrary to exclusive BF initiation, the rate of mixed BF was higher as the delay between the delivery and interview increased. Specifically, the rates for mothers interviewed at Day 2 and Day 3 were, respectively, +1.9 [1.5, 2.3] and +4.0 [3.2, 5.0] points higher than the rates of mothers interviewed the day after giving birth.
The contextual variable most associated with mixed BF initiation rates was the proportion of immigrants in the department population. Rates were −3.8 [−10.1, 6.6] points lower for mothers from departments with a 30% immigrant population than for those living in departments with an average proportion of immigrants (10%).
3.7. Any BF initiation
The changes in exclusive and mixed BF initiation rates were reflected in the marginal effects of any BF initiation rates (i.e., the sum of exclusive and mixed). The association pattern between any BF initiation rates and the covariate levels was quite similar to that seen for exclusive BF initiation rates. However, it was less similar for the variable ‘multiple births’, as higher mixed BF initiation rates offset lower exclusive BF initiation rates.
3.8. Time trends by subgroups of mothers
Using Model 6, we calculated the adjusted time trends of BF initiation rates in different subgroups of mothers characterised by different values of the eight variables interacting with time (see Figure 3). To that effect, the year index was varied simultaneously with the value of each interacting covariate.
Figure 3.
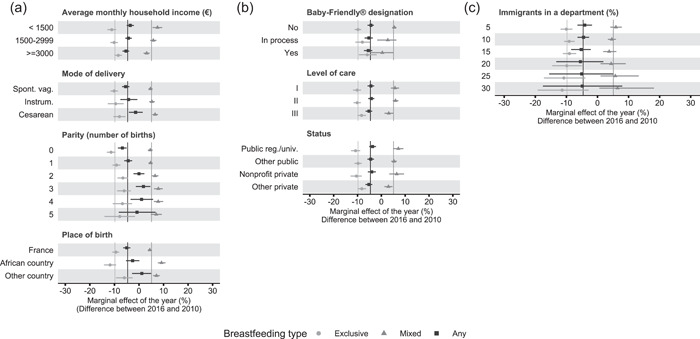
Difference in predicted breastfeeding (BF) initiation rates between 2016 and 2010 (i.e., marginal effect of the year). Exclusive (light grey circle), mixed (grey triangle) and any (black square) BF initiation rates are presented for the different levels of the covariates interacting with time in the final model (Model 6). Any BF initiation rates are equal to the sum of exclusive and mixed BF initiation rates. Model 6 was built cumulatively including a year index (Model 1), spatial random effect (Model 2), individual characteristics (Model 3), maternity unit characteristics (Model 4), French department characteristics (Model 5) and interaction terms between the year and the covariates (Model 6). Section (a) includes the individual covariates; section (b) the maternity unit covariates and section (c) the French department covariates. The vertical lines indicate the mean difference in predicted BF initiation rates for each type of BF initiation. Data for metropolitan France from the 2010 and 2016 French National Perinatal Surveys.
For mothers with a household income above €3000/month, the decrease in the exclusive BF initiation rate was lower than the average (−8.4 [−9.9, −6.9] vs. −9.6 points). Conversely, the increase in the mixed BF initiation rate was lower than the average (+3.1 [1.9, 4.3] vs. +5.1 points). In contrast, for mothers with a household income of less than €1500/month, a greater‐than‐average increase was observed for the mixed BF initiation rate (+7.5 [5.6, 9.5] vs. +5.1 points), leading to a smaller‐than‐average reduction in any BF initiation rate (−3.6 [−5.0, −2.0] vs. −4.5 points).
Exclusive and any BF initiation rates decreased less in mothers who had a caesarean section (−7.9 [−10.4, −5.5] vs. −9.6 points on average and −1.4 [−4.1, 1.5] vs. −4.5 points on average, respectively). Exclusive BF initiation dropped sharply between 2010 and 2016 in primiparous mothers (−11.8 [−13.1, −9.6]), while the decline in mothers who already had two or three children was smaller than the average of −9.6 points (−6.6 [−8.7, −4.5] and −6.1 [−8.9, −3.3] points, respectively). Any BF initiation also declined more than the average in primiparous mothers by −6.8 [−8.6, −5.0] points, while it declined less in mothers with two children by 0.0 [−2.2, 2.2] points and even increased for those with three children by +1.8 [−1.3, 4.6] points (vs. −5.1 points on average).
Exclusive BF initiation rate dropped more sharply in women born in an African country (−11.8 [−14.3, −9.8] vs. −9.6 points on average). However, the increase in the mixed BF initiation rate was sharper: +9.2 [7.7, 10.8] points for mothers born in an African country and +7.1 [5.8, 8.5] points for mothers born in another country (vs. +5.1 points on average). Thus, between 2010 and 2016, any BF initiation rates decreased less than the average for women born in an African country by −2.6 [−5.3, 0.2] points, and even increased slightly by +1.2 [−2.8, 4.9] points for those born in another foreign country (vs. −4.5 points on average).
In Baby‐Friendly designated maternity units, the decrease in the exclusive BF initiation rate was lower than average (−5.9 [−9.4, −1.9] vs. −9.6 points), while the mixed BF initiation rate remained stable (+0.4 points [−4.7, 5.1]). In level III and ‘other private’ maternity units, the decrease in exclusive BF initiation rates was slightly less than the average (−8.3 [−10.0, −6.5] and −8.2 [−9.9, −6.4] vs. −9.6 points, respectively), while the mixed BF initiation rate increase was also less than average (+3.1 [1.3, 4.9] and +3.0 [1.2, 4.7] vs. +5.1 points, respectively).
Furthermore, the exclusive BF initiation rate decreased more than the average in mothers living in departments where immigrants comprised 5% and 30% of the population by −10.0 [−11.9, −8.1] and −11.4 [−19.2, −2.9] points, respectively (vs. −9.6 points on average). Conversely, mixed BF initiation rates increased slightly more than the average in mothers who lived in a department with a 5% and 30% immigrant population (+5.9 [4.1, 7.9] and +6.5 [0.6, 18.2], respectively, vs. +5.1 points on average).
4. DISCUSSION
4.1. Decrease in BF initiation rates
In metropolitan France, between 2010 and 2016, exclusive and any BF initiation rates in maternity units dropped by −7.7 and −1.8 points, respectively. As several maternal characteristics known to be positively associated with BF initiation in France were more frequent in the 2016 sample than in that of 2010 (e.g., older age, higher education level), one would have, on the contrary, intuitively expected an increase in exclusive and any BF initiation rates.
To understand this apparent paradox, we aimed to find which individual, maternity unit or department‐level characteristics were positively or negatively associated with BF, and quantify to what extent changes in those characteristics explained the 2010–2016 decrease in BF initiation rates. By computing adjusted trends, we found that adjusted exclusive and any BF initiation rates in maternity units decreased by −9.6 and −4.5 points, respectively. In other words, adjusting infant, maternal, maternity unit and department‐level covariates made the 2010 and 2016 samples more comparable, and unveiled an even sharper drop in the individual BF initiation probability.
In conclusion, the changes in the studied population characteristics did not explain why BF initiation rates dropped between 2010 and 2016 in France, but, quite the opposite, tended to blur it. Therefore, a possible explanation for the decrease in BF initiation rates must be sought elsewhere. In Great Britain, the increasing trend of BF initiation rates from 1985 to 2010 was attributed to the rising prevalence of those groups of mothers who were characteristically most likely to breastfeed (Simpson et al., 2019).
4.2. Characteristics associated with BF initiation
Both years combined, exclusive and any BF rates were lowest in mothers with no or primary level education, those who were single, had a high BMI, gave birth to multiple or premature babies and those whose survey took place longer after they gave birth.
Education level was one of the individual‐level covariates that had the strongest association with BF initiation. Specifically, as the mother's level of education decreased, the exclusive BF initiation rates decreased substantially and the mixed rate decreased slightly, resulting in a net decrease in any BF initiation rates. In Canada, the difference in any BF initiation rates between the most and least educated mothers narrowed between 1992 and 2008, with rates increasing from 83.8% to 91.5% in mothers with third‐level education qualification, and from 63.1% to 74.7% among those with less than secondary education (Gilbert et al., 2014). A previous study in France also reported that women who breastfed had a higher educational level (Courtois et al., 2021). Mothers in Great Britain with premature or multiple births also had lower exclusive and any BF initiation rates (Simpson et al., 2019).
Concerning maternity unit covariates, we found that the Baby‐Friendly Hospital Initiative helped improve BF initiation practices in France: both years combined, the Baby‐Friendly designation was associated with higher exclusive and any BF rates. These encouraging results fit into a context of mixed evidence for the specific impact of the Baby‐Friendly Hospital Initiative on BF initiation: a literature review of seven studies noted that four found a statistically significant increase while three did not (Howe‐Heyman & Lutenbacher, 2016). The presence in the healthcare facility of a professional trained in providing BF support was previously reported to increase breast milk expression during the first week after giving birth (Pierrat et al., 2016). However, our results did not show a significant relationship between the presence of such a professional and BF initiation rates. One possible explanation for this is that the degree of availability of this support, their approach and the duration of their interventions may vary from one maternity unit to another (Mitha et al., 2019).
Regarding department‐level contextual variables, higher percentages of immigrants in a department were associated with higher any and mixed BF rates, and with lower exclusive BF rates. This confirms, at a finer geographical scale and for more recent years, the results of a previous study reporting higher any BF initiation rates in maternity units located in regions with higher percentages of immigrants in France in 2003 (Bonet et al., 2010). The same correlation was found in England (Oakley et al., 2016).
Bonet et al. (2010) also reported higher any BF initiation rates in regions where 18% or more of residents had a university education. Our department‐level results also highlighted an increase in any BF initiation rates associated with an increasing percentage of university graduates until about 30%, followed by a slightly, although not significantly decreasing plateau. Bonet et al. could not report this plateau as they combined all regions that had a university graduate percentage of over 18%. Moreover, it is also possible that more complex relationships are unveiled when looking at finer geographical scale (department level vs. regional level).
4.3. Time trends by subgroups of mothers
The analysis of interactions between time and covariates showed that the largest decrease in exclusive BF initiation rates was observed in primiparous mothers. Exclusive BF initiation decreased more sharply in mothers with the lowest household incomes, indicating a widening sociodemographic inequality in exclusive BF initiation over the 2010–2016 period. Exclusive BF also dropped more sharply amongst women born in an African country. Yet, it decreased the least amongst mothers who had a caesarean section, which demonstrates that efforts have been put in place to support BF initiation in these women. Why initiating exclusive BF became less frequent in 2016 among those women without personal experience of BF, those more financially precarious, those who had a vaginal delivery and those born in an African country, are questions that deserve specific socio‐demo‐epidemiological studies.
Exclusive BF initiation decreased the least in mothers that delivered in Baby‐Friendly designated maternity, with a level of care type III and was private. Furthermore, exclusive BF initiation decreased the most in mothers in the departments with the highest percentage of immigrants in the department.
Mixed BF initiation increased most in women born abroad, especially in an African country, in low‐income households, with more than two children and who had a caesarean section. However, it decreased the most in Baby‐Friendly, type III and public maternity units. Mixed BF initiation trends remained stable across the different levels of the immigrant population in a department.
Finally, any BF initiation decreased most in primiparous mothers, who had a spontaneous vaginal delivery, with the highest household incomes and those born in France, as a smaller increase in mixed BF initiation rates did not compensate for their decrease in exclusive BF initiation rates.
These different trends in BF initiation rates across subgroups of mothers reflect that the association between the characteristics of mothers and BF initiation has changed between 2010 and 2016. In particular, the place of origin and the mode of delivery were not as strongly associated with exclusive BF in 2016 as they were in 2010. On the contrary, Simpson et al found that, in Great Britain, the association between the characteristics of the mothers and BF initiation rates had remained stable between 1985 and 2010 (Simpson et al., 2019).
4.4. Limitations and strengths
The study has some limitations. Firstly, we used a complete‐case approach to address missing data. Some limitations of this method include bias and reduced statistical efficiency (Wang & Hsu, 2020). Applying univariate models to the complete‐case sample and the whole sample, we saw no indication of a potential bias: the outcome (BF initiation) remained related in the same way to the covariates of interest. The complete‐case sample was also large enough to guarantee good statistical power. Early BF initiation is defined as putting the infant to the breast within 1 h after birth (World Health Organization & UNICEF, 2018). The NPS surveys do not contain a specific question about early BF initiation. However, the question ‘How is your child fed today?’ allowed us to approach the notion of BF initiation. Indeed, differences could arise if some mothers have not yet initiated BF or have already stopped BF when interviewed, but most mothers were interviewed the same day or 1 day after giving birth (62% in 2010 and 66% in 2016), minimising these possibilities. Thus, in line with other studies, we used the available NPS question ‘How is your child fed today?’ to study BF initiation rates in France.
Furthermore, the numbers of premature and multiple births in our study are small. Our results may therefore not be representative of this particular population, which needs adapted care and support. Finally, as the number of mothers born in North and sub‐Saharan Africa was low, we combined these two categories into one. The countries in these regions have different BF initiation trends (Bhattacharjee et al., 2019), but available data prevented us from being able to explore possible associations at this level of detail in our analysis.
Our study also has several strengths. First, it utilised data from the 2010 and 2016 editions of the NPS, a comprehensive and representative national survey in which almost all French maternity units participate, and with few missing data on mothers' sociodemographic characteristics. Since the NPS have used the same protocol since 1995 and are conducted by trained midwives, the data allow researchers to appropriately analyse the trends of newborn and maternal indicators over time. The NPS are completed shortly after childbirth, reducing the recall bias that might occur if the surveys were conducted later. The data collected by NPS for mothers not interviewed also allowed us to determine that there was no selection bias. Second, this study took into account various types of BF initiation: exclusive, mixed and any. The multinomial methodology allowed us to compare exclusive BF initiation rates not only with ‘no BF initiation' rates but also with ‘mixed BF’ rates, which in other studies are usually grouped into any BF initiation rates. Third, we produced estimates for the rates of each BF initiation type (marginal predictions), which are easier to interpret than other indicators, for example, odds ratios (Baxter et al., 2009). Finally, the analysis we conducted included maternity unit and department level characteristics to help explain the observed decrease in BF initiation; these characteristics are not usually taken into account, as indicated in another study (Cohen et al., 2018).
5. CONCLUSION
Mothers who gave birth in 2016 initiated BF less frequently than mothers who gave birth in 2010, and we showed that this decrease cannot be explained by changes in the infant, maternal, maternity unit or department‐level characteristics. Additional efforts should be put in place to understand why this decrease is particularly sharp in some subgroups of mothers. Nevertheless, our results can help decision‐makers identify the subgroups of mothers that BF support programs should target; either those who had the largest decrease in BF initiation rates or those who had the overall lowest BF initiation rates. The incoming results of the 2021 edition of the NPS will reveal if these trends continue.
AUTHOR CONTRIBUTIONS
Beatrice Blondel directed data collection. Virginie Demiguel, Sabira Smaïli, Andrea Guajardo‐Villar and Camille Pelat oversaw data management and analysis. Andrea Guajardo‐Villar, Camille Pelat and Nolwenn Regnault designed the research study. Andrea Guajardo‐Villar, Camille Pelat and Nolwenn Regnault wrote the paper. Beatrice Blondel, Virginie Demiguel, Sabira Smaïli, Julie Boudet‐Berquier, Hugo Pilkington, Benoit Salanave, Andrea Guajardo‐Villar, Camille Pelat and Nolwenn Regnault critically reviewed the paper.
CONFLICT OF INTEREST
The authors declare no conflict of interest.
ETHICS STATEMENT
The 2010 and 2016 French National Perinatal Surveys received approval from the relevant legal authorities in France, including the Comité National de l'Information Statistique (CNIS) for statistical quality control, the Comité consultatif sur le Traitement de l'Information en matière de Recherche dans le domaine de la Santé (CCTIRS), the ethics committee of the Institut National de la Santé et de la Recherche Médicale (INSERM) and the Commission Nationale de l'Informatique et des Libertés (CNIL) for data protection and confidentiality.
ACKNOWLEDGEMENT
We would like to thank Caroline François and the BFHI team in France for their continued help.
APPENDIX A.
Figure A1.
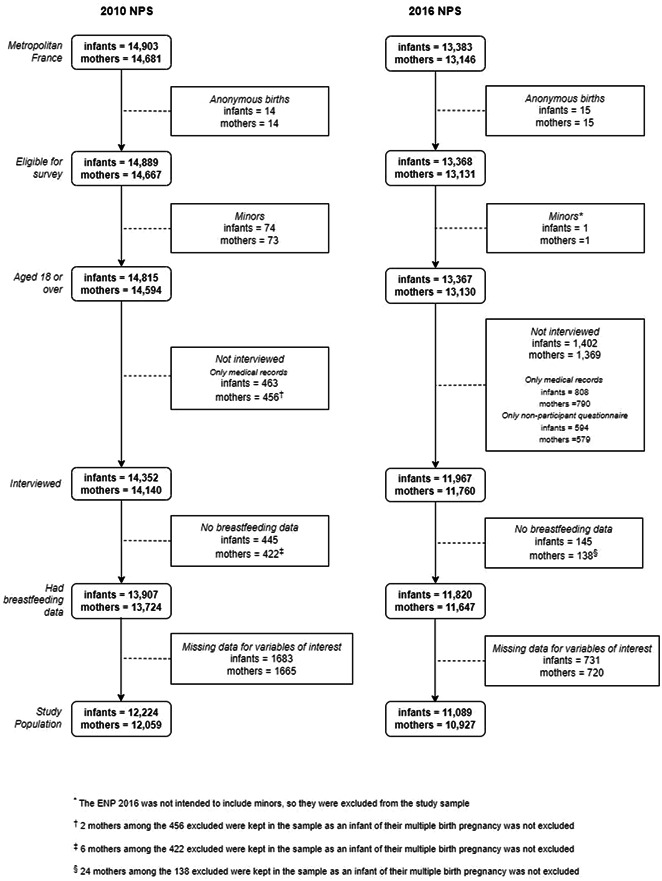
Selection process of the study population. Data for metropolitan France from the 2010 and 2016 French National Perinatal Surveys (NPS).
Table A1.
Individual and maternity unit characteristics of interviewed and not interviewed mothers for the 2010 and 2016 French NPS with the percentage changes between 2010 and 2016
| Interviewed | Not interviewed | ||||||||||
|---|---|---|---|---|---|---|---|---|---|---|---|
| NPS 2010 | NPS 2016 | Percentage change | NPS 2010 | NPS 2016 | Percentage change | ||||||
| N | % | N | % | % | N | % | N | % | % | ||
| Individual characteristics (infants and mothers) | |||||||||||
| 13,907 | 11,820 | 478 | 594 | ||||||||
| BF | No | 4339 | 31.2 | 3936 | 33.3 | 2.1 | 66 | 33.2 | 185 | 41.5 | 8.3 |
| Yes | 9568 | 68.8 | 7884 | 66.7 | −2.1 | 133 | 66.8 | 261 | 58.5 | −8.3 | |
| Age (years) | <25 | 2267 | 16.3 | 1499 | 12.7 | −3.6 | 74 | 21.9 | 148 | 24.9 | 3 |
| 25–29 | 4635 | 33.4 | 3752 | 31.7 | −1.7 | 94 | 27.8 | 147 | 24.7 | −3.1 | |
| 30–34 | 4319 | 31.1 | 4042 | 34.2 | 3.1 | 96 | 29.4 | 149 | 25.1 | −4.3 | |
| ≥35 | 2672 | 19.2 | 2527 | 21.4 | 2.2 | 74 | 21.9 | 150 | 25.3 | 3.4 | |
| Parity (number of births) | 0 | 5938 | 43.1 | 5025 | 42.5 | −0.6 | 154 | 38.2 | 258 | 43.5 | 5.3 |
| 1 | 4837 | 35 | 4246 | 35.9 | 0.9 | 124 | 30.8 | 180 | 30.4 | −0.4 | |
| 2 | 1994 | 14.4 | 1672 | 14.2 | −0.2 | 70 | 17.4 | 88 | 14.8 | −2.6 | |
| 3 | 690 | 5 | 541 | 4.6 | −0.4 | 34 | 8.4 | 36 | 6.1 | −2.3 | |
| ≥ 4 | 358 | 2.6 | 332 | 2.8 | 0.2 | 21 | 5.2 | 31 | 5.2 | 0 | |
| Mode of delivery | Spont. vag. | 9269 | 67.3 | 8028 | 68 | 0.7 | 326 | 73.8 | 426 | 71.7 | −2.1 |
| Instrum. | 1686 | 12.3 | 1441 | 12.2 | −0.1 | 33 | 7.5 | 54 | 9.1 | 1.6 | |
| Caesarean | 2820 | 20.5 | 2338 | 19.8 | −0.7 | 83 | 18.8 | 110 | 18.5 | −0.3 | |
| Multiple birth | No | 13,535 | 97.3 | 11,453 | 96.9 | −0.4 | 462 | 96.7 | 564 | 94.9 | −1.8 |
| Yes | 373 | 2.7 | 367 | 3.1 | 0.4 | 16 | 3.3 | 30 | 5.1 | 1.8 | |
| Preterm birth | No | 13,144 | 94.5 | 11,015 | 93.4 | −1.1 | 360 | 79.5 | 407 | 68.8 | −10.7 |
| Yes | 741 | 5.3 | 781 | 6.6 | 1.3 | 93 | 20.5 | 185 | 31.2 | 10.7 | |
| State at birth | Alive | 13,907 | 100 | 11,820 | 100 | 0 | 420 | 88.8 | 463 | 77.9 | −10.9 |
| Stillborn | 0 | 0 | 0 | 0 | 0 | 35 | 7.3 | 75 | 12.6 | 5.3 | |
| Medical abortion | 0 | 0 | 0 | 0 | 0 | 18 | 3.8 | 56 | 9.4 | 5.6 | |
| Birthweight (g) | <2500 | 737 | 5.3 | 789 | 6.7 | 1.4 | 92 | 20.3 | 172 | 20.3 | 0 |
| 2500–2999 | 2752 | 7.1 | 2427 | 20.6 | 13.5 | 72 | 15.9 | 106 | 18 | 2.1 | |
| 3000–3499 | 5719 | 19.8 | 708 | 39.9 | 20.1 | 163 | 36 | 182 | 31 | −5 | |
| 3500–3999 | 3696 | 41.2 | 3047 | 25.8 | −15.4 | 94 | 20.8 | 110 | 18.7 | −2.1 | |
| ≥4000 | 989 | 26.2 | 831 | 7 | −19.2 | 32 | 7.1 | 18 | 3.1 | −4 | |
| 5‐min Apgar score | <8 | 179 | 1.3 | 197 | 1.7 | 0.4 | 35 | 9.3 | 165 | 27.8 | 18.5 |
| ≥8 | 13,650 | 98.7 | 11,594 | 98.3 | −0.4 | 343 | 90.7 | 429 | 72.2 | −18.5 | |
| Transfer to a maternity unit after birth | No | 12,944 | 93.2 | 10,721 | 90.8 | −2.4 | 369 | 84.6 | 348 | 75.2 | −9.4 |
| Yes | 946 | 6.7 | 1083 | 9.2 | 2.5 | 67 | 15.4 | 115 | 24.8 | 9.4 | |
| Characteristics of maternity units | |||||||||||
| Status | Public or non‐profit private | 9952 | 71.6 | 9031 | 76.4 | 4.8 | 324 | 67.8 | 476 | 80.1 | 12.3 |
| Other private | 3955 | 28.4 | 2789 | 23.6 | −4.8 | 154 | 32.2 | 118 | 19.9 | −12.3 | |
| Level of care | I | 4181 | 30.1 | 2700 | 22.8 | −7.3 | 118 | 24.7 | 100 | 16.8 | −7.9 |
| II | 6648 | 47.8 | 6038 | 51 | 3.2 | 221 | 46.2 | 258 | 43.4 | −2.8 | |
| III | 3069 | 22.1 | 3078 | 26 | 3.9 | 139 | 29.1 | 236 | 39.7 | 10.6 | |
Note: Data for metropolitan France from the 2010 and 2016 French NPS.
Abbreviations: BF, breastfeeding; NPS, National Perinatal Surveys.
Table A2.
Individual, maternity unit and department characteristics of the study population in 2010 and 2016
| Individual, maternity unit and department variables | Year | ||
|---|---|---|---|
| Variable | Category | 2010 n (%) | 2016 n (%) |
| Individual characteristics (mother and infant) | |||
| Age (years) | <25 | 1878 (15.4) | 1345 (12.1) |
| 25–<30 | 4131 (33.8) | 3550 (32.0) | |
| 30–<35 | 3874 (31.7) | 3828 (34.5) | |
| ≥35 | 2341 (19.2) | 2366 (21.3) | |
| Average monthly household income (€) | < 1500 | 2186 (17.9) | 1857 (16.7) |
| 1500–2999 | 5612 (45.9) | 4489 (40.5) | |
| ≥3000 | 4426 (36.2) | 4743 (42.8) | |
| Current employment status | Employed | 8747 (71.6) | 7648 (69.0) |
| Unemployed | 1575 (12.9) | 1850 (16.7) | |
| Housewife | 1551 (12.7) | 1278 (11.5) | |
| Other | 351 (2.9) | 313 (2.8) | |
| Level of education | No/primary | 168 (1.4) | 128 (1.2) |
| Lower secondary | 2963 (24.2) | 2276 (20.5) | |
| Upper secondary | 2398 (19.6) | 2380 (21.5) | |
| 1–2 years univ. | 2723 (22.3) | 2181 (19.7) | |
| >2 years univ. | 3972 (32.5) | 4124 (37.2) | |
| Marital status | Not married | 6495 (53.1) | 6631 (59.8) |
| Married | 5729 (46.9) | 4458 (40.2) | |
| Mode of delivery | Spont. vag. | 8241 (67.4) | 7532 (67.9) |
| Instrum. | 1520 (12.4) | 1378 (12.4) | |
| Caesarean | 2463 (20.1) | 2179 (19.7) | |
| Multiple birth | No | 11,886 (97.2) | 10,742 (96.9) |
| Yes | 338 (2.8) | 347 (3.1) | |
| Parity (number of births) | 0 | 5371 (43.9) | 4760 (42.9) |
| 1 | 4302 (35.2) | 4013 (36.2) | |
| 2 | 1722 (14.1) | 1551 (14.0) | |
| 3 | 558 (4.6) | 489 (4.4) | |
| 4 or more | 271 (2.2) | 276 (2.5) | |
| Place of birth | France | 10,295 (84.2) | 9187 (82.8) |
| African country | 1192 (9.8) | 1170 (10.6) | |
| Other country | 737 (6.0) | 732 (6.6) | |
| Pre‐pregnancy BMI (kg/m²) | <18.5 | 978 (8.0) | 836 (7.5) |
| 18.5–24.9 | 7985 (65.3) | 6749 (60.9) | |
| 25–29.9 | 2063 (16.9) | 2209 (19.9) | |
| ≥30 | 1198 (9.8) | 1295 (11.7) | |
| Preterm birth | No | 11,573 (94.7) | 10,361 (93.4) |
| Yes | 651 (5.3) | 728 (6.6) | |
| Time between birth and the interview (days) | 0 | 1641 (13.4) | 1616 (14.6) |
| 1 | 5939 (48.6) | 5703 (51.4) | |
| 2 | 2879 (23.6) | 2697 (24.3) | |
| 3 | 1301 (10.6) | 823 (7.4) | |
| 4 | 384 (3.1) | 197 (1.8) | |
| 5 | 60 (0.5) | 37 (0.3) | |
| 6 | 18 (0.1) | 12 (0.1) | |
| 7 | 2 (0.0) | 4 (0.0) | |
| Characteristics of maternity units | |||
| Baby‐Friendly® Designation | No | 11,627 (95.1) | 9551 (86.1) |
| In process | 350 (2.9) | 826 (7.4) | |
| Yes | 247 (2.0) | 712 (6.4) | |
| BF support | No | 4042 (33.1) | 2692 (24.3) |
| Yes | 8182 (66.9) | 8397 (75.7) | |
| Level of care | I | 3696 (30.2) | 2541 (22.9) |
| II | 5815 (47.6) | 5678 (51.2) | |
| III | 2713 (22.2) | 2870 (25.9) | |
| Size (annual deliveries) | <500 | 314 (2.6) | 305 (2.8) |
| 500–<1000 | 1835 (15.0) | 1701 (15.3) | |
| 1000–<1500 | 2585 (21.1) | 1762 (15.9) | |
| 1500–<2000 | 1686 (13.8) | 1654 (14.9) | |
| 2000–<2500 | 1993 (16.3) | 1357 (12.2) | |
| 2500–<3000 | 1582 (12.9) | 1100 (9.9) | |
| 3000–<3500 | 1118 (9.1) | 1481 (13.4) | |
| 3500–<4000 | 563 (4.6) | 764 (6.9) | |
| ≥4000 | 548 (4.5) | 965 (8.7) | |
| Status | Public reg./univ. | 2075 (17.0) | 2106 (19.0) |
| Other public | 5769 (47.2) | 5516 (49.7) | |
| Non‐profit private | 930 (7.6) | 841 (7.6) | |
| Other private | 3450 (28.2) | 2626 (23.7) | |
| Characteristics of departments | |||
| Immigrants in a department (%) | <5 | 3254 (29.5) | 2498 (22.7) |
| 5–<10 | 4840 (43.9) | 4271 (38.7) | |
| 10–<15 | 2145 (19.4) | 2269 (20.6) | |
| 15–<20 | 1052 (9.5) | 851 (7.7) | |
| 20–<25 | 627 (5.7) | 895 (8.1) | |
| 25–<31 | 306 (2.8) | 305 (2.8) | |
| Median household income in a department (€1000) | <18 | 2415 (21.9) | 305 (2.8) |
| 18–<20 | 5780 (52.4) | 2770 (25.1) | |
| 20–<22 | 2273 (20.6) | 5211 (47.3) | |
| 22–<24 | 432 (3.9) | 1395 (12.7) | |
| 24–<27 | 1324 (12.0) | 1408 (12.8) | |
| University graduates in a department (%) | 10–<20 | 2567 (23.3) | 382 (3.5) |
| 20–<30 | 7090 (64.2) | 6138 (55.7) | |
| 30–<40 | 1502 (13.6) | 3070 (27.9) | |
| 40–<50 | 438 (4.0) | 503 (4.6) | |
| 50–<61 | 627 (5.7) | 996 (9.0) | |
| Urban population in a department (%) | 20–<40 | 70 (0.6) | 51 (0.5) |
| 40–<60 | 1612 (14.6) | 1388 (12.6) | |
| 60–<80 | 3783 (34.3) | 3690 (33.5) | |
| 80–100 | 6759 (61.2) | 5960 (54.1) | |
Note: Data for metropolitan France from the 2010 and 2016 French National Perinatal Surveys.
Abbreviations: BF, breastfeeding; BMI, body mass index.
Table A3.
Difference in predicted exclusive, mixed and any BF initiation rates between each variable level and the reference level (i.e., marginal effect) of the covariates included in the final model (Model 6)
| BF type | |||||
|---|---|---|---|---|---|
| Variable | Level | Reference | Exclusive | Mixed | Any |
| Individual characteristics (infants and mothers) | |||||
| Average monthly household income (€) | 1500–2999 | <1500 | 1.5 [0.7, 2.3] | −2.3 [−3.5, −1.1] | −0.8 [−1.2, −0.4] |
| ≥3000 | ‐ | 2.4 [1.5, 3.3] | −3.7 [−5.1, −2.4] | −1.3 [−1.8, −0.8] | |
| Level of education | No/primary | >2 years univ. | −22.3 [−28.4, −16.1] | −0.4 [−3.3, 3.1] | −22.7 [−28.9, −16.6] |
| Lower secondary | ‐ | −21.7 [−23.5, −19.9] | −1.1 [−2.2, 0.1] | −22.7 [−24.4, −21.0] | |
| Upper secondary | ‐ | −14.9 [−16.7, −13.2] | −0.8 [−1.9, 0.3] | −15.7 [−17.4, −14.2] | |
| 1–2 years univ. | ‐ | −7.7 [−9.4, −6.0] | −0.6 [−1.6, 0.6] | −8.3 [−9.9, −6.8] | |
| Marital status | Married | Not married | 5.2 [4.2, −6.3] | 0.9 [0.8, 1.1] | 6.2 [5.0, 7.4] |
| Mode of delivery | Instrum. | Spont. vag. | −4.0 [−5.9, −2.2] | 1.4 [0.3, 2.6] | −2.6 [−4.4, −0.8] |
| Caesarean | ‐ | −6.6 [−8.3, −4.9] | 3.7 [2.7, 4.7] | −2.9 [−4.4, −1.4] | |
| Multiple birth | Yes | No | −26.0 [−29.7, −22.3] | 11.6 [8.9, 14.5] | −14.4 [−18.2, −10.8] |
| Parity (number of births) | 0 | 1 | 2.0 [0.1, 4.0] | 0.3 [−0.6, 1.3] | 2.4 [−0.2, 4.9] |
| 2 | ‐ | 3.5 [1.9, 5.3] | 2.6 [0.7, 4.7] | 6.1 [3.2, 8.9] | |
| 3 | ‐ | 4.4 [1.9, 6.8] | 5.0 [2.0, 8.5] | 9.4 [5.1, 13.5] | |
| 4 | ‐ | 2.3 [−1.1, 6.0] | 5.3 [2.3, 8.8] | 7.6 [3.5, 11.8] | |
| 5 | ‐ | 0.4 [−4.6, 5.4] | 4.4 [1.3, 7.4] | 4.8 [−0.5, 9.7] | |
| Place of birth | African country | France | 13.8 [11.6, 15.6] | 10.5 [8.9, 12.2] | 24.3 [22.6, 25.8] |
| Other country | ‐ | 15.1 [12.8, 17.5] | 3.5 [1.9, 5.1] | 18.6 [16.4, 20.7] | |
| Pre‐pregnancy BMI (kg/m²) | 15 | 24 | −5.5 [−12.1, 0.7] | −2.9 [−5.6, −0.0] | −8.4 [−17.5, 0.2] |
| 20 | ‐ | −0.6 [−2.4, 1.4] | −1.7 [−3.5, 0.0] | −2.3 [−5.5, 1.0] | |
| 25 | ‐ | −0.5 [−0.8, −0.2] | 0.4 [0.2, 0.7] | −0.1 [−0.4, 0.2] | |
| 30 | ‐ | −4.5 [−6.9, −2.4] | 1.5 [−0.4, 3.4] | −3.1 [−6.6, 0.5] | |
| 35 | ‐ | −9.7 [−16.5, −3.7] | −0.2 [−5.4, 5.7] | −9.9 [−21.6, 1.8] | |
| 40 | ‐ | −14.2 [−26.4, −4.1] | −2.1 [−9.0, 8.1] | −16.3 [−35.4, 2.9] | |
| Preterm birth | Yes | No | −19.6 [−22.2, −17.0] | 11.4 [9.4, 13.7] | −8.2 [−10.7, −5.6] |
| Time between delivery and interview (days) | 0 | 1 | 3.0 [2.4, 3.7] | −1.6 [−1.9, −1.3] | 1.4 [0.8, 1.9] |
| 2 | ‐ | −3.2 [−3.9, −2.6] | 1.9 [1.5, 2.3] | −1.3 [−1.9, −0.7] | |
| 3 | ‐ | −6.5 [−7.9, −5.3] | 4.0 [3.2, 5.0] | −2.5 [−3.6, −1.3] | |
| 4 | ‐ | −10.0 [−12.0, −8.1] | 6.5 [5.0, 8.1] | −3.5 [−5.2, −1.7] | |
| 5 | ‐ | −13.5 [−16.3, −10.9] | 9.2 [6.9, 11.6] | −4.3 [−6.7, −1.9] | |
| 6 | ‐ | −17.1 [−20.4, −13.9] | 12.2 [9.1, 15.5] | −4.9 [−7.9, −1.9] | |
| 7 | ‐ | −20.7 [−24.6, −16.8] | 15.4 [11.3, 19.8] | −5.3 [−9.0, −1.6] | |
| Characteristics of maternity units | |||||
| Baby‐Friendly® designation | In process | No | 3.8 [1.0, 6.6] | −1.4 [−3.3, 0.8] | 2.4 [−0.1, 4.9] |
| Yes | ‐ | 8.1 [4.6, 11.3] | −0.7 [−3.1, 2.0] | 7.4 [4.8, 9.9] | |
| Level of care | I | III | 1.3 [0.3, 2.2] | −1.9 [−3.3, −0.4] | −0.6 [−1.1, −0.1] |
| II | ‐ | 0.0 [−0.8, 0.9] | 0.0 [−1.3, 1.3] | 0.0 [−0.4, 0.5] | |
| Size (annual deliveries) | 500 | 2135 | −1.8 [−3.1, −0.6] | −0.3 [−0.5, −0.1] | −2.1 [−3.6, −0.7] |
| 1000 | ‐ | −1.3 [−2.1, −0.6] | −0.2 [−0.4, −0.1] | −1.5 [−2.5, −0.7] | |
| 2000 | ‐ | −0.2 [−0.3, −0.1] | −0.0 [−0.1, −0.0] | −0.2 [−0.3, −0.1] | |
| 3000 | ‐ | 1.3 [0.7, 1.8] | 0.2 [0.1, 0.3] | 1.5 [0.9, 2.2] | |
| 4000 | ‐ | 2.9 [1.7, 4.0] | 0.5 [0.3, 0.7] | 3.5 [2.1, 4.7] | |
| 5000 | ‐ | 4.8 [3.0, 6.6] | 0.9 [0.5, 1.2] | 5.6 [3.6, 7.7] | |
| 6000 | ‐ | 6.5 [3.8, 9.3] | 1.2 [0.7, 1.7] | 7.7 [4.5, 11.0] | |
| Status | Other public | Public reg./univ. | 1.4 [0.5, 2.4] | −2.1 [−3.6, −0.8] | −0.8 [−1.3, −0.3] |
| Non‐profit private | ‐ | 1.3 [−0.1, 2.6] | −2.0 [−4.0, 0.2] | −0.7 [−1.4, 0.1] | |
| Other private | ‐ | 1.0 [−0.1, 2.1] | −1.6 [−3.2, 0.1] | −0.6 [−1.2, −0.0] | |
| Characteristics of departments | |||||
| Immigrants in a department (%) | 5 | 10 | 1.7 [0.7, 2.8] | −1.7 [−3.2, −0.2] | 0.0 [−1.0, 1.0] |
| 15 | ‐ | −3.8 [−7.5, −0.2] | −0.6 [−3.1, 2.2] | −4.4 [−10.3, 1.3] | |
| 20 | ‐ | −7.8 [−16.4, −0.4] | −2.0 [−6.5, −3.6] | −9.8 [−22.4, 2.7] | |
| 25 | ‐ | −10.3 [−21.8, −0.4] | −2.7 [−8.3, 5.4] | −13.0 [−29.5, 3.4] | |
| 30 | ‐ | −11.8 [−25.6, −0.7] | −3.8 [−10.1, 6.6] | −15.6 [−35.1, 4.1] | |
| University graduates in a department (%) | 10 | 29 | −5.7 [−9.6, −2.0] | −1.0 [−1.7, −0.4] | −6.8 [−11.3, −2.4] |
| 20 | ‐ | −2.9 [−4.4, −1.3] | −0.5 [−0.8, −0.2] | −3.4 [−5.2, −1.5] | |
| 30 | ‐ | 0.2 [−0.0, 0.4] | 0.0 [−0.0, 0.1] | 0.2 [−0.0, 0.5] | |
| 40 | ‐ | 0.3 [−1.5, 2.1] | 0.1 [−0.3, 0.4] | 0.4 [−1.8, 2.4] | |
| 50 | ‐ | −1.1 [−4.5, 2.0] | −0.2 [−0.8, 0.4] | −1.3 [−5.3, 2.4] | |
| 60 | ‐ | −3.4 [−8.0, 1.3] | −0.6 [−1.4, 0.2] | −4.0 [−9.4, 1.6] | |
Note: Any BF initiation rate is equal to the sum of exclusive and mixed BF initiation rates. Model 6 was built by cumulatively including: a year index (Model 1), spatial random effect (Model 2), individual characteristics (Model 3), maternity unit characteristics (Model 4), French department characteristics (Model 5) and interaction terms between the year and the covariates (Model 6). Data for metropolitan France from the 2010 and 2016 French National Perinatal Surveys.
Abbreviations: BF, breastfeeding; BMI, body mass index.
Guajardo‐Villar, A. , Demiguel, V. , Smaïli, S. , Boudet‐Berquier, J. , Pilkington, H. , Blondel, B. , Salanave, B. , Regnault, N. , & Pelat, C. (2022). Trends and disparities in breastfeeding initiation in France between 2010 and 2016: Results from the French National Perinatal Surveys. Maternal & Child Nutrition, 18, e13410. 10.1111/mcn.13410
DATA AVAILABILITY STATEMENT
Research data from the French National Perinatal Survey are not shared. The data sources of the department characteristics used for this study are openly available in the French National Institute of Statistics and Economic Studies (INSEE) at https://www.insee.fr/. These data were derived from the following resources available in the INSEE:
-
1.
[Data set] French National Institute of Statistics and Economic Studies (INSEE). (2013a). Education in 2010—Population census—detailed tables. Retrieved from https://www.insee.fr/fr/statistiques/2053487?sommaire=2118583. BTX_TD_FOR2_2010.xls Retrieved 21/06/2019 https://www.insee.fr/fr/statistiques/2053487?sommaire=2118583.
-
2.
[Data set] French National Institute of Statistics and Economic Studies (INSEE). (2013b). Nationality and immigration in 2010—Population census—detailed tables. Retrieved from https://www.insee.fr/fr/statistiques/2053205?sommaire=2403632. BTX_TD_IMG1A_pop_immigree_2010.xls Retrieved 24/09/2019 https://www.insee.fr/fr/statistiques/2053205?sommaire=2403632.
-
3.
[Data set] French National Institute of Statistics and Economic Studies (INSEE). (2013c). Revenue inequalities and living standards in 2010—detailed tables. Retrieved from https://www.insee.fr/fr/statistiques/2388998. inegalite‐rev_niveau‐vie_2010‐deciles‐niveau‐vie.xls Retrieved 25/06/2019 https://www.insee.fr/fr/statistiques/2388998.
-
4.
[Data set] French National Institute of Statistics and Economic Studies (INSEE). (2019a). Education in 2016—Population census—detailed tables. Retrieved from https://www.insee.fr/fr/statistiques/4171399?sommaire=4171407. BTX_TD_FOR2_2016.xls Retrieved 25/06/2019 https://www.insee.fr/fr/statistiques/4171399?sommaire=4171407.
-
5.
[Data set] French National Institute of Statistics and Economic Studies (INSEE). (2019b). Nationality and immigration in 2016—Population census—detailed tables. Retrieved from https://www.insee.fr/fr/statistiques/4171508?sommaire=4171510. BTX_TD_IMG1A_pop_immigree_2016.xls Retrieved 21/06/2019 https://www.insee.fr/fr/statistiques/4171508?sommaire=4171510.
-
6.
[Data set] French National Institute of Statistics and Economic Studies (INSEE). (2019c). Revenues and poverty of households in 2016—detailed tables. Retrieved from https://www.insee.fr/fr/statistiques/4190004. base‐cc‐filosofi_niveau_vie‐2016.xls Retrieved 25/06/2019 https://www.insee.fr/fr/statistiques/4190004.
-
7.
[Data set] French National Institute of Statistics and Economic Studies (INSEE). (2019d). Urban units database in France. Retrieved from https://www.insee.fr/fr/information/2115018. UU2010 au 01‐01‐2019.xls vien Retrieved 26/03/19 https://www.insee.fr/fr/information/2115018.
REFERENCES
- Baxter, J. , Cooklin, A. R. , & Smith, J. (2009). Which mothers wean their babies prematurely from full breastfeeding? An Australian cohort study. Acta Paediatrica, 98(8), 1274–1277. 10.1111/j.1651-2227.2009.01335.x [DOI] [PubMed] [Google Scholar]
- Besag, J. , York, J. , & Mollie, A. (1991). Bayesian image restoration, with two applications in spatial statistics. Annals of the Institute of Statistical Mathematics, 43, 1–59. [Google Scholar]
- Bhattacharjee, N. V. , Schaeffer, L. E. , Marczak, L. B. , Ross, J. M. , Swartz, S. J. , Albright, J. , Gardner, W. M. , Shields, C. , Sligar, A. , Schipp, M. F. , Pickering, B. V. , Henry, N. J. , Johnson, K. B. , Louie, C. , Cork, M. A. , Steuben, K. M. , Lazzar‐Atwood, A. , Lu, D. , Kinyoki, D. K. ,… Hay, S. I. (2019). Mapping exclusive breastfeeding in Africa between 2000 and 2017. Nature Medicine, 25, 1205–1212. 10.1038/s41591-019-0525-0 [DOI] [PMC free article] [PubMed] [Google Scholar]
- Blondel, B. , Coulm, B. , Bonnet, C. , Goffinet, F. , & Le Ray, C. (2017). Trends in perinatal health in metropolitan France from 1995 to 2016: Results from the French National Perinatal Surveys. Journal of Gynecology Obstetrics and Human Reproduction, 46(10), 701–713. 10.1016/j.jogoh.2017.09.002 [DOI] [PubMed] [Google Scholar]
- Blondel, B. , Coulm, B. , Bonnet, C. , Vanhaesebrouck, A. , Vilain, A. , Fresson, J. , & Raynaud, P. (2017). Enquête nationale périnatale 2016. Les naissances et les établissements, situation et évolution depuis 2010. http://drees.solidarites-sante.gouv.fr/etudes-et-statistiques/publications/recueils-ouvrages-et-rapports/rapports/article/enquete-nationale-perinatale-2016-les-naissances-et-les-etablissements
- Blondel, B. , & Kermarrec, M. (2011). Enquête nationale périnatale 2010. Les naissances en 2010 et leur évolution depuis 2003. https://drees.solidarites-sante.gouv.fr/etudes-et-statistiques/publications/recueils-ouvrages-et-rapports/rapports/article/les-naissances-en-2010-et-leur-evolution-en-2003
- Bonet, M. , Blondel, B. , & Khoshnood, B. (2010). Evaluating regional differences in breast‐feeding in French maternity units: A multi‐level approach. Public Health Nutrition, 13(12), 1946–1954. 10.1017/S136898001000159X [DOI] [PMC free article] [PubMed] [Google Scholar]
- Cattaneo, A. , Yngve, A. , Koletzko, B. , Guzman, L. R. , & Promotion of Breastfeeding in Europe project . (2005). Protection, promotion and support of breast‐feeding in Europe: Current situation. Public Health Nutrition, 8(1), 39–46. 10.1079/phn2005660 [DOI] [PubMed] [Google Scholar]
- Cohen, S. S. , Alexander, D. D. , Krebs, N. F. , Young, B. E. , Cabana, M. D. , Erdmann, P. , Hays, N. P. , Bezold, C. P. , Levin‐Sparenberg, E. , Turini, M. , & Saavedra, J. M. (2018). Factors associated with breastfeeding initiation and continuation: A meta‐analysis. Journal of Pediatrics, 203, 190–196. 10.1016/j.jpeds.2018.08.008 [DOI] [PubMed] [Google Scholar]
- Courtois, F. , Péneau, S. , Salanave, B. , Andreeva, V. A. , Roland‐Cachera, M. F. , Touvier, M. , Galan, P. , Hercberg, S. , & Fezeu, L. K. (2021). Trends in breastfeeding practices and mothers' experience in the French NutriNet‐Sante cohort. International Breastfeeding Journal, 16(1), 50. 10.1186/s13006-021-00397-x [DOI] [PMC free article] [PubMed] [Google Scholar]
- French National Institute of Statistics and Economic Studies (INSEE) . (2013a). Education in 2010—Population census—Detailed tables. https://www.insee.fr/fr/statistiques/2053487?sommaire=2118583
- French National Institute of Statistics and Economic Studies (INSEE) . (2013b). Nationality and immigration in 2010—Population census—Detailed tables. https://www.insee.fr/fr/statistiques/2053205?sommaire=2403632
- French National Institute of Statistics and Economic Studies (INSEE) . (2013c). Revenue inequalities and living standards in 2010—Detailed tables. https://www.insee.fr/fr/statistiques/2388998
- French National Institute of Statistics and Economic Studies (INSEE) . (2018). Géographie administrative et d'étude. https://www.insee.fr/fr/information/2016807
- French National Institute of Statistics and Economic Studies (INSEE) . (2019a). Education in 2016—Population census—Detailed tables. https://www.insee.fr/fr/statistiques/4171399?sommaire=4171407
- French National Institute of Statistics and Economic Studies (INSEE) . (2019b). Nationality and immigration in 2016—Population census—Detailed tables. https://www.insee.fr/fr/statistiques/4171508?sommaire=4171510
- French National Institute of Statistics and Economic Studies (INSEE) . (2019c). Revenues and poverty of households in 2016—Detailed tables. https://www.insee.fr/fr/statistiques/4190004
- French National Institute of Statistics and Economic Studies (INSEE) . (2019d). Urban units database in France. https://www.insee.fr/fr/information/2115018
- Gilbert, N. L. , Bartholomew, S. , Raynault, M. F. , & Kramer, M. S. (2014). Temporal trends in social disparities in maternal smoking and breastfeeding in Canada, 1992‐2008. Maternal and Child Health Journal, 18(8), 1905–1911. 10.1007/s10995-014-1434-y [DOI] [PubMed] [Google Scholar]
- Howe‐Heyman, A. , & Lutenbacher, M. (2016). The Baby‐Friendly Hospital Initiative as an intervention to improve breastfeeding rates: A review of the literature. Journal of Midwifery & Women's Health, 61(1), 77–102. 10.1111/jmwh.12376 [DOI] [PubMed] [Google Scholar]
- Kersuzan, C. , Gojard, S. , Tichit, C. , Thierry, X. , Wagner, S. , & Nicklaus, S. (2014). Breastfeeding prevalence in maternity wards according to parents and delivery characteristics. Results from the ELFE Survey in maternity units, mainland France, 2011. Bulletin Epidemiologique Hebdomadaire, 27, 440–449. [Google Scholar]
- Kersuzan, C. , Gojard, S. , Tichit, C. , Thierry, X. , Wagner, S. , Nicklaus, S. , & de Lauzon‐Guillain, B. (2014). Prévalence de l'allaitement à la maternité selon les caractéristiques des parents et les conditions de l'accouchement. Résultats de l'Enquête Elfe maternité, France métropolitaine, 2011. Bulletin Epidémiologique Hebdomadaire—BEH, 27(27), 440–449. https://hal.archives-ouvertes.fr/hal-01190119 [Google Scholar]
- Marra, G. , & Wood, S. N. (2011). Practical variable selection for generalized additive models. Computational Statistics & Data Analysis, 55(7), 2372–2387. 10.1016/j.csda.2011.02.004 [DOI] [Google Scholar]
- Mitha, A. , Piedvache, A. , Glorieux, I. , Zeitlin, J. , Roué, J. M. , Blondel, B. , Durox, M. , Burguet, A. , Kaminski, M. , Ancel, P. Y. , Pierrat, V. , & EPIPAGE‐ Neurodevelopmental Care Writing, G. (2019). Unit policies and breast milk feeding at discharge of very preterm infants: The EPIPAGE‐2 cohort study. Paediatric and Perinatal Epidemiology, 33(1), 59–69. 10.1111/ppe.12536 [DOI] [PubMed] [Google Scholar]
- Muller, C. J. , & MacLehose, R. F. (2014). Estimating predicted probabilities from logistic regression: Different methods correspond to different target populations. International Journal of Epidemiology, 43(3), 962–970. 10.1093/ije/dyu029 [DOI] [PMC free article] [PubMed] [Google Scholar]
- Oakley, L. L. , Kurinczuk, J. J. , Renfrew, M. J. , & Quigley, M. A. (2016). Breastfeeding in England: Time trends 2005‐2006 to 2012‐2013 and inequalities by area profile. Maternal & Child Nutrition, 12(3), 440–451. 10.1111/mcn.12159 [DOI] [PMC free article] [PubMed] [Google Scholar]
- Pierrat, V. , Coquelin, A. , Cuttini, M. , Khoshnood, B. , Glorieux, I. , Claris, O. , Durox, M. , Kaminski, M. , Ancel, P. Y. , Arnaud, C. , & EPIPAGE‐ Neurodevelopmental Care Writing, G. (2016). Translating neurodevelopmental care policies into practice: The experience of neonatal ICUs in France—The EPIPAGE‐2 cohort study. Pediatric Critical Care Medicine: A Journal of the Society of Critical Care Medicine and the World Federation of Pediatric Intensive and Critical Care Societies, 17(10), 957–967. 10.1097/PCC.0000000000000914 [DOI] [PMC free article] [PubMed] [Google Scholar]
- Rollins, N. C. , Bhandari, N. , Hajeebhoy, N. , Horton, S. , Lutter, C. K. , Martines, J. C. , & Victora, C. G. (2016). Why invest, and what it will take to improve breastfeeding practices? Lancet, 387(10017), 491–504. 10.1016/s0140-6736(15)01044-2 [DOI] [PubMed] [Google Scholar]
- Salanave, B. , de Launay, C. , Guerrisi, C. , & Castetbon, K. (2012). Breastfeeding rates in maternity units and at 1 month. Results from the EPIFANE survey, France, 2012. Bulletin Epidemiologique Hebdomadaire, 34, 383–387. [Google Scholar]
- Simpson, D. A. , Quigley, M. A. , Kurinczuk, J. J. , & Carson, C. (2019). Twenty‐five‐year trends in breastfeeding initiation: The effects of sociodemographic changes in Great Britain, 1985‐2010. PLoS One, 14(1), e0210838. 10.1371/journal.pone.0210838 [DOI] [PMC free article] [PubMed] [Google Scholar]
- Victora, C. G. , Bahl, R. , Barros, A. J. , França, G. V. , Horton, S. , Krasevec, J. , Murch, S. , Sankar, M. J. , Walker, N. , Rollins, N. C. , & Lancet Breastfeeding Series, G. (2016). Breastfeeding in the 21st century: Epidemiology, mechanisms, and lifelong effect. Lancet, 387(10017), 475–490. 10.1016/S0140-6736(15)01024-7. [DOI] [PubMed] [Google Scholar]
- Victora, C. G. , Rollins, N. C. , Murch, S. , Krasevec, J. , & Bahl, R. (2016). Breastfeeding in the 21st century—Authors' reply. Lancet, 387(10033), 2089–2090. 10.1016/S0140-6736(16)30538-4 [DOI] [PubMed] [Google Scholar]
- Vilain, A. (2011). Enquête nationale périnatale 2010. Les maternités en 2010 et leur évolution depuis 2003. https://drees.solidarites-sante.gouv.fr/etudes-et-statistiques/publications/recueils-ouvrages-et-rapports/rapports/article/les-maternites-en-2010-et-leur-evolution-depuis-2003
- Wang, C.‐Y. , & Hsu, L. (2020). Multinomial logistic regression with missing outcome data: An application to cancer subtypes. Statistics in Medicine, 39(24), 3299–3312. 10.1002/sim.8666 [DOI] [PMC free article] [PubMed] [Google Scholar]
- Wood, S. N. (2001). mgcv: GAMs and generalized ridge regression for R. R News, 1(2), 20–25. [Google Scholar]
- Wood, S. N. (2017). Generalized additive models: An introduction with R (2nd ed.). Chapman and Hall/CRC. [Google Scholar]
- World Health Organization, & UNICEF . (2018). Capturethe Moment – Early Initiation of Breastfeeding: The Best Start for Everynewborn. https://www.unicef.org/publications/index_102949.html
- World Health Organization, UNICEF, & Wellstart International . (1991). The Baby‐Friendly Hospital Initiative: Monitoring and reassessment: Tools to sustain progress. https://apps.who.int/iris/handle/10665/65380
- Yngve, A. , & Sjostrom, M. (2001). Breastfeeding in countries of the European Union and EFTA: Current and proposed recommendations, rationale, prevalence, duration and trends. Public Health Nutrition, 4(2B), 631–645. 10.1079/phn2001147 [DOI] [PubMed] [Google Scholar]
Associated Data
This section collects any data citations, data availability statements, or supplementary materials included in this article.
Data Availability Statement
Research data from the French National Perinatal Survey are not shared. The data sources of the department characteristics used for this study are openly available in the French National Institute of Statistics and Economic Studies (INSEE) at https://www.insee.fr/. These data were derived from the following resources available in the INSEE:
-
1.
[Data set] French National Institute of Statistics and Economic Studies (INSEE). (2013a). Education in 2010—Population census—detailed tables. Retrieved from https://www.insee.fr/fr/statistiques/2053487?sommaire=2118583. BTX_TD_FOR2_2010.xls Retrieved 21/06/2019 https://www.insee.fr/fr/statistiques/2053487?sommaire=2118583.
-
2.
[Data set] French National Institute of Statistics and Economic Studies (INSEE). (2013b). Nationality and immigration in 2010—Population census—detailed tables. Retrieved from https://www.insee.fr/fr/statistiques/2053205?sommaire=2403632. BTX_TD_IMG1A_pop_immigree_2010.xls Retrieved 24/09/2019 https://www.insee.fr/fr/statistiques/2053205?sommaire=2403632.
-
3.
[Data set] French National Institute of Statistics and Economic Studies (INSEE). (2013c). Revenue inequalities and living standards in 2010—detailed tables. Retrieved from https://www.insee.fr/fr/statistiques/2388998. inegalite‐rev_niveau‐vie_2010‐deciles‐niveau‐vie.xls Retrieved 25/06/2019 https://www.insee.fr/fr/statistiques/2388998.
-
4.
[Data set] French National Institute of Statistics and Economic Studies (INSEE). (2019a). Education in 2016—Population census—detailed tables. Retrieved from https://www.insee.fr/fr/statistiques/4171399?sommaire=4171407. BTX_TD_FOR2_2016.xls Retrieved 25/06/2019 https://www.insee.fr/fr/statistiques/4171399?sommaire=4171407.
-
5.
[Data set] French National Institute of Statistics and Economic Studies (INSEE). (2019b). Nationality and immigration in 2016—Population census—detailed tables. Retrieved from https://www.insee.fr/fr/statistiques/4171508?sommaire=4171510. BTX_TD_IMG1A_pop_immigree_2016.xls Retrieved 21/06/2019 https://www.insee.fr/fr/statistiques/4171508?sommaire=4171510.
-
6.
[Data set] French National Institute of Statistics and Economic Studies (INSEE). (2019c). Revenues and poverty of households in 2016—detailed tables. Retrieved from https://www.insee.fr/fr/statistiques/4190004. base‐cc‐filosofi_niveau_vie‐2016.xls Retrieved 25/06/2019 https://www.insee.fr/fr/statistiques/4190004.
-
7.
[Data set] French National Institute of Statistics and Economic Studies (INSEE). (2019d). Urban units database in France. Retrieved from https://www.insee.fr/fr/information/2115018. UU2010 au 01‐01‐2019.xls vien Retrieved 26/03/19 https://www.insee.fr/fr/information/2115018.