

Summary
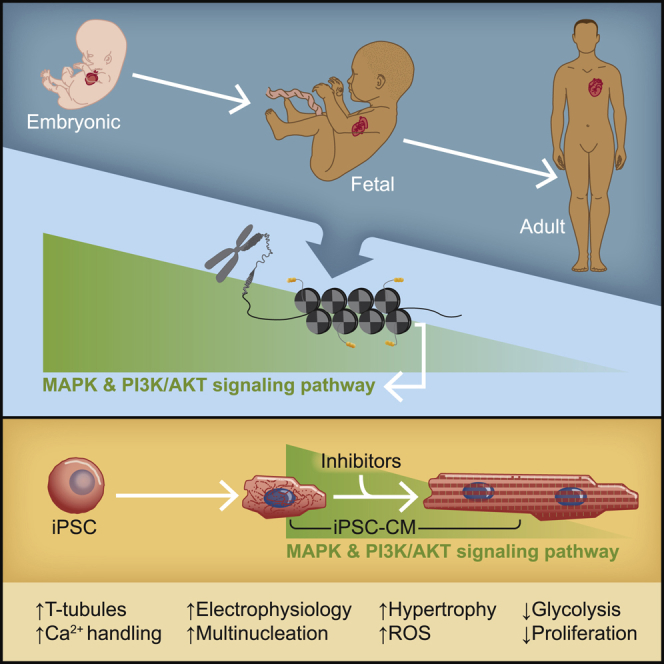
Human induced pluripotent stem cell-derived cardiomyocytes (hiPSC-CMs) provide great opportunities for mechanistic dissection of human cardiac pathophysiology; however, hiPSC-CMs remain immature relative to the adult heart. To identify novel signaling pathways driving the maturation process during heart development, we analyzed published transcriptional and epigenetic datasets from hiPSC-CMs and prenatal and postnatal human hearts. These analyses revealed that several components of the MAPK and PI3K-AKT pathways are downregulated in the postnatal heart. Here, we show that dual inhibition of these pathways for only 5 days significantly enhances the maturation of day 30 hiPSC-CMs in many domains: hypertrophy, multinucleation, metabolism, T-tubule density, calcium handling, and electrophysiology, many equivalent to day 60 hiPSC-CMs. These data indicate that the MAPK/PI3K/AKT pathways are involved in cardiomyocyte maturation and provide proof of concept for the manipulation of key signaling pathways for optimal hiPSC-CM maturation, a critical aspect of faithful in vitro modeling of cardiac pathologies and subsequent drug discovery.
Keywords: pluripotent stem cells, cardiomyocyte, maturation, MAPK, PI3K-AKT, inhibitors, multinucleation, calcium handling, electrophysiology
Graphical abstract
Highlights
-
•
MAPK/PI3K/AKT signaling decreases across time in human ventricular heart tissue
-
•
A 5 day treatment of hiPSC-CMs with MAPK/PI3K/AKT inhibitors advances maturation
-
•
CM maturation reached with inhibitors is superior to untreated older cultures
In this article, Garay and colleagues show that the MAPK and PI3K/AKT signaling pathways are downregulated in the adult ventricular heart tissue. Inhibition of these signaling pathways in vitro, for only 5 days, can enhance the maturation status of human iPSC-derived cardiomyocytes across multiple domains. This short protocol opens the possibility for synergistic use with other known inducers of cardiac maturation to potentially reach adult-level maturation.
Introduction
Cardiovascular disease is the leading cause of morbidity and mortality worldwide (Roth et al., 2020). Human induced pluripotent stem cell (hiPSC)-derived cardiomyocytes (hiPSC-CMs) hold great promise for drug discovery and heart disease modeling. Unfortunately, traditional methods of CM differentiation produce cells that show an early fetal transcriptional, epigenetic, and metabolic profile, thus limiting their application for diseases of the adult heart.
CM maturation is a complex and finely tuned process from prenatal to postnatal stages. During the embryonic and fetal periods of heart development, the expression of many sarcomeric genes becomes temporally and topographically restricted. For example, expression of the ventricular isoform of myosin light chain (MLC-2v) is detected in the primitive heart several days after expression of the atrial isoform (MLC-2a) (Franco et al., 1998) but becomes restricted to the ventricular chambers in the adult heart (Iorga et al., 2017). As such, the MLC-2v/MLC-2a ratio is commonly used as a maturation benchmark of ventricular hiPSC-CMs. Similarly, the transition from the fetal to neonatal and adult heart can be traced by the stoichiometric molecular switch from ssTnI (slow skeletal troponin I), present in the fetal heart; to the neonatal heart, which expresses both ssTnI and cTnI (cardiac troponin I); to the adult heart, which expresses only cTnI (Bedada et al., 2014). Postnatally, human CMs show an increase in cell volume (hypertrophy), multinucleation, and a decrease in proliferation (Bergmann et al., 2015). Structurally, the sarcomere length (SL) during diastole increases to an average of 2.25 μm (Sonnenblick et al., 1967). These structural changes are intimately coupled to a series of physiologic changes that adapt the heart to work under increasing pressure, including improved calcium (Ca2+) handling (Høydal et al., 2018) and a metabolic switch from glycolysis to oxidative phosphorylation (OXPHOS) (Stanley et al., 2005).
To date, numerous protocols have been developed to improve the maturation status of hiPSC-CMs, ranging widely in the type of intervention and ease of implementation. Early studies showed that increased culture time (Lundy et al., 2013) greatly improved several morphological features, such as SL, multinucleation, and cell surface area. Others have shown that electrical pacing (Chan et al., 2013), 3-dimmensional tissues (Ronaldson-Bouchard et al., 2018), and soluble factors (Yoshida et al., 2018) can enhance CM maturation. Unfortunately, most of these methods require sophisticated platforms, equipment, and expertise that are not as readily affordable or accessible, making their wide application more limited.
In this study, we curate multiomic datasets from both hiPSC-CMs and human cardiac tissue to gain insights into signaling pathways that regulate CM maturation. We show that inhibition of the mitogen-activated protein kinase (MAPK) and phosphoinositide 3-kinase (PI3K)-AKT pathways on hiPSC-CMs, for only 5 days, results in enhanced maturity in many domains: transcription, structure, metabolism and electrophysiology. Therefore, these results represent a short and robust protocol to reach day 60 maturation levels in day 30 hiPSC-CMs.
Results
Signaling pathways downregulated in the adult heart
To better understand the signaling pathways that regulate cardiac maturation, we retrieved transcriptomic and epigenomic datasets from hiPSC-CMs and human heart tissue across the lifespan (Figure 1A; Table S1). We focused on protein-coding genes and loci of human ventricular tissue to facilitate comparative analysis with ventricular hiPSC-CMs generated via Wnt modulation (Lian et al., 2012). Principal-component (PC) analysis showed distinct separation between hiPSC-CMs and prenatal and postnatal human heart samples (Figures 1B and S1A), with in vitro CMs clustering closer to the fetal samples than to the adult ones (Figures S1B–S1D), in agreement with previous observations (Uosaki et al., 2015). Of note, the 3-year-old child samples clustered together with the adult samples (Figures S1A–S1D). Pairwise comparisons identified 10,597 and 11,571 differentially expressed genes (DEGs) between adult versus fetal, and adult versus in vitro, respectively, with 7,736 DEGs in common (Figure 1C). Unsupervised hierarchical clustering of the top 1,000 DEGs shared among all groups revealed three distinct clusters (Figures 1D and S1E). Gene Ontology (GO) analysis of these clusters showed enriched genes related to canonical Wnt pathway (cluster 1), lipid transport (cluster 2), and OXPHOS (cluster 3). Similarly, gene set enrichment (GSE) analysis of adult versus in vitro CMs revealed that the Wnt/Hippo signaling pathways and cell cycle are significantly downregulated in the adult, while OXPHOS, peroxisome proliferator-activated receptor (PPAR) signaling pathway, and fatty acid degradation are significantly upregulated in the adult (Figure S1F).
Figure 1.

Signaling pathways downregulated in the postnatal heart
(A) Scheme for comparative analyses of RNA-seq and H3K27ac ChIP-seq.
(B) Principal-component analysis for adult (orange), fetal (purple), and in vitro (green) samples.
(C) Venn diagram of RNA-seq pairwise comparisons showing DEGs.
(D) RNA-seq hierarchical clustering of the top 1,000 DEGs shared among all samples. Clusters are indicated on left margin. C, 3-year-old child.
(E) Volcano plot for coding genes.
(F) ChIP-seq hierarchical clustering for 25,149 loci with differential H3K27ac deposition. Clusters are indicated on left margin. E, embryo (CS22).
(G) ChIP-seq tracks for M protein (MYOM2, cluster 2) and p38α (MAPK14, cluster 3) in pooled biological replicates.
(H) Venn diagram for DEGs shared among ChIP-seq, clusters 1 and 3, and RNA-seq.
(I) Gene-network plot of KEGG pathway enrichment analysis of the most downregulated genes in the adult heart, with cluster size scale at the bottom right.
Globally, cell cycle-related genes, such as CDK1 and AURKB, are downregulated in the adult, while structural and metabolic genes, such as MYOM2 and CD36, are upregulated in the adult compared with fetal and in vitro CMs (Figure 1E). Similarly, several MAPK genes, such as MAP2K6 and MAP3K1, or upstream activators of the pathway, such as FGF13 (Lin et al., 2019) and IGF2BP3 (Suvasini et al., 2011), show significant downregulation postnatally. Meanwhile, negative regulators, such as the dual-specificity phosphatases DUSP1 and DUSP6 (Owens and Keyse, 2007), are significantly upregulated in the adult compared with fetal and in vitro CMs (Figure 1E).
To further understand these developmentally determined transcriptional profiles, we looked at the loci with differential expression of histone 3 lysine 27 acetylation (H3K27ac) marks, thereby suggesting epigenetic activation or repression of such genes. We found 3,998 loci with significantly reduced H3K27ac sites in the adult compared with the prenatal samples (clusters 1 + 3; Figures 1F and 1H). GO analysis of these clusters revealed enriched genes related to Wnt, Hippo, and BMP signaling pathways (cluster 1) and heart morphogenesis (cluster 3; Figure S2A). A closer inspection of the chromatin immunoprecipitation sequencing (ChIP-seq) tracks revealed that some MAPK genes, such as MAPK14 encoding p38α, have increased H3K27ac signal early in development, but they are decreased in the postnatal period (Figures 1G and S2B). On the other hand, hiPSC-CMs do not show a decrease in H3K27ac at the MAPK14 locus even after 80 days in culture. In contrast, structural genes, such as MYOM2, turn on only in adulthood (Figure 1G).
After combining both RNA sequencing (RNA-seq) and ChIP-seq datasets, we found a narrow list of 1,452 genes that were shared (Figure 1H). Over-representation analysis of these genes using Kyoto Encyclopedia of Genes and Genomes (KEGG) shows that the MAPK pathway (q = 0.0137), along with the Hippo (q < 0.0001) and Wnt (q = 0.0002) pathways are significantly enriched (Figure 1I). These findings suggest that these pathways are downregulated in the adult. Upon closer inspection, 39% of the genes annotated to the MAPK pathway were also shared with the PI3K-AKT pathway (Figure S2C). The MAPK and PI3K-AKT pathways have been shown to regulate cardiac hypertrophy postnatally, but it remains unknown whether MAPK and PI3K-AKT signaling is more broadly implicated in regulation of CM maturation.
Sarcomeric protein expression switch upon MAPK and PI3K-AKT inhibition
To investigate whether inhibition of the MAPK/PI3K/AKT pathways could promote hiPSC-CM maturation, we generated ventricular CMs from three independent hiPSC lines, using the Wnt modulation protocol (Lian et al., 2012). After enrichment with DL-lactate (Burridge et al., 2014), we determined if MAPK/PI3K/AKT inhibition could enhance MLC-2v+ expression as a marker of maturation. We tested the dose response to SB203580, a p38 and phosphoinositide-dependent protein kinase-1 (PDK1) inhibitor (Kumar et al., 1997; Lali et al., 2000) (referred to hereafter as S), and PD0325901, a MEK1/2 (Allen et al., 2003) (referred to hereafter as P), separately, on MLC-2v+ expression from days 25–30 (Figure S3A). Here, we found that 5 μM S (Figures S3B and S3D) and 10 μM P (Figures S3C and S3E) were optimal for increasing MLC-2v+ expression. We confirmed that these concentrations resulted in inhibition of the signaling pathways (Figures S3F and S3G). We then compared the effects of these small molecules alone (S or P) or in combination (SP) at their optimized concentration (Figures 2A–2D and S3H). Although the expression of cardiac troponin T (cTnT) was similarly high across all three hiPSC-CM preparations, we found that the treatment with SP yielded CMs with even greater cTnT+MLC-2v+ expression than the single treatments (Figure 2C). More important, treatment with SP was found to be optimal for enhancement of the MLC-2v+/MLC-2a+ expression ratio (Figure 2D), a feature of ventricular CM maturation. Independently, we then confirmed that days 25–30 were indeed the ideal time window and duration for this isoform switch (Figures S3I and S3J). Taken together, these data suggest that treatment with SP accelerated the switch in myosin light chain isoform expression to the more mature MLC-2v isoform.
Figure 2.

Inhibition of MAPK/PI3K/AKT improves the expression of adult isoform sarcomeric proteins in day 30 hiPSC-CMs to day 60 levels
(A) Scheme for ventricular CM differentiation and treatment with MAPK/PI3K/AKT inhibitors.
(B) Representative flow cytometry plots of day 30 hiPSC-CMs show cTnT+ (upper panel) and the cTnT+ MLC-2v+ (lower panel) population.
(C) Bar graph shows summary of fluorescence-activated cell sorting (FACS) analysis for cTnT+MLC-2v+ hiPSC-CMs per treatment at day 30.
(D) Graph shows MLC-2v+/MLC-2a+ ratio by FACS on day 30 hiPSC-CMs.
(E) Representative FACS plot for cTnT+MLC-2v+ expression per condition.
(F) Bar graph shows the frequency of cTnT+MLC-2v+ in day 30 hiPSC-CMs treated with SP or DMSO, compared with untreated day 60 CMs as a reference.
(G and H) Western blot for cTnI, ssTnI, and α-tubulin (G) and (H) quantification of stoichiometric relationship in day 30 DMSO- or SP-treated hiPSC-CMs.
Data are presented as mean ± SEM. For (C) and (D), n = 3 (PLZ/19004) or 5 (MYL2) independent experiments per condition using all 3 cell lines; for (F), n = 3 independent experiments per condition using all 3 cell lines; for (G), n = 3 (PLZ/MYL2) independent experiments per condition. ns, p > 0.05; ∗p < 0.05, ∗∗p < 0.01, and ∗∗∗p < 0.001.
To better contextualize these changes in isoform expression after treatment with SP, we carried out a new round of experiments in which we compared the day 30 SP-treated hiPSC-CMs with their untreated day 60 counterparts (Figures 2E, 2F and S3K). Flow cytometry analysis of the cTnT+MLC-2v+ population showed no statistical difference between day 30 SP-treated and day 60 hiPSC-CMs from the same cell preparation (Figure 2F), while both groups were found to have a higher percentage of cTnT+MLC-2v+ hiPSC-CMs compared with day 30 DMSO control. We confirmed these results with immunofluorescence (IF) studies (Figures 3A and S3L–S3O). Indeed, the frequency of the cTnT+MLC-2a+MLC-2v− population significantly decreased in the day 30 SP-treated group to levels similar to day 60 compared with day 30 DMSO controls, whereas the cTnT+MLC-2a−MLC-2v+ population significantly increased to similar levels in both the SP-treated day 30 and day 60 hiPSC-CMs (Figure S3L). No differences were observed in the intermediary cTnT+MLC-2a+MLC-2v+ population among any of the treatment groups (Figure S3L). Taken together, these results indicate that the increase in MLC-2v expression after a 5 day treatment with SP at day 30 is equivalent to the expression levels reached after 60 days in culture.
Figure 3.

Morphological improvements in day 30 hiPSC-CMs upon MAPK/PI3K/AKT inhibition
(A) Representative IF images for α-actinin-2, MLC-2v, MLC-2a, DAPI, and merge for DMSO- and SP-treated day 30 hiPSC-CMs as well as untreated day 60 CMs. Inset indicates representative mean for SL. Scale bar, 20 μm.
(B) Violin plot of SL with mean values represented by black line.
(C–F) Bar graphs show quantification data for cell surface area (C), cell perimeter (D), length-to-width ratio (E), and nucleation levels (F).
(G) Representative 3D volume rendering of T-tubules in day 30 DMSO- and SP-treated hiPSC-CMs.
(H and I) Quantification of T-tubule density (H) and (I) CM volume.
Data are presented as mean ± SEM of 3 independent experiments using all three cell lines (PLZ/19004/MYL2). For (G–I), n = 4–10 cells per experiment, 3 independent experiments in MYL2 line. ∗p < 0.05, ∗∗p < 0.01, ∗∗∗p < 0.001, and ∗∗∗∗p < 0.0001.
Given the observed isoform switch from MLC-2a to MLC-2v, we investigated whether treatment with SP could also have an impact on the molecular switch of TnI isoforms, a different maturation marker. Here, we found that SP-treated hiPSC-CMs had higher expression of the adult TnI isoform and lower expression of the fetal TnI isoform compared with DMSO-treated controls (Figures 2G, 2H, and S3P). Altogether, these results indicate that treatment of hiPSC-CMs with SP from days 25–30 can engage the molecular switch driving adult isoform replacement of sarcomeric proteins.
Structural features of hiPSC-CMs upon MAPK/PI3K/AKT inhibition
To elucidate the effects of MAPK/PI3K/AKT inhibition beyond sarcomeric protein expression, we conducted morphological studies, which revealed that changes in SL were accompanied by hypertrophy. Assessment of SL, across all the cell lines, showed changes from a baseline of 1.64 ± 0.01 μm in day 30 DMSO-treated controls to 2.02 ± 0.01 μm in day 30 SP-treated hiPSC-CMs (Figures 3A, 3B, and S4A). Surprisingly, these enhancements in SL were also higher than those observed on the day 60 hiPSC-CMs (Figure 3B).
We observed a similar pattern in other key structural parameters relevant to CM maturation. Here, we observed an increase in the cell surface area, perimeter, and cell length-to-width ratios in both day 30 SP-treated and day 60 hiPSC-CMs relative to day 30 DMSO-treated controls (Figures 3C–3E and S4B–S4D). As observed with SL, the changes detected in surface area were greater in day 30 SP treatment than day 60 hiPSC-CMs (Figures 3C and S4B).
When we looked at the number of nuclei per CM, another parameter of maturation status, we observed a significant increase in multinucleation proportional to the decrease in mononucleation. Similar to day 60 hiPSC-CMs, the percentage of mononucleated CMs decreased in day 30 SP-treated hiPSC-CMs relative to day 30 DMSO-treated controls by ∼10% (Figures 3F and S4E). In contrast, the percentage of binucleation and trinucleation of day 30 SP-treated hiPSC-CMs increased by ∼9 and ∼1%, respectively, similar to day 60 hiPSC-CMs (Figure 3F). Of note, in all instances, there were no statistically significant differences between day 30 SP-treated and day 60 hiPSC-CMs, but there was a trend toward greater improvement in the day 30 SP-treated group compared with day 60.
Finally, a hallmark of structural changes associated with maturation is the development of transverse tubules (T-tubules), which regulate the excitation-contraction coupling and Ca2+ handling under physiological conditions. To our surprise, we found that even day 30 DMSO-treated controls had well-defined T-tubules. Their density increased significantly upon treatment with SP from 0.15 ± 0.01 to 0.24 ± 0.01 μm2/μm3 (Figures 3G and 3H). This increase in T-tubule density was also accompanied by a doubling of CM volume (Figure 3I). Altogether, these data suggest that despite a similar expression pattern of sarcomeric proteins between day 30 SP-treated and day 60 hiPSC-CMs, there are structural changes that go beyond day 60 during the 5 day treatment period with SP.
Transcriptional profile of hiPSC-CMs upon MAPK/PI3K/AKT inhibition
To more comprehensively understand the effects of MAPK/PI3K/AKT inhibition on the maturation status of hiPSC-CMs, we conducted bulk RNA-seq analysis on day 30 SP-treated hiPSC-CMs and compared these with their day 30 DMSO-treated controls as well as day 90 hiPSC-CMs. We used day 90 as a more stringent reference of maturation considering that some maturation parameters improved beyond day 60 levels after treatment with SP. As shown in Figures 4A and 4B, GSE analysis of KEGG pathways of day 30 DMSO- versus SP-treated hiPSC-CMs revealed significant upregulation of the cholesterol metabolism pathway (normalized enrichment score [NES] = +1.63), with CD36 and APOA1 being highly represented. In contrast, we observed significant downregulation of (1) NF-κB (NES = −1.47) in genes including PTGS2 and VCAM1, (2) PI3K-AKT (NES = −1.44) in genes including THBS1 and EPHA2, and (3) TGF-β (NES = −1.54) in genes including TGFB2 and LEFTY2. These data suggest that the effects observed upon inhibition of the MAPK/PI3K/AKT pathways could be a result of concomitant downregulation of key interacting signaling pathways such as NF-κB and TGF-β.
Figure 4.

Transcriptional signatures of hiPSC-CMs upon MAPK/PI3K/AKT inhibition
(A) GSE analysis with upregulated and downregulated KEGG pathways (arrows).
(B) Gene-network plot for differentially expressed KEGG pathways.
(C) Venn diagram of pairwise comparison DEGs.
(D) Principal-component analysis of adult, 3-year-old child, fetal, and day 30 DMSO- and SP-treated hiPSC-CMs with 95% confidence interval.
(E) Hierarchical clustering of 308 shared DEGs; clusters on left margin.
(F) Cluster 1 GO analysis.
(G) Hierarchical clustering of selected genes annotated to cell division/proliferation biological processes.
(H) Bar plot with log-transformed counts per million values for MKI67, each dot is an independent cell line.
(I) Summary of myosin heavy chain (MHC+) and Ki-67+ FACS data; n = 3 independent experiments per condition for each cell line (PLZ/19004/MYL2).
(J) Representative IF images of cTnT and phospho-histone H3 (pHH3) staining. Scale bar, 500 μm.
(K) Summary dot-plot quantification of cTnT+ pHH3+ nuclei. n = 30 technical replicates, 4 independent experiments per condition from a representative cell line (PLZ).
Data are presented as mean ± SEM; n = 1–3 independent experiments per cell line unless specified. ∗p < 0.05, ∗∗p < 0.01, ∗∗∗p < 0.001, and ∗∗∗∗p < 0.0001.
Pairwise comparisons identified 713 and 2,402 DEGs between day 30 DMSO- versus SP-treated and day 30 DMSO-treated versus day 90 hiPSC-CMs, respectively, with 308 DEGs in common (Figure 4C). Using this defined list of DEGs, we conducted principal-component analysis and found the greatest axis of variation to be that separating fetal CMs from child/adult. Notably, day 30 DMSO-treated controls clustered with fetal samples, while day 30 SP-treated hiPSC-CMs clearly shifted to the right on PC1, the maturation axis, demonstrating a shift away from fetal state in the direction of the adult state (Figure 4D). Unsupervised hierarchical clustering of this core gene list revealed four main clusters of DEGs where the two largest clusters (1 and 3) have a similar expression pattern between day 30 SP-treated and day 90 hiPSC-CMs (Figure 4E). GO analysis of cluster 1 showed significant enrichment of genes related to cell division and ERK1/2 cascade (Figure 4F). Inspection of the genes annotated to the largest and most significant category of biological process revealed significant downregulation of AURKB and MKI67, which are involved in cell proliferation (Figures 4G and 4H).
Proliferation status of hiPSC-CMs upon MAPK/PI3K/AKT inhibition
Given that the cell proliferation status is another key CM maturation marker and we observed transcriptional signatures in this domain, we conducted experiments to determine whether there was any change in proliferation upon MAPK/PI3K/AKT inhibition. We first assessed our enriched population of CMs for Ki-67 expression, a proliferation marker present in all stages of the cell cycle. We observed a significant reduction in Ki-67+ expression from 19.1% ± 1.3% to 7.0% ± 1.2% upon treatment with SP (Figure 4I, right panel; Figures S4G–S4I) across all three cell lines. Here, we also observed no statistically significant difference between our day 30 SP-treated and day 60 untreated reference (Figure 4I, right panel; Figure S4H). These results were further validated with IF studies of phospho-histone H3 (pHH3) expression, an M-phase marker, which revealed a significant decrease in the percentage of cTnT+ pHH3+ nuclei in day 30 SP-treated hiPSC-CMs relative to DMSO controls (Figures 4J and 4K), and this decrease was also found to be greater than day 60 untreated CMs (Figure 4K). These results suggest that there is a decrease in CM proliferation upon inhibition of MAPK/PI3K/AKT signaling, consistent with enhanced maturation of CMs.
Force profile of hiPSC-CMs upon inhibition of MAPK/PI3K/AKT
We next investigated whether there were any changes in contractile force generation, a physiological marker of maturation, upon treatment with SP. Toward this end, we conducted single-cell force measurements using traction force microscopy on micropatterned CMs (Figures 5A, 5B, and S5A) in day 30 DMSO- and SP-treated CMs as well as day 60 untreated reference. Here, we found no significant differences in force generation between DMSO- and SP-treated CMs across two different hiPSC lines (Figures 5C and S5B). Similarly, we found no significant increase in force generation in the day 60 untreated cohort (Figures 5C and S5B). These data suggest that under our minimal culture conditions, there is no increase in force generation after 60 days in culture and that the MAPK/PI3K/AKT pathways do not contribute to force generation despite a robust increase in contractile sarcomeric proteins.
Figure 5.

Traction force profile and metabolic shift upon MAPK/PI3K/AKT inhibition
(A) Bright-field image of micropatterned hiPSC-CM (cell outlined by a white dashed line) and heatmaps of the cell-induced substrate surface tractions.
(B) Total traction force exerted by the representative CM in the direction of its long and short axes over 3 s.
(C) Normalized contraction force in day 30 DMSO- and SP-treated groups compared with day 60 untreated CMs.
(D–F) Mean kinetic profile of OCR and ECAR from day 30 DMSO- and SP-treated and day 60 untreated hiPSC-CMs.
(G–L) Dot-plot quantification of (G) basal, (H) non-mitochondrial, (I) proton leak, (J) ATP-linked, (K) percentage spare capacity OCR, and (L) basal ECAR.
(M and N) Normalized gene expression of (M) HK1 and (N) PKM.
(O) Representative transmission electron micrograph of mitochondria on hiPSC-CMs; scale bar, 0.6 μm.
(P) Quantification of mitochondrial cross-sectional area.
(Q and R) Normalized gene expression of (Q) ESRRG and (R) PPARGC1B.
(S and T) Representative FACS plot for ROS measurement (S) and (T) quantification of mean fluorescence intensity (MFI).
Data are presented as mean ± SEM. For (C), n = 6–14 cells per experiment, 3 independent experiments in PLZ/MYL2; for (D)–(L), n = 8–48 technical replicates per experiment per condition per line, 3 independent experiments in PLZ/19004/MYL2; for (M), (N), (Q), and (R), n = 3 independent experiments per condition in PLZ/19004/MYL2; for (P), n = 20–40 mitochondria per cell, 4 or 5 cells per condition, 1 independent experiment in MYL2; for (T), n = 3 independent experiments in PLZ. ∗p < 0.05, ∗∗p < 0.01, ∗∗∗p < 0.001, and ∗∗∗∗p < 0.0001.
Metabolic profile upon MAPK/PI3K/AKT inhibition
We next wanted to interrogate the metabolic status of hiPSC-CMs in the context of MAPK/PI3K/AKT inhibition. We conducted Seahorse mitochondrial stress test studies to look at oxygen consumption rate (OCR), an indicator of aerobic respiration, with simultaneous measurements of the extracellular acidification rate (ECAR), an indicator of glycolytic flux, in our day 30 DMSO- and SP-treated CMs with their day 60 untreated references. Here, we found that there was a metabolic shift from a high aerobic and glycolytic state in the day 30 DMSO-treated group to a low aerobic and low glycolytic state in both the day 30 SP-treated and day 60 untreated CMs (Figures 5D–5F). This apparent shift to a conservative aerobic state in the day 30 SP-treated and day 60 untreated CMs was observed in both baseline and stress conditions in other OCR measurements (Figures 5G–5J and S5C–S5F). The percentage of spare respiratory capacity, an indicator of energy reserve available in case of a sudden increase in energy demand, was slightly decreased between DMSO- and SP-treated hiPSC-CMs (Figure 5K) and was found to be significantly increased in day 60 untreated CMs (Figure 5K).
Further examination at the glycolytic flux, as measured by basal ECAR levels, revealed a significant reduction in SP-treated hiPSC-CMs compared with DMSO (Figures 5L and S5G). This reduction in the reliance on glycolysis was further validated by qRT-PCR, on which we observed significant downregulation of HK1 and PKM, encoding the glycolytic enzymes hexokinase-1 and pyruvate kinase M1/2, respectively, upon treatment with SP (Figures 5M and 5N).
Given these metabolic changes, we conducted transmission electron microscopy studies to examine ultrastructural features of the mitochondria upon treatment with SP. These studies showed that day 30 SP-treated hiPSC-CMs tended to have larger mitochondria compared with DMSO controls (Figures 5O and 5P). Along with the increase in mitochondrial size, we observed significant upregulation of the orphan estrogen-related receptor gamma (ESSRG) and PPAR gamma coactivator 1-beta (PPARGC1B) (Figures 5Q and 5R). ESSRG and PPARGC1B are known coactivators of PPAR-gamma coactivator-1 (PGC-1), which together are involved in mitochondrial biogenesis, production of reactive oxygen species (ROS), and fatty acid oxidation (Giguère, 2008). We were interested in assessing ROS production because it is a byproduct of many metabolic reactions. Indeed, we find that there is a significant increase in ROS production upon SP treatment relative to DMSO controls (Figures 5S and 5T). These results indicate that inhibition of MAPK/PI3K/AKT pathways results in a shift in metabolic profile that is consistent with day 60 levels and a pronounced downregulation of glycolysis, a key metabolic maturation marker, as well as an increase in mitochondria size that is accompanied by upregulation in mitochondrial biogenesis genes and ROS production.
MAPK/PI3K/AKT inhibition enhances calcium handling of hiPSC-CMs
To probe a key physiological readout of CM maturation, we conducted Ca2+ handling studies. For this purpose, we assessed the Ca2+ handling capacity of hiPSC-CMs at day 40, 10 days after our standard treatment protocol to ensure that the effects of MAPK/PI3K/AKT inhibition are lasting, and compared it with day 60 untreated CMs (Figure 6A). Here, we found significant improvements in the Ca2+ transient upstroke and downstroke velocities in our day 40 SP-treated hiPSC-CMs compared with day 40 DMSO-treated controls and day 60 untreated CMs, suggesting a faster uptake of Ca2+ upon treatment with SP (Figures 6B–6D, S5H, and S5I). These changes also resulted in a shorter time to peak while also having a larger Ca2+ transient amplitude (Figures 6E, 6F, S5J, and S5K).
Figure 6.

Calcium handling profile upon MAPK/PI3K/AKT inhibition
(A) Scheme for maintenance and treatment of hiPSC-CMs with SP; arrows indicate when Ca2+ handling was measured.
(B) Representative averaged Ca2+ transient of day 40 DMSO control and SP treatment relative to day 60 untreated CMs with 95% confidence interval, paced at 1 Hz.
(C–F) Violin plots show Ca2+ transient upstroke velocity (C), Ca2+ transient downstroke velocity (D), mean time to peak (E), and Ca2+ transient mean maximum amplitude (F). n = 4 technical replicates per condition, 3 independent experiments in PLZ/19004/MYL2. Data presented as mean (solid line) and quartiles (dashed line).
(G) Rendering of KEGG cardiac muscle contraction pathway (hsa04260) with DEGs color-coded for upregulation (pink), downregulated (blue), or no significant change (black).
(H) Whisker plots of transcript-level expression of Ca2+-handling genes involved in cardiac muscle contraction. Error bars show the normalized bootstraps across all samples (n = 1,000).
∗p < 0.05, ∗∗p < 0.01, ∗∗∗p < 0.001, and ∗∗∗∗p < 0.0001.
To broaden our scope, we conducted KEGG pathway analysis, which showed upregulation of many Ca2+-related genes involved in cardiac muscle contraction (hsa04260; Figure 6G). We further examined differential expression of transcripts for Ca2+-related genes after controlling for cell-line effects as a covariate. Here, we found significant upregulation of the ryanodine receptor 2 (RYR2) and the sarcoendoplasmic reticulum Ca2+-ATPase (ATP2A2) (Figures 6G, 6H, and S5L; Table S2), which are key genes regulating the influx and outflux of Ca2+ from the sarcoplasmic reticulum. We also observed a trend toward improvement in CACNA1C, which encodes the α1 subunit of the voltage-gated L-type Ca2+ channel Cav1.2 (Table S2). These findings indicate that there is an improved Ca2+ handling profile in day 40 SP-treated hiPSC-CMs compared with day 40 DMSO-treated controls, with many features being better than day 60 as well, which is corroborated by expression of key Ca2+ handling-related genes.
Improved electrophysiological profile of hiPSC-CMs upon MAPK/PI3K/AKT inhibition
Considering the enhanced T-tubule density along with Ca2+ handling upon SP treatment, we then tested whether there were any changes in the electrophysiological profiles of SP-treated hiPSC-CMs. We conducted single-cell electrophysiology studies on DMSO- and SP-treated hiPSC-CMs 1–5 days after our standard 30-day protocol. Here, we found that the action potential (AP) duration at 90% of repolarization (APD90) was prolonged from 176 ± 7 to 286 ± 24 ms upon SP treatment (Figures 7A and 7B). Similarly, the AP amplitude was improved from 105 ± 2 to 113 ± 2 mV, along with a more hyperpolarized resting membrane potential, a key CM maturation marker, from −60 ± 2 to −75 ± 2 mV after SP treatment (Figures 7C and 7D). We did not observe changes in the maximum upstroke velocity (dV/dtmax) of the AP phase 0 (Figure S5M) or in the biophysical properties of the sodium current’s (INa) steady-state activation and inactivation (Figure S5N). However, we did observe a significant improvement in INa as shown by the current-voltage curves (Figure 7E). The peak INa at −20 mV was increased from −42.7 ± 2.9 pA/pF in the DMSO control group to −77.4 ± 3.3 pA/pF in the SP-treated cohort (Figure 7E). Given these improvements in INa, we next assessed the expression levels of the adult isoform of α-subunit 5 of the sodium voltage-gated ion channel (SCN5A) and the gene expression levels in our cultures using qRT-PCR. These studies showed that there was a significant upregulation not only of the adult isoform (q = 0.0008) but also of the SCN5A gene as a whole (Figures S5O and S5P). In addition, we found a significant downregulation of the pacemaker potassium/sodium hyperpolarization-activated cyclic nucleotide-gated channel 4 (HCN4) in SP-treated hiPSC-CMs relative to DMSO control (Figure S5Q).
Figure 7.

Electrophysiological properties of hiPSC-CMs upon MAPK/PI3K/AKT inhibition
(A) Representative AP trace of DMSO- and SP-treated hiPSC-CMs on day 31.
(B–D) Dot-plot quantification of (B) APD90, (C) AP amplitude, and (D) resting membrane potential.
(E) Current-voltage plot of INa.
(F) Representative propagation map.
(G) Dot-plot quantification of conduction velocity in DMSO- and SP-treated hiPSC-CMs on day 31 compared with day 60 untreated CMs.
(H) Averaged field potential trace of day 31 DMSO- or SP-treated hiPSC-CMs along with day 60 untreated CMs. n = 300 beats per condition.
(I) Dot-plot quantification of FPD.
(J) Graphical summary of changes observed upon MAPK/PI3K/AKT inhibition.
Data are presented as mean ± SEM. For (B)–(E), n = 23–24 cells from 2 independent experiments in PLZ. For (F)–(I), n = 40-59 electrodes per experiment, 2 (DMSO/SP) or 4 (day 60) independent experiments (PLZ/MYL2). ns, p > 0.05; ∗∗p < 0.01, ∗∗∗p < 0.001, and ∗∗∗∗p < 0.0001.
Having observed significant improvements in electrophysiological profiles at the single-cell level, we conducted two-dimensional studies with microelectrode arrays to probe population-level dynamics. In particular, we assessed the conduction velocity by which APs are propagated in monolayer hiPSC-CMs along with the field potential duration (FPD). These studies revealed a significant increase in the conduction velocity of day 30 SP-treated hiPSC-CMs compared with DMSO controls, and these levels were similar to those of untreated day 60 CMs (Figures 7F and 7G). A closer look at the FPD showed a significant increase upon SP treatment (Figures 7H and 7I), consistent with our patch-clamp data, and showed no differences between day 30 DMSO-treated and day 60 reference, consistent with previous observations that suggest no apparent increase in electrophysiological properties even after prolonged culture (Ma et al., 2011). Altogether, our results show enhanced maturation of hiPSC-CMs upon 5 days of MAPK/PI3K/AKT signaling inhibition (Figure 7J).
Discussion
The cross-talk between MAPK and PI3K/AKT pathways is well documented (Hong et al., 2008). However, it is not clear how the interplay of these pathways contributes to in vitro CM maturation. In this study, we leveraged publicly available datasets of hiPSC-CMs and human native heart tissues across the lifespan to investigate signaling pathways that regulate CM maturation. Through this targeted, unbiased approach, we found that the MAPK and PI3K/AKT pathways are significantly downregulated in the postnatal heart. Inhibition of the MAPK/PI3K/AKT via small molecules for only 5 days in ventricular hiPSC-CMs resulted in the enhancement of many cardiac maturation markers, which were similar or superior to their day 60 untreated references on multiple domains: sarcomeric protein isoform switch, hypertrophy, T-tubule density, multinucleation, reduced proliferation, transcriptomic landscape, metabolism, Ca2+ handling, and electrophysiology.
Previous observations in fetal hearts show that the levels or activity of MAPK signaling are reduced during development. Human fetal hearts from the 12th to 40th week of gestational age show peak expression of ERK1 and ERK2 at around the 14th week. However, only ERK1 shows a decline in expression which remains low into adulthood (Fiorina et al., 2004). In contrast, p38 activity has been observed to be biphasic and inversely proportional to ventricular hypertrophy during development (Engel et al., 2005). To our knowledge, there have been no studies that look at PI3K/AKT expression in human fetal hearts across development.
Upon SP treatment, we observed significant downregulation of MAPK and PI3K/AKT signaling (Figures S3F and S3G). Our results show <5% p-ERK1/2 levels, which is in agreement with inhibition of ERK pathway by PD0325901. As SB203580 is a p38 and PDK1 inhibitor, as discussed above, we looked at both pathways. Because only trace levels of p-p38 were observed in our DMSO condition (data not shown), we could not detect significant p-p38 inhibition by SB203580. On the other hand, we did detect significant inhibition of p-AKT levels using SB203580, consistent with inhibition of PI3K/AKT and in agreement with previous studies using this inhibitor. Given the results of our study, it would be interesting to assess changes in chromatin accessibility, which could reveal more mechanistic insights to explain the role of these pathways on CM maturation. Additionally, it will be important to assess the application of our protocol to a larger number of unaffected and disease-specific hiPSC lines.
One aspect to consider when manipulating the MAPK/PI3K/AKT pathways relates to the potential effects on cell survival. In our study, we did not find evidence of increased apoptosis (Figures S6A and S6B). In fact, we observed no changes or significant downregulation of pro-apoptotic genes such as the BCL2 homologous antagonist (BAK1; q = 0.3106), BCL2-associated X protein (BAX; q = 0.0727), and death receptor 5 (TNFRSF10B; q = 0.0006) (Figure S6C). Thus, our data suggest that at the concentration used here and only a 5 day exposure period, inhibition of MAPK/PI3K/AKT signaling does not result in increased apoptosis.
We found no changes in force of contraction upon SP treatment. Under our minimal basal media conditions, in the absence of any external cues known to promote maturation, we did not observe changes in force of contraction even after 60 days in culture (Figure 5C). These results are in agreement with previous observations that even after 90 days in culture there is no apparent increase in normalized force relative to day 30, as would be expected with a more mature phenotype (Wheelwright et al., 2018). These results indicate that the MAPK/PI3K/AKT pathways are not directly contributing to the enhancement of force generation. However, it would be interesting to see if these pathways have a synergistic effect with other known cues that promote maturation, such as electrical pacing, three-dimensional (3D) models, or fatty acid supplementation.
Metabolically, the profile of day 30 SP-treated hiPSC-CMs resembled that of their day 60 untreated reference (Figure 5F). In particular, there was a significant downregulation of glycolysis (Figures 5L–5N and S5G), which is a key transition in the maturation process as CMs begin to rely more on other energy sources, such as fatty acid oxidation and OXPHOS. We also found evidence that the cells were more metabolically active (Figures 5S and 5T), along with an increase in mitochondrial size and key genes involved in mitochondrial biogenesis (Figures 5O–5R).
Multinucleation was another key marker of maturation that improved in day 30 hiPSC-CMs upon treatment with SP. Previous studies have shown that decreased levels of ECT2 (González-Rosa et al., 2018) and GAS2L3 (Stopp et al., 2017) could result in an increase in multinucleation. Both proteins act during cytokinesis and, in their absence, the cells end the cycle with two nuclei instead of one. In our study, we observed a trend toward downregulation of both of these genes (Figure S4F). This could explain the increase in multinucleation observed (Figure 3F), which is closer to the known adult human multinucleation levels (Bergmann et al., 2015) (binucleation, 26%; trinucleation, 1%).
We found that SP treatment significantly accelerated cardiac hypertrophy, a key marker of maturation. Selective ablation of Erk1/2 signaling, a target of Mek1/2, via overexpression of DUSP6/8 in vivo results in changes of length-to-width ratio (Liu et al., 2016) and hypertrophy (Purcell et al., 2007). Studies in Akt3 transgenic mice, on the other hand, have shown that overexpression of PI3K-AKT signaling leads to maladaptive hypertrophy (Taniyama et al., 2005). Scanning electron micrograph studies of non-failing adult ventricular CMs show a cell surface area >4,000 cm2 (Ohler et al., 2009). In this study, we found an average increase in cell surface area to 4,210 ± 180 cm2 and length-to-width ratio to 2.18 ± 0.06, which would suggest a more mature phenotype. Similarly, it has been reported that the mean CM volume in humans aged 1–10 years is ∼20,000 μm3 (Mollova et al., 2013). In our study, we found a mean increase in CM volume to 20,000 ± 2,000 μm3, further suggesting a more mature phenotype.
These hypertrophic changes were followed by changes in T-tubule density, Ca2+ handling, and electrophysiology. Previous studies in human fetal hearts have shown that T-tubule development starts after 32 weeks of gestation (Kim et al., 1992). In our hands, we observed T-tubule density expression under baseline conditions. After treatment with SP, there was a significant enhancement of T-tubule density. This increase in T-tubule density also facilitated enhanced Ca2+ handling and was accompanied by several key electrophysiological changes associated with maturation, namely, a more hyperpolarized resting membrane potential, closer to the adult human ventricular value of −80 mV (Horváth et al., 2018), and increases in sodium current and conduction velocity.
Finally, a recent large screening found that RNF20, which encodes a subunit of H2B ubiquitin ligase, is an epigenetic regulator of CM maturation (VanDusen et al., 2021). In our study, we found a significant increase in RNF20 (q = 0.0005) after treatment with SP. It is possible that RNF20 could be contributing to the multi-tier improvements in CM maturation.
The implementation of small molecules to induce cardiac maturation of hiPSC-CMs is conducive to the development of robust protocols, which are greatly warranted to model the pathophysiology and uncover new treatment options for adult heart diseases. These results can pave the way to future combinatorial studies with known and novel effectors of cardiac maturation, which will facilitate reaching CMs with adult-like features in the dish.
Experimental procedures
Bulk RNA-seq and chromatin immunoprecipitation sequencing analysis
Original research articles published between 2012 and 2020 reporting the generation of hiPSC-CMs using the Wnt modulation method (Lian et al., 2012) were reviewed from PubMed. See supplemental experimental procedures for more details.
Cardiac differentiation by the Wnt modulation method
See supplemental experimental procedures for more details.
Inhibition of MAPK/PI3K/AKT pathways
On day 25 of the differentiation protocol, hiPSC-CMs were incubated with 0–100 μM mirdametinib (PD0325901; Cayman Chemical), a selective and non-ATP-competitive dual MEK1 and MEK2 inhibitor, and 0–10 μM SB203580 (Cayman Chemical), a p38 and PDK1 inhibitor, in RPMI 1640 supplemented with B27 (plus insulin). The media with cocktail of inhibitors (SP) or DMSO vehicle control (0.01%) was changed on day 28 of the differentiation protocol. On day 30, the hiPSC-CMs were harvested for further analyses. Optimized concentrations of 10 μM PD0325901 and 5 μM SB203580 were used for the rest of the experiments.
Flow cytometry
See supplemental experimental procedures for more details.
Western blotting
See supplemental experimental procedures for more details.
qRT-PCR
See supplemental experimental procedures for more details.
Immunofluorescence
See supplemental experimental procedures for more details.
Apoptosis assay
Apoptosis was assessed using the Click-iT Plus TUNEL assay (#C10619; Invitrogen) following the manufacturer’s recommendation.
Sarcomeric and morphological measurements
See supplemental experimental procedures for more details.
Transverse tubule staining and analysis
See supplemental experimental procedures for more details.
Traction force microscopy
See supplemental experimental procedures for more details.
Metabolic flux analysis
See supplemental experimental procedures for more details.
Transmission electron microscopy
See supplemental experimental procedures for more details.
Reactive oxygen species assay
ROS were measured using the cellular ROS assay kit (#ab113851; Abcam) following the manufacturer’s recommendation on three independent experiments using the PLZ cell line in DMSO- and SP-treated samples.
Calcium transient assay
See supplemental experimental procedures for more details.
Kallisto-Sleuth analysis of transcripts
See supplemental experimental procedures for more details.
Electrophysiology
See supplemental experimental procedures for more details.
Statistical analyses
Data are presented as arithmetic mean ± SEM, unless otherwise specified. Power analysis with G∗Power (Faul et al., 2007) version 3.1 software was used to determine optimal sample size for morphological assessment to ensure 80% statistical power to detect an effect size of 0.7 (Cohen’s d) with a type I error rate of α = 0.05 (two-tailed). At least 30 independent experiments were carried out using three independent cell lines. For calcium handling experiments, 25 regions of interest (ROIs) from 4 technical replicates were used for analysis. GraphPad Prism version 9 (GraphPad Software) was used to perform one-way and two-way ANOVA (paired and unpaired, two-tailed, ordinary or mixed-effects) with post hoc correction for multiple comparisons using the Bonferroni-Holm (Holm, 1979) procedure to control for family-wise error rate at α = 0.05. Statistical significance was defined at p < 0.05 or q < 0.05.
Author contributions
B.I.G. designed the study, carried out experiments, analyzed data, and wrote the manuscript. S.G., N.S., P.A., M.L., D.Y., J.B., T.M.R., A.M., J.E.A., H.A.N.S., N.A.G., and N.R.D. performed research. S.C.D., P.W.A., J.H.v.B., B.O., and M.K. contributed to interpretation of data and writing of the manuscript. R.R.C.P. contributed to the experimental design, data interpretation, and writing of the manuscript.
Acknowledgments
This project was supported by National Institutes of Health (NIH) grants R01 AR071439 and AR078571, (R.R.C.P.), R01 HL104025 and HL106592 (S.C.D.), and R01 HL155993 (J.H.v.B.); National Heart, Lung, and Blood Institute (NHLBI) grants R01 HL137204 (B.O.), R01 AR055685 (M.K.), and T32 HL144472-01A1 (J.B.); the National Science Foundation (NSF) Graduate Research Fellowship Program (GRFP) (S.G.) and grant CMMI-1553255 (P.W.A.); and predoctoral fellowship from the American Heart Association (T.R.). B.I.G. was supported by NHLBI grant F30 HL151138 and National Institute of General Medical Sciences (NIGMS) grant T32 GM008244. This project also received seed funds from the University of Minnesota Lillehei Heart Institute (R.R.C.P.) and the Institute for Engineering in Medicine (IEM) Group Grant (B.O.). We give special thanks to Cynthia Faraday for her support with graphic design. This work was also supported by the resources and staff at the University of Minnesota University Imaging Centers (UIC) (grant SCR_020997). We thank Mary Brown for assistance with T-tubule filament tracing and Gail Celio for support with transmission electron microscopy.
Conflicts of interest
The authors declare no competing interests.
Published: August 4, 2022
Footnotes
Supplemental information can be found online at https://doi.org/10.1016/j.stemcr.2022.07.003.
Supplemental information
Data and code availability
The data supporting the conclusions of this study are found within the article and supplemental figures and are available upon request from the corresponding author. RNA-seq data have been deposited at the GEO database (GEO: GSE187308). This paper does not report original code.
References
- Allen L.F., Sebolt-Leopold J., Meyer M.B. CI-1040 (PD184352), a targeted signal transduction inhibitor of MEK (MAPKK) Semin. Oncol. 2003;30:105–116. doi: 10.1053/j.seminoncol.2003.08.012. [DOI] [PubMed] [Google Scholar]
- Bedada F.B., Chan S.S.K., Metzger S.K., Zhang L., Zhang J., Garry D.J., Kamp T.J., Kyba M., Metzger J.M. Acquisition of a quantitative, stoichiometrically conserved ratiometric marker of maturation status in stem cell-derived cardiac myocytes. Stem Cell Rep. 2014;3:594–605. doi: 10.1016/j.stemcr.2014.07.012. [DOI] [PMC free article] [PubMed] [Google Scholar]
- Bergmann O., Zdunek S., Felker A., Salehpour M., Alkass K., Bernard S., Sjostrom S.L., Szewczykowska M., Jackowska T., Dos Remedios C., et al. Dynamics of cell generation and turnover in the human heart. Cell. 2015;161:1566–1575. doi: 10.1016/j.cell.2015.05.026. [DOI] [PubMed] [Google Scholar]
- Burridge P.W., Matsa E., Shukla P., Lin Z.C., Churko J.M., Ebert A.D., Lan F., Diecke S., Huber B., Mordwinkin N.M., et al. Chemically defined generation of human cardiomyocytes. Nat. Methods. 2014;11:855–860. doi: 10.1038/nmeth.2999. [DOI] [PMC free article] [PubMed] [Google Scholar]
- Chan Y.C., Ting S., Lee Y.K., Ng K.M., Zhang J., Chen Z., Siu C.W., Oh S.K.W., Tse H.F. Electrical stimulation promotes maturation of cardiomyocytes derived from human embryonic stem cells. J. Cardiovasc. Transl. Res. 2013;6:989–999. doi: 10.1007/s12265-013-9510-z. [DOI] [PubMed] [Google Scholar]
- Engel F.B., Schebesta M., Duong M.T., Lu G., Ren S., Madwed J.B., Jiang H., Wang Y., Keating M.T. p38 MAP kinase inhibition enables proliferation of adult mammalian cardiomyocytes. Genes Dev. 2005;19:1175–1187. doi: 10.1101/gad.1306705. [DOI] [PMC free article] [PubMed] [Google Scholar]
- Faul F., Erdfelder E., Lang A.G., Buchner A. G∗Power 3: a flexible statistical power analysis program for the social, behavioral, and biomedical sciences. Behav. Res. Methods. 2007;39:175–191. doi: 10.3758/bf03193146. [DOI] [PubMed] [Google Scholar]
- Fiorina P., Corradi D., Pinelli S., Maestri R., Lagrasta C., Buscaglia M., Davalli A., Folli F., Astorri E. Apoptotic/mytogenic pathways during human heart development. Int. J. Cardiol. 2004;96:409–417. doi: 10.1016/j.ijcard.2003.08.010. [DOI] [PubMed] [Google Scholar]
- Franco D., Lamers W.H., Moorman A.F. Patterns of expression in the developing myocardium: towards a morphologically integrated transcriptional model. Cardiovasc. Res. 1998;38:25–53. doi: 10.1016/s0008-6363(97)00321-0. [DOI] [PubMed] [Google Scholar]
- Giguère V. Transcriptional control of energy homeostasis by the estrogen-related receptors. Endocr. Rev. 2008;29:677–696. doi: 10.1210/er.2008-0017. [DOI] [PubMed] [Google Scholar]
- González-Rosa J.M., Sharpe M., Field D., Soonpaa M.H., Field L.J., Burns C.E., Burns C.G. Myocardial polyploidization creates a barrier to heart regeneration in zebrafish. Dev. Cell. 2018;44:433–446.e7. doi: 10.1016/j.devcel.2018.01.021. [DOI] [PMC free article] [PubMed] [Google Scholar]
- Holm S. A simple sequentially rejective multiple test procedure. Scand. J. Stat. 1979;6:65–70. [Google Scholar]
- Hong C.C., Kume T., Peterson R.T. Role of crosstalk between phosphatidylinositol 3-kinase and extracellular signal-regulated kinase/mitogen-activated protein kinase pathways in artery-vein specification. Circ. Res. 2008;103:573–579. doi: 10.1161/CIRCRESAHA.108.180745. [DOI] [PMC free article] [PubMed] [Google Scholar]
- Horváth A., Lemoine M.D., Löser A., Mannhardt I., Flenner F., Uzun A.U., Neuber C., Breckwoldt K., Hansen A., Girdauskas E., et al. Low resting membrane potential and low inward rectifier potassium currents are not inherent features of hiPSC-derived cardiomyocytes. Stem Cell Rep. 2018;10:822–833. doi: 10.1016/j.stemcr.2018.01.012. [DOI] [PMC free article] [PubMed] [Google Scholar]
- Høydal M.A., Kirkeby-Garstad I., Karevold A., Wiseth R., Haaverstad R., Wahba A., Stølen T.L., Contu R., Condorelli G., Ellingsen Ø., et al. Human cardiomyocyte calcium handling and transverse tubules in mid-stage of post-myocardial-infarction heart failure. ESC Heart Fail. 2018;5:332–342. doi: 10.1002/ehf2.12271. [DOI] [PMC free article] [PubMed] [Google Scholar]
- Iorga B., Schwanke K., Weber N., Wendland M., Greten S., Piep B., Dos Remedios C.G., Martin U., Zweigerdt R., Kraft T., Brenner B. Differences in contractile function of myofibrils within human embryonic stem cell-derived cardiomyocytes vs. Adult ventricular myofibrils are related to distinct sarcomeric protein isoforms. Front. Physiol. 2017;8:1111. doi: 10.3389/fphys.2017.01111. [DOI] [PMC free article] [PubMed] [Google Scholar]
- Kim H.D., Kim D.J., Lee I.J., Rah B.J., Sawa Y., Schaper J. Human fetal heart development after mid-term: morphometry and ultrastructural study. J. Mol. Cell. Cardiol. 1992;24:949–965. doi: 10.1016/0022-2828(92)91862-y. [DOI] [PubMed] [Google Scholar]
- Kumar S., McDonnell P.C., Gum R.J., Hand A.T., Lee J.C., Young P.R. Novel homologues of CSBP/p38 MAP kinase: activation, substrate specificity and sensitivity to inhibition by pyridinyl imidazoles. Biochem. Biophys. Res. Commun. 1997;235:533–538. doi: 10.1006/bbrc.1997.6849. [DOI] [PubMed] [Google Scholar]
- Lali F.V., Hunt A.E., Turner S.J., Foxwell B.M. The pyridinyl imidazole inhibitor SB203580 blocks phosphoinositide-dependent protein kinase activity, protein kinase B phosphorylation, and retinoblastoma hyperphosphorylation in interleukin-2-stimulated T cells independently of p38 mitogen-activated protein kinase. J. Biol. Chem. 2000;275:7395–7402. doi: 10.1074/jbc.275.10.7395. [DOI] [PubMed] [Google Scholar]
- Lian X., Hsiao C., Wilson G., Zhu K., Hazeltine L.B., Azarin S.M., Raval K.K., Zhang J., Kamp T.J., Palecek S.P. Robust cardiomyocyte differentiation from human pluripotent stem cells via temporal modulation of canonical Wnt signaling. Proc. Natl. Acad. Sci. USA. 2012;109:E1848–E1857. doi: 10.1073/pnas.1200250109. [DOI] [PMC free article] [PubMed] [Google Scholar]
- Lin H., Lu P., Zhou M., Wu F., Weng L., Meng K., Yang D., Li S., Jiang C., Tian H. Purification of recombinant human fibroblast growth factor 13 in E. coli and its molecular mechanism of mitogenesis. Appl. Microbiol. Biotechnol. 2019;103:7017–7027. doi: 10.1007/s00253-019-09973-y. [DOI] [PubMed] [Google Scholar]
- Liu R., van Berlo J.H., York A.J., Vagnozzi R.J., Maillet M., Molkentin J.D. DUSP8 regulates cardiac ventricular remodeling by altering ERK1/2 signaling. Circ. Res. 2016;119:249–260. doi: 10.1161/CIRCRESAHA.115.308238. [DOI] [PMC free article] [PubMed] [Google Scholar]
- Lundy S.D., Zhu W.Z., Regnier M., Laflamme M.A. Structural and functional maturation of cardiomyocytes derived from human pluripotent stem cells. Stem Cells Dev. 2013;22:1991–2002. doi: 10.1089/scd.2012.0490. [DOI] [PMC free article] [PubMed] [Google Scholar]
- Ma J., Guo L., Fiene S.J., Anson B.D., Thomson J.A., Kamp T.J., Kolaja K.L., Swanson B.J., January C.T. High purity human-induced pluripotent stem cell-derived cardiomyocytes: electrophysiological properties of action potentials and ionic currents. Am. J. Physiol. Heart Circ. Physiol. 2011;301:H2006–H2017. doi: 10.1152/ajpheart.00694.2011. [DOI] [PMC free article] [PubMed] [Google Scholar]
- Mollova M., Bersell K., Walsh S., Savla J., Das L.T., Park S.Y., Silberstein L.E., Dos Remedios C.G., Graham D., Colan S., Kühn B. Cardiomyocyte proliferation contributes to heart growth in young humans. Proc. Natl. Acad. Sci. USA. 2013;110:1446–1451. doi: 10.1073/pnas.1214608110. [DOI] [PMC free article] [PubMed] [Google Scholar]
- Ohler A., Weisser-Thomas J., Piacentino V., Houser S.R., Tomaselli G.F., O'Rourke B. Two-photon laser scanning microscopy of the transverse-axial tubule system in ventricular cardiomyocytes from failing and non-failing human hearts. Cardiol. Res. Pract. 2009;2009:802373. doi: 10.4061/2009/802373. [DOI] [PMC free article] [PubMed] [Google Scholar]
- Owens D.M., Keyse S.M. Differential regulation of MAP kinase signalling by dual-specificity protein phosphatases. Oncogene. 2007;26:3203–3213. doi: 10.1038/sj.onc.1210412. [DOI] [PubMed] [Google Scholar]
- Purcell N.H., Wilkins B.J., York A., Saba-El-Leil M.K., Meloche S., Robbins J., Molkentin J.D. Genetic inhibition of cardiac ERK1/2 promotes stress-induced apoptosis and heart failure but has no effect on hypertrophy in vivo. Proc. Natl. Acad. Sci. USA. 2007;104:14074–14079. doi: 10.1073/pnas.0610906104. [DOI] [PMC free article] [PubMed] [Google Scholar]
- Ronaldson-Bouchard K., Ma S.P., Yeager K., Chen T., Song L., Sirabella D., Morikawa K., Teles D., Yazawa M., Vunjak-Novakovic G. Advanced maturation of human cardiac tissue grown from pluripotent stem cells. Nature. 2018;556:239–243. doi: 10.1038/s41586-018-0016-3. [DOI] [PMC free article] [PubMed] [Google Scholar]
- Roth G.A., Mensah G.A., Johnson C.O., Addolorato G., Ammirati E., Baddour L.M., Barengo N.C., Beaton A.Z., Benjamin E.J., Benziger C.P., et al. Global burden of cardiovascular diseases and risk factors, 1990-2019: update from the GBD 2019 study. J. Am. Coll. Cardiol. 2020;76:2982–3021. doi: 10.1016/j.jacc.2020.11.010. [DOI] [PMC free article] [PubMed] [Google Scholar]
- Sonnenblick E.H., Ross J., Covell J.W., Spotnitz H.M., Spiro D. The ultrastructure of the heart in systole and diastole. Changes in sarcomere length. Circ. Res. 1967;21:423–431. doi: 10.1161/01.res.21.4.423. [DOI] [PubMed] [Google Scholar]
- Stanley W.C., Recchia F.A., Lopaschuk G.D. Myocardial substrate metabolism in the normal and failing heart. Physiol. Rev. 2005;85:1093–1129. doi: 10.1152/physrev.00006.2004. [DOI] [PubMed] [Google Scholar]
- Stopp S., Gründl M., Fackler M., Malkmus J., Leone M., Naumann R., Frantz S., Wolf E., von Eyss B., Engel F.B., Gaubatz S. Deletion of Gas2l3 in mice leads to specific defects in cardiomyocyte cytokinesis during development. Proc. Natl. Acad. Sci. USA. 2017;114:8029–8034. doi: 10.1073/pnas.1703406114. [DOI] [PMC free article] [PubMed] [Google Scholar]
- Suvasini R., Shruti B., Thota B., Shinde S.V., Friedmann-Morvinski D., Nawaz Z., Prasanna K.V., Thennarasu K., Hegde A.S., Arivazhagan A., et al. Insulin growth factor-2 binding protein 3 (IGF2BP3) is a glioblastoma-specific marker that activates phosphatidylinositol 3-kinase/mitogen-activated protein kinase (PI3K/MAPK) pathways by modulating IGF-2. J. Biol. Chem. 2011;286:25882–25890. doi: 10.1074/jbc.M110.178012. [DOI] [PMC free article] [PubMed] [Google Scholar]
- Taniyama Y., Ito M., Sato K., Kuester C., Veit K., Tremp G., Liao R., Colucci W.S., Ivashchenko Y., Walsh K., Shiojima I. Akt3 overexpression in the heart results in progression from adaptive to maladaptive hypertrophy. J. Mol. Cell. Cardiol. 2005;38:375–385. doi: 10.1016/j.yjmcc.2004.12.002. [DOI] [PubMed] [Google Scholar]
- Uosaki H., Cahan P., Lee D.I., Wang S., Miyamoto M., Fernandez L., Kass D.A., Kwon C. Transcriptional landscape of cardiomyocyte maturation. Cell Rep. 2015;13:1705–1716. doi: 10.1016/j.celrep.2015.10.032. [DOI] [PMC free article] [PubMed] [Google Scholar]
- VanDusen N.J., Lee J.Y., Gu W., Butler C.E., Sethi I., Zheng Y., King J.S., Zhou P., Suo S., Guo Y., et al. Massively parallel in vivo CRISPR screening identifies RNF20/40 as epigenetic regulators of cardiomyocyte maturation. Nat. Commun. 2021;12:4442. doi: 10.1038/s41467-021-24743-z. [DOI] [PMC free article] [PubMed] [Google Scholar]
- Wheelwright M., Win Z., Mikkila J.L., Amen K.Y., Alford P.W., Metzger J.M. Investigation of human iPSC-derived cardiac myocyte functional maturation by single cell traction force microscopy. PLoS One. 2018;13:e0194909. doi: 10.1371/journal.pone.0194909. [DOI] [PMC free article] [PubMed] [Google Scholar]
- Yoshida S., Miyagawa S., Fukushima S., Kawamura T., Kashiyama N., Ohashi F., Toyofuku T., Toda K., Sawa Y. Maturation of human induced pluripotent stem cell-derived cardiomyocytes by soluble factors from human mesenchymal stem cells. Mol. Ther. 2018;26:2681–2695. doi: 10.1016/j.ymthe.2018.08.012. [DOI] [PMC free article] [PubMed] [Google Scholar]
Associated Data
This section collects any data citations, data availability statements, or supplementary materials included in this article.
Supplementary Materials
Data Availability Statement
The data supporting the conclusions of this study are found within the article and supplemental figures and are available upon request from the corresponding author. RNA-seq data have been deposited at the GEO database (GEO: GSE187308). This paper does not report original code.