

Abstract
Maternal immune activation (MIA) during gestation has been implicated in the development of neurological disorders such as schizophrenia and autism. Epidemiological studies have suggested that the effect of MIA may depend on the gestational timing of the immune challenge and the region of the central nervous system (CNS) in question. This study investigated the effects of MIA with 100 μg/kg lipopolysaccharide at either Embryonic days (E)12 or E16 on the oligodendrocytes, microglia and astrocytes of the offspring spinal cord. At E16, MIA decreased the number of olig2+ and Iba‐1+ cells in multiple grey and white matter regions of the developing spinal cord 5 h after injection. These decreases were not observed at postnatal day 14. In contrast, MIA at E12 did not alter Olig2+ or Iba‐1+ cell number in the developing spinal cord 5 h after injection, however, Olig2+ cell number was decreased in the ventral grey matter of the P14 spinal cord. No changes were observed in glial fibrillary acidic protein (GFAP) expression at P14 following MIA at either E12 or E16. These data suggest that E16 may be a window of immediate vulnerability to MIA during spinal cord development, however, the findings also suggest that the developmental process may be capable of compensation over time. Potential changes in P14 animals following the challenge at E12 are indicative of the complexity of the effects of MIA during the developmental process.
Keywords: astroglia, cellular development, development, maternal immune activation, maternal infection, microglia, neurodevelopment, oligodendrocytes, spinal cord
Exposure to maternal immune activation differentially affects neural cell populations at different stages of development in the spinal cord.

1. INTRODUCTION
Maternal immune activation (MIA) during gestation has been implicated as a risk factor in the development of multiple neurological disorders including schizophrenia and autism (Atladottir et al., 2010; Brown, 2012; Brown, Begg, et al., 2004). The risk of MIA during central nervous system (CNS) development was first identified in epidemiological studies of influenza infection during pregnancy. Since these original retrospective studies linked maternal influenza infection to an increased incidence of schizophrenia in offspring, numerous studies, both retrospective and prospective in nature, have linked a wide variety of maternal infections to an increased risk of schizophrenia in offspring. These infections include influenza, toxoplasma gondii, rubella and herpes simplex complex type two (Babulas et al., 2006; Brown, 2012; Brown et al., 2000; Brown, Hooton, et al., 2004). Autism spectrum disorder (ASD), like schizophrenia, has also been linked to MIA through epidemiological cohort studies and meta‐analyses (Atladottir et al., 2010; Lee et al., 2015; Zerbo et al., 2013). More recently, cohort studies have implicated MIA in the development of both cerebral palsy and epilepsy (Miller et al., 2012, 2013; Sun et al., 2008; Wu et al., 2013).
Interestingly, a number of these epidemiological studies have suggested that the gestational timing at which an insult occurs may be a key determinant of the neurological outcome of MIA. However, there is yet no clear consensus. A large nested cohort study carried out in a Californian population between 1959 and 1967, suggested that the incidence of schizophrenia in offspring was threefold higher in children of mothers who suffered an influenza infection during the first half of gestation, and sevenfold higher in offspring of those suffering infection during the first trimester. No such increase was evident in the second half of gestation (Brown, Begg, et al., 2004). In contrast, a retrospective study carried out on the Danish population over a 40‐year period from 1911 to 1950 found that maternal influenza infection during the sixth‐month gestation was associated with an increased risk of schizophrenia in offspring (Barr et al., 1990). This is in line with a number of other studies, which have largely linked influenza exposure in the second trimester to the development of schizophrenia in offspring (for review see Brown & Derkits, 2010). Epidemiological studies examining the association of MIA and ASDs have reported similarly conflicting findings. A Danish study following the children of women hospitalised for infections during pregnancy over a 25‐year period showed no association between maternal infection and ASDs in offspring when investigating the total gestational time. However, maternal viral infection during the first trimester, and maternal bacterial infection during the second trimester, were both associated with an increased risk of ASDs (Atladottir et al., 2010). Contrary to this, a Swedish study encompassing births between 1984 and 2007 found that maternal infection requiring hospitalisation increased the incidence of ASDs regardless of the insult type or gestational timing (Lee et al., 2015). A third smaller study, using a Californian population, associated maternal infection requiring hospitalisation with an increased risk of ASD that was particularly associated with bacterial infections diagnosed in the second and third trimester (Zerbo et al., 2013). These conflicting epidemiological studies, whilst informative in many ways, have necessitated the development of animal models in which to better study the neurodevelopmental effects of MIA on offspring. Studies utilising these animal models have indicated that maternal treatment with the bacterial mimetic lipopolysaccharide (LPS) during pregnancy can have profound effects on the neurons, oligodendrocytes, astrocytes and microglia of the developing CNS (Fatemi, Folsom, Reutiman, Abu‐Odeh, et al., 2009; Harvey & Boksa, 2012; O'Loughlin et al., 2017; Oskvig et al., 2012; Rousset et al., 2006).
The use of animal models allows for the control of many of the variables encountered in epidemiological studies. Animal models allow for the control of insult type, bacterial or viral, and critically, the severity of the insult encountered. They also eliminate other confounding factors such as maternal stress or deprivation. Time‐mating protocols allow for control over insult timing, and for a more accurate investigation of the windows of vulnerability associated with MIA in epidemiological studies. These models have consistently demonstrated the importance of insult timing and the brain region examined in the delineation of critical regions of vulnerability. For example, Fatemi et al. have comprehensively illustrated the importance of insult timing and brain region examined on the expression of multiple white matter markers, whilst Juckel et al. have identified a regional specificity in microglial response to MIA at E9 (Fatemi et al., 2005; Fatemi, Folsom, Reutiman, Abu‐Odeh, et al., 2009; Fatemi, Folsom, Reutiman, Huang, et al., 2009; Juckel et al., 2011). MIA in animal models has reliably resulted in behavioural changes consistent with human neurological conditions such as schizophrenia and autism. Behavioural changes, such as the social deficit, impaired pre‐pulse inhibition, stereotypical or repetitive behaviours and decreases in communication, have all been identified in offspring of dams exposed to infection (Ben‐Reuven & Reiner, 2021; Malkova et al., 2012; Zhu et al., 2014). Overall, animals provide a robust model in which to investigate the complexities of MIA.
In this study, we used a time‐mated rat model to investigate the cellular effects of bacterial infection at specific gestational periods of interest in the spinal cord. The spinal cord was chosen as the timing of the generation, differentiation and migration of different cell populations and the production of myelin have been established in some detail in the foetal and early postnatal rodent spinal cord, making this CNS region suited to investigations aimed at understanding the developmental effects of inflammation on the developing foetal nervous system. Furthermore, as the majority of studies to date on the MIA effects have focused on diverse brain regions it is timely to extend the analysis to the spinal cord, a region integral to CNS function with clear anatomical boundaries and architecture. Embryonic days (E)12 and E16 were chosen specifically for their importance during spinal cord development. At E12, cells in the spinal cord undergo massive proliferation, whilst at E16 migration is laying the foundations for later developmental processes such as myelination and synaptic refinement. Moreover, previous studies have shown differential effects of LPS‐induced MIA at E12 or E16 on behavioural outcomes in the rat (Straley et al., 2017), suggesting that LPS‐induced MIA may differentially affect spinal cord development at these two developmental time points. These time points also mimic periods of human gestation which have been shown to be vulnerable in epidemiological studies (Atladottir et al., 2010; Brown, Begg, et al., 2004; Brown & Derkits, 2010; Patten et al., 2014). In this study, MIA was induced by maternal injection with bacterial mimetic LPS and the effect was investigated in the oligodendrocytes, astrocytes and microglia of the spinal cords of offspring. We investigated the effects of MIA at the immediate 5 h time‐point as previous studies, in our own laboratory and others, have indicated that changes in gene expression were evident and measurable as early as 3‐h post‐MIA (Ben‐Reuven & Reiner, 2021; Garbett et al., 2012; O'Loughlin et al., 2017; Oskvig et al., 2012; Park et al., 2018; Vasistha et al., 2020) and also at P14, a time‐point where the cell types of interest were largely in their final position in the cord. The spinal cord provides a number of advantages for the study of MIA at the cellular level. Although it is likely that any major cognitive defects resulting from MIA will arise in cortical structures, the complexity of cortical development makes it challenging to unravel the detail of cellular and structural deficits that may arise. Cellular development in the spinal cord is well characterised, owing largely to the fact that a number of seminal works in early neuroscience were carried out in this region (Altman & Bayer, 1984, 2001). The spinal cord is relatively uniform and provides an accessible tissue source for investigation, particularly in embryological studies where tissue from specific CNS regions may be difficult to obtain. Another unique aspect of the spinal cord is the ability, at a single time point, to study multiple stages of development in the same animal due to the rostro‐caudal gradient of development (Nakayama et al., 1999). This allows precise identification not only of the windows of vulnerability of cells in the spinal cord as a whole to MIA but also allows observation of the developmental state of the cells affected. When investigating MIA from a cellular perspective the spinal cord is a valuable model as a result of this detailed characterisation and relative simplicity when compared to other regions of the CNS.
2. MATERIALS AND METHODS
2.1. Time‐mating
Time mated, pregnant, Sprague Dawley rats were obtained from the Biological Services Unit at University College Cork, Ireland under full ethical approval. The presence of a vaginal plug confirmed pregnancy and was designated as embryonic day (E)0. Dams were housed on a 12 h light/dark cycle (light on 08:00) at 21 ± 2°C with ad libitum access to food and water. Pregnant dams received a single intraperitoneal (i.p) injection of 100 μg/kg of LPS (Sigma‐Aldrich) or 0.9% saline (control) on E12 or E16.
2.2. Tissue collection and processing
Dams were anaesthetised with pentobarbital and decapitated at 5 h post‐injection or left to give birth. Embryos were collected by laparotomy and fixed by immersion in 4% paraformaldehyde (PFA) solution overnight at 4°C, followed by cryoprotection in 30% sucrose before snap freezing and storage at −80°C. P14 pups were anesthetised by i.p injection of pentobarbital and transcardially perfused with 10 mM phosphate‐buffered saline (PBS) followed by 4% PFA. Spinal cords were post‐fixed in 4% PFA and processed as described above. P14 cords were stored at −80°C. Tissue samples were transversely sectioned at 15 μm using a cryostat (Lecia Microsystem GmbH). To assign sections to the rostral, middle and caudal regions of the cord, one cord per litter was sectioned in its entirety to estimate the length of the cord. Dividing this standard length into five rostral to caudal regions then allowed regions 1, 3, and 5 to be designated rostral, middle, and caudal, respectively. No sections were subsequently analysed from regions 2 and 4 of the cord to ensure adequate regional separation. The relevant rostral, middle, and caudal sections were processed for immunofluorescent staining.
2.3. Immunofluorescent staining
Rehydrated slides were incubated in blocking solution (5% donkey serum, 0.4% Triton X in 10 mM PBS) for 1 h at room temperature (RT). After 1 h, the excess blocking solution was removed and slides were incubated in primary antibody solution (primary antibody diluted in 2.5% donkey serum, 0.1% Triton X in 10 mM PBS) (Table 1). Following incubation slides were rinsed with PBS (4 × 6 min) before incubation in secondary antibody solution diluted in the appropriate AlexFluor® secondary antibody diluted in 2.5% donkey serum and 0.1% triton X in 10 mM PBS (Table 1) for 2–2.5 h at RT. Slides were rinsed with 10 mM PBS (4 × 6 min) and counterstained with bisbenzimide solution (1:5000 in 10 mM PBS) for 3 min. Slides were washed with 10 mM PBS (3 × 10 min) and mounted with fluoromount G (Affymetrix/eBiosciences) .
TABLE 1.
Primary and secondary antibody details
| Antibody | Concentration | Supplier |
|---|---|---|
| Anti‐rabbit Oligo2 | 1:400 | Millipore (AB9610) |
| Anti‐mouse MBP | 1:1000 | Invitrogen (GT3412) |
| Anti‐goat Iba1 | 1:800 | Abcam (Ab5076) |
| Anti‐mouse NeuN | 1:500 | Invitrogen (Ab2802653) |
| Anti‐mouse GFAP | 1:800 | Abcam (Ab4648) |
| Alexa‐Fluor® antibodies | 1:200 | Invitrogen |
2.4. Image acquisition and quantification
All samples were imaged on an Olympus IX83 research inverted microscope at 20× using a DP80 digital microscope camera (Olympus). Images were post‐coloured where necessary using the CellSens Dimensions software (Olympus). All image post‐processing and analysis were carried out using the Fiji Image J distribution package (Schindelin et al., 2012) and all analyses for each cell type were carried out in a blinded manner as outlined below.
2.5. Olig2 and Iba1 quantification
In E12 samples, the number of olig2+ and Iba1+ cells in whole transverse sections of the spinal cord was counted using the ‘cell counter’ add‐on in Fiji. The average number of olig2+ or Iba1+ cells was determined by averaging the absolute counts in four, non‐serial sections from the rostral, middle and caudal regions of the same cord. In E16 and P14 samples, representative images of the dorsal, intermediate and ventral white matter and dorsal and ventral grey matter were obtained. A region of interest (ROI), of a known volume of tissue and location, was quantified in each image. The absolute number of olig2+ or Iba1+ cells in each ROI was again counted across 4 non‐serial sections in each animal using the cell counter add‐on for Fiji and averaged.
2.6. MBP and GFAP quantification
The relative expression of myelin basic protein (MBP) and glial fibrillary acidic protein (GFAP) in postnatal samples was analysed by fluorescence intensity analysis using Image J. Representative images of the dorsal and ventral grey matter, and the dorsal, intermediate and ventral white matter were obtained for GFAP imaging. In the MBP samples regions spanning the substantia gelatinosa and the nucleus intermediolateralis were selected in place of the dorsal grey matter. The background was subtracted from each image using the sliding paraboloid function on Fiji and a ROI was selected. The mean fluorescence intensity was then measured in the ROI.
2.7. Statistical analysis
All data are presented as the mean ± standard error of the mean where n = 3 independent litters. Two animals from each litter were analysed and served as technical replicates and the mean of these was calculated to give a single value per parameter per litter. Data were analysed using a two‐way analysis of variance (ANOVA) followed by a Fisher's least significant difference (LSD) post hoc test using GraphPad prism version 9.0 for windows (GraphPad Software).
3. RESULTS
3.1. Olig2 and MBP expression in the E12, E16 and P14 spinal cord following MIA with 100 μg/kg LPS
3.1.1. Olig2
Olig2+ cell nuclei were identified in the rostral, middle and caudal regions of the spinal cord at E12. Following MIA at E12 Olig2+ cell nuclei number per unit volume was examined in spinal cord sections. A two‐way ANOVA saw no significant effect of LPS treatment (F [1, 22] = 4.186, p = 0.0529), a significant effect of region (F [2, 22] = 18.79, p < 0.0001) and no significant interaction (F [2, 22] = 0.3479, p = 0.7100). Post hoc analysis with an uncorrected Fisher's LSD showed no significant change in the number of Olig2+ cells in response to 100 μg/kg LPS challenge in rostral, middle and caudal cords (Figure 1c, p > 0.05 in all instances).
FIGURE 1.

Exposure to MIA does not affect the number of Olig2+ cells in the rostral middle or caudal spinal cord at E12. (a, b) Representative photomicrographs showing Olig2 staining in the rostral middle and caudal spinal cord as indicated of offspring 5 h after exposure to either saline or 100 μg/kg LPS on E12. (i) Schematic indicating the selected ROI for the experiment. (ii, iii) Representative high power micrographs of the ventral grey matter of the rostral spinal cord. (c) Graph showing the number of Olig2+ nuclei in the rostral middle and caudal spinal cord of offspring exposed to 100 μg/kg LPS on E12. All data are presented as mean ± SEM and were analysed using a two‐way ANOVA, Scale bar = 50 μm. n = 3 litters per group. ANOVA, analysis of variance; LPS, lipopolysaccharide; MIA, maternal immune activation; SEM, standard error of the mean.
During normal development Olig2+ cell nuclei are present in the rostral, middle and caudal regions of the spinal cord at E16 (Figure 2a). Following MIA at E16 with 100 μg/kg LPS Olig2+ cell number per unit volume was examined in five distinct regions of the spinal cord and compared to control animals. These regions included the dorsal and ventral grey matter, and the dorsal, ventral and intermediate white matter. Two‐way ANOVA revealed significant changes in the dorsal grey matter in response to LPS treatment (Figure 2c, F [1, 17] = 32.88, p < 0.0001). There was also a significant effect of region (F [2, 17] = 94.31, p < 0.0001) and a significant interaction (F [2, 27] = 25.41, p < 0.0001). Post hoc analysis using an uncorrected Fisher's LSD identified a significant decrease in the number of olig2+ cells in the dorsal grey matter of the rostral spinal cord (p < 0.0001). LPS treatment also significantly affected the ventral grey matter (Figure 2d, F [1, 12] = 30.97, p < 0.0001). There was a significant effect of region (F [2, 12] = 8.105, p = 0.0059) but no significant interaction (F [2, 12] = 0.8327, p = 0.4585). Post hoc analysis showed significant decreases in Olig2+ cell number in the rostral, middle and caudal spinal cord in response to LPS (p = 0.0012, p = 0.0103 and p = 0.0334, respectively). In the dorsal white matter, both LPS treatment and region examined had a significant effect on the number of Olig2+ cells (Figure 2e, F [1, 8] = 3.877, p = 0.0845 and F [1, 8] = 91.46, p < 0.0001, respectively). There was no significant interaction (F [1, 8] = 2.541, p = 0.1496). Uncorrected Fisher's LSD identified a significant decrease in the number of olig2+ cells in the dorsal white matter of the rostral spinal cord (p < 0.0358). The dorsal white matter of the caudal cord was not examinable at this age. In the intermediate white matter both LPS treatment and region examined had a significant effect on the number of Olig2+ cells (Figure 2f, F [1, 12] = 19.03, p = 0.0009 and F [2, 12] = 62.59, p < 0.0001, respectively). There was also significant interaction (F [2, 12] = 6.524, p = 0.0121). Uncorrected Fisher's LSD identified a significant decrease in the number of olig2+ cells in the intermediate white matter of the rostral spinal cord (p < 0.0001). In the ventral white matter, both LPS treatment and region examined had a significant effect on the number of Olig2+ cells (Figure 2g, F [1, 12] = 5.237, p = 0.0410, and F [2, 12] = 68.38, p < 0.0001, respectively). There was no significant interaction (F [2, 12] = 1.102, p = 0.3636). Uncorrected Fisher's LSD identified a significant decrease in the number of olig2+ cells in the ventral white matter of the rostral spinal cord (p < 0.0271).
FIGURE 2.

Exposure to MIA affects the number of Olig2+ nuclei in specific regions of the E16 spinal cord. (a, b) Representative micrographs showing Olig2 staining in the ventral grey matter of the offspring spinal cord as indicated 5 h after exposure to either saline or 100 μg/kg LPS on E16. (i) Schema indicating the locations of the ROIs in experiment 2. (ii, iii) Representative high power photomicrographs of the ventral grey matter of the rostral spinal cord. (c–g) Graphs showing the number of Olig2+ nuclei in the (c) dorsal grey matter, (d) ventral grey matter, (e) dorsal white matter, (f) intermediate white matter and (g) ventral white matter of offspring exposed to either saline or 100 μg/kg LPS on E16. All data are presented as mean ± SEM and were analysed using a two‐way ANOVA, Scale bar = 50 μm. n = 3 litters per group. ANOVA, analysis of variance; LPS, lipopolysaccharide; MIA, maternal immune activation; ROI, region of interest; SEM, standard error of the mean.
Olig2+ cell nuclei were found throughout the rostral region of the spinal cord at P14, occupying the grey and white matter in their entirety (Figure 3a). Olig2+ cell number per unit volume was examined at P14 in the rostral spinal cord of offspring of dams exposed to MIA (100 μg/kg LPS) at E12 and E16. Olig2+ cell number was examined in four regions, the dorsal and ventral grey matter and the intermediate and ventral white matter. Two‐way ANOVA revealed no significant changes in the P14 grey matter broadly in response to LPS treatment at E12 (Figure 3c, F [1, 18] = 7.815, p = 0.0583). There was a significant effect of region (F [1, 8] = 7.341, p = 0.0267) and there was no significant interaction (F [1, 8] = 1.184, p = 0.3082). Post hoc analysis using an Uncorrected Fisher's LSD identified a significant decrease in the number of olig2+ cells in the P14 ventral grey matter of the rostral spinal cord (p = 0.0481). There was no significant effect of treatment on the white matter of P14 spinal cords of offspring treated at E12, or the grey matter and white matter of P14 spinal cords of offspring treated at E16 (Figure 3d–f). There was a significant effect of region in the white matter of P14 spinal cords of offspring treated at E12 (Figure 3d, F [1, 8] = 22.30, p = 0.0015). There was no significant effect of region in the grey or white matter regions of the P14 cord treated at E16 (Figure 3e,f).
FIGURE 3.

Exposure to MIA affects the number of Olig2+ nuclei in the ventral grey matter of the postnatal spinal cord of E12 injected animals. (a, b) Representative micrographs showing Olig2 staining in different regions of the P14 spinal cord as indicated in offspring exposed to either saline or 100 μg/kg LPS on E12 or E16. (i) Schema indicating the ROIs examined in experiment 3. (ii, iii) Representative high power micrographs of the ventral grey matter. (c–f) Graphs showing olig2+ cell number in different regions of the P14 spinal cord following exposure to either saline or 100 μg/kg LPS on E12 (c, d) or E16 (e, f). All data are presented as mean ± SEM and were analysed using a two‐way ANOVA, Scale bar = 50 μm Inj. = injection. n = 3 litters per group. ANOVA, analysis of variance; LPS, lipopolysaccharide; MIA, maternal immune activation; ROI, region of interest; SEM, standard error of the mean.
3.1.2. MBP
MBP expression was examined in the rostral spinal cord at P14 by mean fluorescence intensity analysis. At P14 MBP is expressed throughout the rostral spinal cord (Figure 4a). MBP expression was examined by fluorescence intensity analysis in the dorsal, intermediate and ventral white matter, as well as the in the longitudinal and transverse fibres of the dorsal grey matter, and the ventral grey matter, of the P14 spinal cord following MIA with 100 μg/kg LPS at E12 and E16. Two‐way ANOVA revealed significant changes in the P14 white matter in response to LPS treatment at E12 (Figure 4f, F [1, 12] = 13.73, p = 0.0030). There was no significant effect of region (F [2, 12] = 0.2679, p = 0.7694) or interaction (F [2, 12] = 0.4535, p = 0.6458). Post hoc analysis using an Uncorrected Fisher's LSD identified a significant decrease in the number of olig2+ cells in the P14 ventral white matter of the rostral spinal cord (p = 0.0129). LPS had no significant effect on the grey matter of the P14 spinal cord following LPS treatment at E12, or on the grey and white matter of the P14 cord following treatment at E16 (Figure 4e,g,h). There was a significant effect of region identified in the Grey matter of the P14 cord following LPS treatment at E12 (F [2, 12] = 20.42, p = 0.0001) and the grey matter of the P14 cord following treatment at E16 (F [2, 12] = 4.003, p = 0.0466).
FIGURE 4.

Exposure to MIA at E12 affects myelin basic protein (MBP) expression in the ventral white matter of the postnatal rostral spinal cord. (a–d) Representative photomicrographs showing MBP staining in different regions of the spinal cord as indicated in offspring that were exposed to either saline or 100 μg/kg LPS on E12 or E16. (i) Schema indicating the ROIs examined in experiment 4. (e, f) Graphs showing the relative fluorescence intensity of MBP staining in (e) grey matter and (f) white matter at P14 in offspring that were exposed to either saline or 100 μg/kg LPS on E12. (g, h) Graphs showing the relative fluorescence intensity of MBP staining in (g) grey matter and (h) white matter at P14 in offspring that were exposed to either saline or 100 μg/kg LPS on E16. All data are presented as mean ± SEM, and were analysed using a two‐way ANOVA, Scale bar = 50 μm. Inj. = Injection. AU = arbitrary unit. n = 3 litters per group. ANOVA, analysis of variance; LPS, lipopolysaccharide; MIA, maternal immune activation; ROI, region of interest; SEM, standard error of the mean.
3.2. Iba‐1 expression in the E12, E16 and P14 spinal cord following MIA with 100 μg/kg LPS
At E12 Iba‐1+ cells are sparsely present in the rostral, middle and caudal spinal cord (Figure 5a) (<10 Iba‐1+ cells per whole cord slice in all instances). Higher numbers of Iba‐1+ cells are present per unit volume in the more developmentally mature rostral spinal cord, with progressively lower numbers present in the middle and caudal spinal cord (Figure 5c).
FIGURE 5.

MIA exposure did not affect the number of Iba‐1+ cells in the E12 spinal cord. (a, b) Representative photomicrographs of E12 spinal cord as indicated 5 h after exposure to either saline or 100 μg/kg LPS. (i) Schema indicating the ROI for experiment 5. (c) Graph showing the number of Iba‐1+ nuclei in the rostral, middle and caudal spinal cord 5 h after exposure to either saline or 100 μg/kg LPS on E12. All data are presented as mean ± SEM and were analysed using a two‐way ANOVA, Scale bar = 50 μm. n = 3 litters per group. ANOVA, analysis of variance; LPS, lipopolysaccharide; MIA, maternal immune activation; ROI, region of interest; SEM, standard error of the mean.
Following MIA with 100 μg/kg LPS Iba‐1+ cell number per unit volume was examined in whole cord slices of the E12 rostral, middle and caudal spinal cord. Two‐way ANOVA revealed no significant change in the E12 spinal cord in response to treatment with LPS. There was a significant effect of region on Iba‐1+ cell expression (Figure 5c, F [2, 12] = 34.06, p < 0.0001) with more Iba‐1+ cells in the rostral region of the spinal cord.
At E16 Iba‐1+ cells are present throughout the rostral, middle and caudal regions of the spinal cord (Figure 6a,b). Five hours post‐MIA at E16 with 100 μg/kg LPS Iba‐1+ cell number per unit volume was examined in the dorsal and ventral grey and white matter of the rostral, middle and caudal spinal cord. Two‐way ANOVA showed a significant effect of LPS treatment on the dorsal grey matter (Figure 6c, F [1, 12] = 11.28, p = 0.0057), ventral grey matter (Figure 6d, F [1, 12] = 53.37, p < 0.0001), dorsal white matter (Figure 6e, F [1, 12] = 23.14, p = 0.0004) and ventral white matter (Figure 6f, F [1, 12] = 35.34, p < 0.0001). There was no significant effect of region. There was a significant interaction identified in the dorsal grey matter (F [2, 12] = 8.513, p = 0.0050). Post hoc analysis with an uncorrected Fisher's LSD showed a significant decrease in the number of Iba‐1+ cells in the dorsal grey matter of the rostral and middle spinal cord (p = 0.0010 and p = 0.0151, respectively), the ventral grey matter of the rostral, middle and caudal spinal cord (p = 0.001, p = 0.0032 and p = 0.0056, respectively), the dorsal white matter of the rostral and middle spinal cord (p = 0.0055 and p = 0.0105, respectively), and the ventral white matter of the rostral, middle and caudal spinal cord (p = 0.0011, p = 0.0027 and p = 0.0415 respectively).
FIGURE 6.

MIA affects the number of Iba‐1+ cells in the E16 spinal cord. (a, b) Representative photomicrographs of Iba‐1 staining in the ventral spinal cord of the E16 spinal cord 5 h after exposure to either saline or 100 μg/kg LPS as indicated. (i) Schema indicating the ROIs examined in experiment 6. (ii, iii) Representative high power photomicrographs of ventral grey matter. (c–f) Graphs showing the number of Iba‐1+ cells in the (c) dorsal grey matter, (d) ventral grey matter, (e) dorsal white matter and (f) ventral white matter of the E16 spinal cord 5 h after exposure to either saline or 100 μg/kg LPS at E16. All data are presented as mean ± SEM and were analysed using a two‐way ANOVA, Scale bar = 50 μm. n = 3 litters per group. ANOVA, analysis of variance; LPS, lipopolysaccharide; MIA, maternal immune activation; ROI, region of interest; SEM, standard error of the mean.
At P14 Iba‐1+ cells have populated the grey and white matter of the rostral spinal cord in its entirety (Figure 7a). Two‐way ANOVA found no significant effect of LPS treatment on the grey and white matter of P14 spinal cords of offspring at the E12 or E16 treatment points (Figure 7c–f). There was a significant effect of region on the number of Iba‐1+ cells in the grey matter following both E12 and E16 treatments (F [1, 8] = 13.41, p = 0.0064 and F [1, 8] = 5.401, p = 0.0486, respectively).
FIGURE 7.
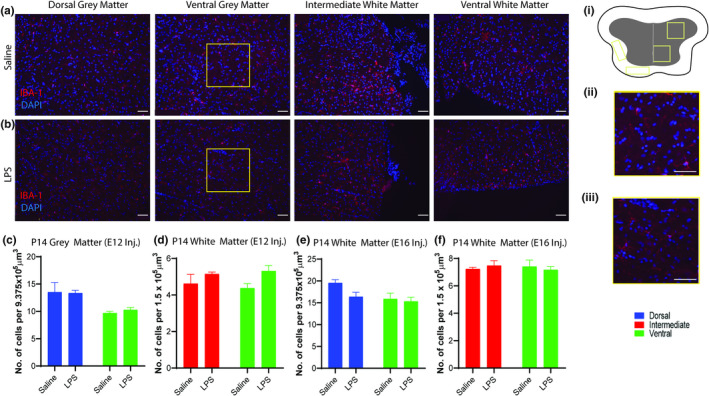
MIA did not affect the number of Iba‐1+ cell nuclei in the P14 spinal cord. (a, b) Representative photomicrographs of the P14 spinal cord after exposure to saline or 100 μg/kg LPS at E12 or E16 as indicated. (i) Schema indicating the ROIs examined in experiment 7. (ii, iii) representative high power photomicrographs of the ventral grey matter. (c–f) Graphs showing the number of Iba‐1+ nuclei in different regions of the rostral P14 spinal cord after exposure to saline or 100 μg/kg LPS at E12 (c, d) or E16 (e, f). All data are presented as mean ± SEM, and were analysed using a two‐way ANOVA, Scale bar = 50 μm. Inj. = Injection. n = 3 litters per group. ANOVA, analysis of variance; LPS, lipopolysaccharide; MIA, maternal immune activation; ROI, region of interest; SEM, standard error of the mean.
3.3. GFAP expression in the P14 spinal cord following MIA with 100 μg/kg LPS
At P14 GFAP+ cells have populated the entirety of the grey and white matter of the spinal cord (Figure 8a). At P14 GFAP expression was examined using fluorescence intensity analysis in the dorsal, intermediate and ventral white matter, and the dorsal and ventral grey matter, of the rostral spinal cord. Two‐way ANOVA identified no effect of LPS treatment at either E12 or E16 on GFAP fluorescence intensity in grey or white matter regions (Figure 8c–f). A significant effect of region on GFAP mean fluorescence intensity was identified in the white matter in both treatment groups (E12 group: F [2, 12] = 4.311, p = 0.0277, E16 group F [2, 12] = 45.289, p = 0.0225). There was no significant interaction.
FIGURE 8.

MIA did not affect the mean fluorescence intensity of glial fibrillary acidic protein (GFAP) in the P14 spinal cord. (a, b) Representative micrographs showing GFAP staining in the P14 spinal cord. (i) Schema indicating the ROIs examined in experiment 8. (ii) Representative high power photomicrographs of the intermediate white matter. (c–f) Graphs showing the mean fluorescence intensity of GFAP in the grey and white matter of the P14 spinal cord following exposure to either saline or 100 μg/kg LPS on E12 (c, d) or E16 (e, f). All data are presented as mean ± SEM and were analysed using a two‐way ANOVA, Scale bar = 200 μm (a) 50 μm (b). Inj. = Injection. AU = arbitrary unit. n = 3 litters per group. ANOVA, analysis of variance; MIA, maternal immune activation; ROI, region of interest; SEM, standard error of the mean.
4. DISCUSSION
Since epidemiological studies first suggested a link between MIA and the occurrence of neurodevelopmental and neuropsychiatric disorders there has been much interest in attempting to delineate further the critical periods during neurodevelopment at which MIA must occur in order for these adverse effects to appear later in life. These studies have largely focused on animal models of MIA, allowing more direct investigation of the cellular effects of MIA in offspring and with much greater control over variables such as insult type, severity and timing during gestation. This study aimed to investigate both the immediate and longer‐term consequences of MIA on the cytoarchitecture of the developing spinal cord in a rodent model, focusing on a number of specific cell populations and insult time points.
The findings implicate E16 as a developmental stage of particular vulnerability to MIA in the developing rodent spinal cord. More specifically, inducing MIA at E16 with an i.p injection of 100 μg/kg LPS appeared to have an acute effect on oligodendrocytes and microglia of offspring. E16 in the rat spinal cord is a period of significant developmental change. Neurogenesis, microglial invasion, astrogliogenesis and oligodendrogliogenesis have all begun (Barry & McDermott, 2005; Cai et al., 2005; Gotz & Huttner, 2005; Rigato et al., 2011). There is a considerable amount of cell and axonal migration occurring in order to establish the correct neuro‐circuitry as well as laying the framework for later processes such as myelination and synaptic refinement. In humans, this time period correlates approximately to midway through the second trimester of pregnancy, a period already identified as potentially vulnerable to MIA in a number of epidemiological studies (Atladottir et al., 2010; Brown & Derkits, 2010; Patten et al., 2014).
The results suggest that the acute changes observed in oligodendrocytes and microglia at E16 are not observed later at P14. This could be due to a number of factors, and transience in the effect of MIA has been reported in previous studies (Makinodan et al., 2008; Rousset et al., 2006, 2013). It may simply be the case that the spinal cord has recovered from the insult due to the high plasticity of the developing CNS (Kaas, 2001). In the case of microglia, it may be that, initially, colonisation of the cord was simply delayed by MIA, as these cells arise outside the CNS. A study characterising the colonisation of the mouse spinal cord by microglia has suggested that colonisation begins at E11.5 (~E13 in the rat) and that microglia are distributed throughout the parenchyma by E15.5 (~E17 in the rat) (Rigato et al., 2011). If this is the case, it may be that by P14 colonisation and local expansion had returned numbers to normal levels. It is also possible that early changes in cell number and marker expression observed 5 h after MIA at E16 are later masked by ongoing synaptic pruning and apoptosis, which occur as part of normal development in the CNS (Riccomagno & Kolodkin, 2015). It is of course also possible that changes in the cord postnatally may be present but have not been captured by the methods employed here and further research is required to more completely address this question. Despite the apparent transience, decreases in microglial and oligodendroglial numbers may have long‐lasting and far‐reaching consequences on the adult spinal cord. A transient decrease in microglial numbers may alter the cytokine profile of the developing CNS. Cytokines have a critical, well‐established role in the process of normal neurodevelopment, perturbation of which has long‐lasting consequences (Cai et al., 2000; Matcovitch‐Natan et al., 2016). A transient decrease in Oligodendrocytes at E16, meanwhile, may influence where white matter tracts are established, influencing the neurocircuitry of the spinal cord subtly as cell and axonal migration are underway.
Other studies in the literature have also investigated the effect of MIA around the E16 time point on oligodendrocyte, microglia and astrocyte development and reported effects after different survival times. A study by Fatemi, Folsom, Reutiman, Abu‐Odeh, et al. (2009) identified decreases in white matter markers such as MBP, MOBP, MOG, MAL and PLP1 in the hippocampus of P0 offspring following MIA with a sublethal dose of H1N1 at E16 in mice . An E15 study in rats, in which dams received a 4 mg/kg injection of Poly(I:C), identified decreases in MBP and Rhombex29 in the prefrontal cortex at P120 (Farrelly et al., 2015). A study of E15 in mice saw decreases in MBP levels in the corpus callosum, but not the anterior commissure, of offspring 28 weeks post a 50 μg/kg LPS injection, indicative of some spatial dependence of the effects of MIA on white matter development (Makinson et al., 2017). Whilst these studies focus on different areas of the CNS, using differing insult types, insult severities and at times different species, there appears to be agreement that MIA at E16 alters oligodendrocytes in the CNS.
The literature on the effects of MIA on microglia indicates more conflicting findings. A study at E15 in rats using 4 mg/kg poly(I:C) as the immune insult, identified no changes in Iba‐1 expression or CD11b expression in the frontotemporal cortex, corpus callosum, dorsal hippocampus, thalamus, striatum or pons between P90 and P104 (Missault et al., 2014). In contrast, however, another study by the same group, using the same immune challenge, observed an increase in CD11b in the hippocampus, thalamus and corpus callosum of offspring at P180 (Van den Eynde et al., 2014). A study at E15 in mice using 50 μg/kg LPS saw an increase in the number of CD45intCD11b+ cells in whole brain samples at 28 weeks (P196) (Makinson et al., 2017). Another study, at E15, but this time using 100 μg/kg LPS, reported a decrease in CXCR3 expression in the dorsal hippocampus of mice at P15 (Fernandez de Cossio et al., 2016). A study utilising Escherichia coli as the immune challenge at E17 in rats saw an increase in ED‐1 in the cingulum of offspring at P8 which persisted to P15 (Pang et al., 2005). These contrasting findings may be indicative of a complex, temporally and spatially dependent response of immune cells in the CNS to MIA. Unfortunately, to our knowledge, no other studies have investigated the consequences of MIA on microglia in the immediate or early postnatal periods and further work in this area is required in order to understand these effects more fully.
This study showed no difference in GFAP expression in response to MIA. However, a study in E9 mice, utilising a sublethal dose of the influenza virus, saw an increase in whole‐brain GFAP expression at P0 (Fatemi et al., 2005). Another study using the same insult conditions at E16 saw an increase in GFAP in the hippocampus at P56 (Fatemi, Folsom, Reutiman, Huang, et al., 2009). Interestingly, a third study at E18 in mice, and the only study to date to investigate the effects of MIA on astrocytes at the survival time point P14, the survival time point used here, saw no change in the expression of GFAP in the cortex, cerebellum or hippocampus following influenza‐induced MIA (Fatemi et al., 2008). However, GFAP expression was increased in the cortex and hippocampus at P8 in rats given repeated injections of 500 μg/kg LPS at E18 and E19 (Cai et al., 2000); and rats given 300 μg/kg LPS at E19 and E20 showed increased GFAP expression in the internal and external capsule at P7 (Rousset et al., 2006). The lack of any effect of LPS‐induced MIA at E16 on GFAP expression in rats might suggest that, at E16, the astroglial cells\progenitors are not particularly susceptible to MIA‐mediated insult.
Our study did not show any immediate effect of MIA at E12 on the oligodendrocytes or microglia of the developing spinal cord. At E12 the spinal cord is undergoing the switch from olig2+ motor neuron production to oligodendrocyte production in the pMN as illustrated in our own photomicrographs and previously identified by others (Lu et al., 2002; Rabadan et al., 2012; Touahri et al., 2012). It may be the case that Olig2 is a poor marker for delineating changes in this time period, or simply that the emerging oligodendrocytes are unaffected by the immune challenge at this point. The presence of subtle changes in Olig2+ cell number and MBP expression at P14 after injection at the E12 time point are suggestive of a delayed effect however and further investigation is warranted. In the case of the microglia at E12, it is, in hindsight, likely too early a window for the investigation of microglial response to MIA in the cord. A study by Rigato et al. (2011) has indicated the microglial population of the mouse spinal cord begins at E11.5 (~E13 in the rat).
In conclusion, this novel model of MIA in the rat spinal cord has demonstrated cellular consequences of maternal immune activation and is, we believe, an important stepping‐stone in the understanding of the underlying cellular causes of the effect of MIA in the human. We have identified E16 in the rat as a period of critical vulnerability for both oligodendrocytes and microglia. This model has illustrated the importance of the timing of an immune insult, identifying a period of critical vulnerability to MIA in the developing spinal cord, and demonstrated the propensity of the developing CNS for recovery, whilst also cautioning as to the long‐lasting and potentially profound consequences of MIA during gestation.
ACKNOWLEDGEMENTS
The authors would like to acknowledge the Anatomical Society and The University of Limerick School of Medicine for funding this research. Open access funding provided by IReL.
Anderson, R.C. , O’Keeffe, G.W. & McDermott, K.W. (2022) Characterisation of the consequences of maternal immune activation on distinct cell populations in the developing rat spinal cord. Journal of Anatomy, 241, 938–950. Available from: 10.1111/joa.13726
DATA AVAILABILITY STATEMENT
All data generated during this study are available on reasonable request from the corresponding author.
REFERENCES
- Altman, J. & Bayer, S.A. (1984) The development of the rat spinal cord. Advances in Anatomy, Embryology, and Cell Biology, 85, 1–164. [DOI] [PubMed] [Google Scholar]
- Altman, J. & Bayer, S.A. (2001) Development of the human spinal cord: an interpretation based on experimental studies in animals. Oxford: Oxford University Press. [Google Scholar]
- Atladottir, H.O. , Thorsen, P. , Ostergaard, L. , Schendel, D.E. , Lemcke, S. , Abdallah, M. et al. (2010) Maternal infection requiring hospitalization during pregnancy and autism spectrum disorders. Journal of Autism and Developmental Disorders, 40(12), 1423–1430. [DOI] [PubMed] [Google Scholar]
- Babulas, V. , Factor‐Litvak, P. , Goetz, R. , Schaefer, C.A. & Brown, A.S. (2006) Prenatal exposure to maternal genital and reproductive infections and adult schizophrenia. The American Journal of Psychiatry, 163(5), 927–929. [DOI] [PubMed] [Google Scholar]
- Barr, C.E. , Mednick, S.A. & Munk‐Jorgensen, P. (1990) Exposure to influenza epidemics during gestation and adult schizophrenia. A 40‐year study. Archives of General Psychiatry, 47(9), 869–874. [DOI] [PubMed] [Google Scholar]
- Barry, D. & McDermott, K. (2005) Differentiation of radial glia from radial precursor cells and transformation into astrocytes in the developing rat spinal cord. Glia, 50(3), 187–197. [DOI] [PubMed] [Google Scholar]
- Ben‐Reuven, L. & Reiner, O. (2021) Dynamics of cortical progenitors and production of subcerebral neurons are altered in embryos of a maternal inflammation model for autism. Molecular Psychiatry, 26(5), 1535–1550. [DOI] [PubMed] [Google Scholar]
- Brown, A.S. (2012) Epidemiologic studies of exposure to prenatal infection and risk of schizophrenia and autism. Developmental Neurobiology, 72(10), 1272–1276. [DOI] [PMC free article] [PubMed] [Google Scholar]
- Brown, A.S. , Begg, M.D. , Gravenstein, S. , Schaefer, C.A. , Wyatt, R.J. , Bresnahan, M. et al. (2004) Serologic evidence of prenatal influenza in the etiology of schizophrenia. Archives of General Psychiatry, 61(8), 774–780. [DOI] [PubMed] [Google Scholar]
- Brown, A.S. & Derkits, E.J. (2010) Prenatal infection and schizophrenia: a review of epidemiologic and translational studies. The American Journal of Psychiatry, 167(3), 261–280. [DOI] [PMC free article] [PubMed] [Google Scholar]
- Brown, A.S. , Hooton, J. , Schaefer, C.A. , Zhang, H. , Petkova, E. , Babulas, V. et al. (2004) Elevated maternal interleukin‐8 levels and risk of schizophrenia in adult offspring. The American Journal of Psychiatry, 161(5), 889–895. [DOI] [PubMed] [Google Scholar]
- Brown, A.S. , Schaefer, C.A. , Wyatt, R.J. , Goetz, R. , Begg, M.D. , Gorman, J.M. et al. (2000) Maternal exposure to respiratory infections and adult schizophrenia spectrum disorders: a prospective birth cohort study. Schizophrenia Bulletin, 26(2), 287–295. [DOI] [PubMed] [Google Scholar]
- Cai, J. , Qi, Y. , Hu, X. , Tan, M. , Liu, Z. , Zhang, J. et al. (2005) Generation of oligodendrocyte precursor cells from mouse dorsal spinal cord independent of Nkx6 regulation and Shh signaling. Neuron, 45(1), 41–53. [DOI] [PubMed] [Google Scholar]
- Cai, Z. , Pan, Z.L. , Pang, Y. , Evans, O.B. & Rhodes, P.G. (2000) Cytokine induction in fetal rat brains and brain injury in neonatal rats after maternal lipopolysaccharide administration. Pediatric Research, 47(1), 64–72. [DOI] [PubMed] [Google Scholar]
- Farrelly, L. , Focking, M. , Piontkewitz, Y. , Dicker, P. , English, J. , Wynne, K. et al. (2015) Maternal immune activation induces changes in myelin and metabolic proteins, some of which can be prevented with risperidone in adolescence. Developmental Neuroscience, 1, 43–55. [DOI] [PubMed] [Google Scholar]
- Fatemi, S.H. , Folsom, T.D. , Reutiman, T.J. , Abu‐Odeh, D. , Mori, S. , Huang, H. et al. (2009) Abnormal expression of myelination genes and alterations in white matter fractional anisotropy following prenatal viral influenza infection at E16 in mice. Schizophrenia Research, 1–3, 46–53. [DOI] [PMC free article] [PubMed] [Google Scholar]
- Fatemi, S.H. , Folsom, T.D. , Reutiman, T.J. , Huang, H. , Oishi, K. & Mori, S. (2009) Prenatal viral infection of mice at E16 causes changes in gene expression in hippocampi of the offspring. European Neuropsychopharmacology, 9, 648–653. [DOI] [PMC free article] [PubMed] [Google Scholar]
- Fatemi, S.H. , Pearce, D.A. , Brooks, A.I. & Sidwell, R.W. (2005) Prenatal viral infection in mouse causes differential expression of genes in brains of mouse progeny: a potential animal model for schizophrenia and autism. Synapse, 57(2), 91–99. [DOI] [PubMed] [Google Scholar]
- Fatemi, S.H. , Reutiman, T.J. , Folsom, T.D. , Huang, H. , Oishi, K. , Mori, S. et al. (2008) Maternal infection leads to abnormal gene regulation and brain atrophy in mouse offspring: implications for genesis of neurodevelopmental disorders. Schizophrenia Research, 1–3, 56–70. [DOI] [PMC free article] [PubMed] [Google Scholar]
- Fernandez de Cossio, L. , Guzman, A. , van der Veldt, S. & Luheshi, G.N. (2016) Prenatal infection leads to ASD‐like behavior and altered synaptic pruning in the mouse offspring. Brain, Behavior, and Immunity, 63, 88–98. [DOI] [PubMed] [Google Scholar]
- Garbett, K.A. , Hsiao, E.Y. , Kalman, S. , Patterson, P.H. & Mirnics, K. (2012) Effects of maternal immune activation on gene expression patterns in the fetal brain. Translational Psychiatry, 2, e98. [DOI] [PMC free article] [PubMed] [Google Scholar]
- Gotz, M. & Huttner, W.B. (2005) The cell biology of neurogenesis. Nature Reviews. Molecular Cell Biology, 10, 777–788. [DOI] [PubMed] [Google Scholar]
- Harvey, L. & Boksa, P. (2012) A stereological comparison of GAD67 and reelin expression in the hippocampal stratum oriens of offspring from two mouse models of maternal inflammation during pregnancy. Neuropharmacology, 4, 1767–1776. [DOI] [PubMed] [Google Scholar]
- Juckel, G. , Manitz, M.P. , Brune, M. , Friebe, A. , Heneka, M.T. & Wolf, R.J. (2011) Microglial activation in a neuroinflammational animal model of schizophrenia‐a pilot study. Schizophrenia Research, 1–3, 96–100. [DOI] [PubMed] [Google Scholar]
- Kaas, J.H. (2001) Neural plasticity. In: Smelser, N.J. & Baltes, P.B. (Eds.) International encyclopedia of the social and behavioral sciences. Oxford: Pergamon, pp. 10542–10546. [Google Scholar]
- Lee, B.K. , Magnusson, C. , Gardner, R.M. , Blomstrom, A. , Newschaffer, C.J. , Burstyn, I. et al. (2015) Maternal hospitalization with infection during pregnancy and risk of autism spectrum disorders. Brain, Behavior, and Immunity, 44, 100–105. [DOI] [PMC free article] [PubMed] [Google Scholar]
- Lu, Q.R. , Sun, T. , Zhu, Z. , Ma, N. , Garcia, M. , Stiles, C.D. et al. (2002) Common developmental requirement for Olig function indicates a motor neuron/oligodendrocyte connection. Cell, 109(1), 75–86. [DOI] [PubMed] [Google Scholar]
- Makinodan, M. , Tatsumi, K. , Manabe, T. , Yamauchi, T. , Makinodan, E. , Matsuyoshi, H. et al. (2008) Maternal immune activation in mice delays myelination and axonal development in the hippocampus of the offspring. Journal of Neuroscience Research, 86(10), 2190–2200. [DOI] [PubMed] [Google Scholar]
- Makinson, R. , Lloyd, K. , Rayasam, A. , McKee, S. , Brown, A. , Barila, G. et al. (2017) Intrauterine inflammation induces sex‐specific effects on neuroinflammation, white matter, and behavior. Brain, Behavior, and Immunity, 66, 277–288. [DOI] [PMC free article] [PubMed] [Google Scholar]
- Malkova, N.V. , Yu, C.Z. , Hsiao, E.Y. , Moore, M.J. & Patterson, P.H. (2012) Maternal immune activation yields offspring displaying mouse versions of the three core symptoms of autism. Brain, Behavior, and Immunity, 4, 607–616. [DOI] [PMC free article] [PubMed] [Google Scholar]
- Matcovitch‐Natan, O. , Winter, D.R. , Giladi, A. , Vargas Aguilar, S. , Spinrad, A. , Sarrazin, S. et al. (2016) Microglia development follows a stepwise program to regulate brain homeostasis. Science, 353(6301), aad8670. [DOI] [PubMed] [Google Scholar]
- Miller, J.E. , Pedersen, L.H. , Streja, E. , Bech, B.H. , Yeargin‐Allsopp, M. , Van Naarden Braun, K. et al. (2013) Maternal infections during pregnancy and cerebral palsy: a population‐based cohort study. Paediatric and Perinatal Epidemiology, 27(6), 542–552. [DOI] [PMC free article] [PubMed] [Google Scholar]
- Miller, J.E. , Pedersen, L.H. , Sun, Y. & Olsen, J. (2012) Maternal use of cystitis medication and childhood epilepsy in a Danish population‐based cohort. Paediatric and Perinatal Epidemiology, 26(6), 589–595. [DOI] [PubMed] [Google Scholar]
- Missault, S. , Van den Eynde, K. , Vanden Berghe, W. , Fransen, E. , Weeren, A. , Timmermans, J.P. et al. (2014) The risk for behavioural deficits is determined by the maternal immune response to prenatal immune challenge in a neurodevelopmental model. Brain, Behavior, and Immunity, 42, 138–146. [DOI] [PubMed] [Google Scholar]
- Nakayama, K. , Nishimaru, H. , Iizuka, M. , Ozaki, S. & Kudo, N. (1999) Rostrocaudal progression in the development of periodic spontaneous activity in fetal rat spinal motor circuits in vitro. Journal of Neurophysiology, 81(5), 2592–2595. [DOI] [PubMed] [Google Scholar]
- O'Loughlin, E. , Pakan, J.M.P. , Yilmazer‐Hanke, D. & McDermott, K.W. (2017) Acute in utero exposure to lipopolysaccharide induces inflammation in the pre‐ and postnatal brain and alters the glial cytoarchitecture in the developing amygdala. Journal of Neuroinflammation, 14(1), 212. [DOI] [PMC free article] [PubMed] [Google Scholar]
- Oskvig, D.B. , Elkahloun, A.G. , Johnson, K.R. , Phillips, T.M. & Herkenham, M. (2012) Maternal immune activation by LPS selectively alters specific gene expression profiles of interneuron migration and oxidative stress in the fetus without triggering a fetal immune response. Brain, Behavior and Immunity, 4, 623–634. [DOI] [PMC free article] [PubMed] [Google Scholar]
- Pang, Y. , Rodts‐Palenik, S. , Cai, Z. , Bennett, W.A. & Rhodes, P.G. (2005) Suppression of glial activation is involved in the protection of IL‐10 on maternal E. coli induced neonatal white matter injury. Brain Research. Developmental Brain Research, 2, 141–149. [DOI] [PubMed] [Google Scholar]
- Park, H.R. , Harris, S.M. , Boldenow, E. , McEachin, R.C. , Sartor, M. , Chames, M. et al. (2018) Group B Streptococcus activates transcriptomic pathways related to premature birth in human extraplacental membranes in vitro. Biology of Reproduction, 98(3), 396–407. [DOI] [PMC free article] [PubMed] [Google Scholar]
- Patten, A.R. , Fontaine, C.J. & Christie, B.R. (2014) A comparison of the different animal models of fetal alcohol spectrum disorders and their use in studying complex behaviors. Frontiers in Pediatrics, 2, 93. [DOI] [PMC free article] [PubMed] [Google Scholar]
- Rabadan, M.A. , Cayuso, J. , Le Dreau, G. , Cruz, C. , Barzi, M. , Pons, S. et al. (2012) Jagged2 controls the generation of motor neuron and oligodendrocyte progenitors in the ventral spinal cord. Cell Death and Differentiation, 19(2), 209–219. [DOI] [PMC free article] [PubMed] [Google Scholar]
- Riccomagno, M.M. & Kolodkin, A.L. (2015) Sculpting neural circuits by axon and dendrite pruning. Annual Review of Cell and Developmental Biology, 31, 779–805. [DOI] [PMC free article] [PubMed] [Google Scholar]
- Rigato, C. , Buckinx, R. , Le‐Corronc, H. , Rigo, J.M. & Legendre, P. (2011) Pattern of invasion of the embryonic mouse spinal cord by microglial cells at the time of the onset of functional neuronal networks. Glia, 59(4), 675–695. [DOI] [PubMed] [Google Scholar]
- Rousset, C.I. , Chalon, S. , Cantagrel, S. , Bodard, S. , Andres, C. , Gressens, P. et al. (2006) Maternal exposure to LPS induces hypomyelination in the internal capsule and programmed cell death in the deep gray matter in newborn rats. Pediatr Research, 3, 428–433. [DOI] [PubMed] [Google Scholar]
- Rousset, C.I. , Kassem, J. , Aubert, A. , Planchenault, D. , Gressens, P. , Chalon, S. et al. (2013) Maternal exposure to lipopolysaccharide leads to transient motor dysfunction in neonatal rats. Developmental Neurosciences, 2–3, 172–181. [DOI] [PubMed] [Google Scholar]
- Schindelin, J. , Arganda‐Carreras, I. , Frise, E. , Kaynig, V. , Longair, M. , Pietzsch, T. et al. (2012) Fiji: an open‐source platform for biological‐image analysis. Nature Methods, 9(7), 676–682. [DOI] [PMC free article] [PubMed] [Google Scholar]
- Straley, M.E. , Van Oeffelen, W. , Theze, S. , Sullivan, A.M. , O'Mahony, S.M. , Cryan, J.F. et al. (2017) Distinct alterations in motor and reward seeking behavior are dependent on the gestational age of exposure to LPS‐induced maternal immune activation. Brain, Behavior, and Immunity, 63, 21–34. [DOI] [PubMed] [Google Scholar]
- Sun, Y. , Vestergaard, M. , Christensen, J. , Nahmias, A.J. & Olsen, J. (2008) Prenatal exposure to maternal infections and epilepsy in childhood: a population‐based cohort study. Pediatrics, 121(5), e1100‐7. [DOI] [PubMed] [Google Scholar]
- Touahri, Y. , Escalas, N. , Benazeraf, B. , Cochard, P. , Danesin, C. & Soula, C. (2012) Sulfatase 1 promotes the motor neuron‐to‐oligodendrocyte fate switch by activating Shh signaling in Olig2 progenitors of the embryonic ventral spinal cord. The Journal of Neuroscience, 32(50), 18018. [DOI] [PMC free article] [PubMed] [Google Scholar]
- Van den Eynde, K. , Missault, S. , Fransen, E. , Raeymaekers, L. , Willems, R. , Drinkenburg, W. et al. (2014) Hypolocomotive behaviour associated with increased microglia in a prenatal immune activation model with relevance to schizophrenia. Behavioural Brain Research, 258, 179–186. [DOI] [PubMed] [Google Scholar]
- Vasistha, N.A. , Pardo‐Navarro, M. , Gasthaus, J. , Weijers, D. , Müller, M.K. , García‐González, D. et al. (2020) Maternal inflammation has a profound effect on cortical interneuron development in a stage and subtype‐specific manner. Molecular Psychiatry, 25(10), 2313–2329. [DOI] [PMC free article] [PubMed] [Google Scholar]
- Wu, C.S. , Pedersen, L.H. , Miller, J.E. , Sun, Y. , Streja, E. , Uldall, P. et al. (2013) Risk of cerebral palsy and childhood epilepsy related to infections before or during pregnancy. PLoS One, 2, e57552. [DOI] [PMC free article] [PubMed] [Google Scholar]
- Zerbo, O. , Qian, Y. , Yoshida, C. , Grether, J.K. , Van de Water, J. & Croen, L.A. (2013) Maternal infection during pregnancy and autism spectrum disorders. Journal of Autism and Developmental Disorders, 45, 4015–4025. [DOI] [PMC free article] [PubMed] [Google Scholar]
- Zhu, F. , Zheng, Y. , Liu, Y. , Zhang, X. & Zhao, J. (2014) Minocycline alleviates behavioral deficits and inhibits microglial activation in the offspring of pregnant mice after administration of polyriboinosinic‐polyribocytidilic acid. Psychiatry Research, 219(3), 680–686. [DOI] [PubMed] [Google Scholar]
Associated Data
This section collects any data citations, data availability statements, or supplementary materials included in this article.
Data Availability Statement
All data generated during this study are available on reasonable request from the corresponding author.