Abstract
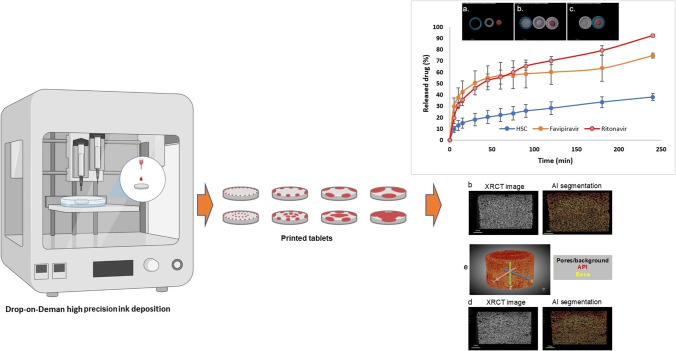
3D printed drug delivery systems have gained tremendous attention in pharmaceutical research due to their inherent benefits over conventional systems, such as provisions for customized design and personalized dosing. The present study demonstrates a novel approach of drop-on-demand (DoD) droplet deposition to dispense drug solutions precisely on binder jetting-based 3D printed multi-compartment tablets containing 3 model anti-viral drugs (hydroxychloroquine sulfate - HCS, ritonavir and favipiravir). The printing pressure affected the printing quality whereas the printing speed and infill density significantly impacted the volume dispersed on the tablets. Additionally, the DoD parameters such as nozzle valve open time and cycle time affected both dispersing volume and the uniformity of the tablets. The solid-state characterization, including DSC, XRD, and PLM, revealed that all drugs remained in their crystalline forms. Advanced surface analysis conducted by microCT imaging as well as Artificial Intelligence (AI)/Deep Learning (DL) model validation showed a homogenous drug distribution in the printed tablets even at ultra-low doses. For a four-hour in vitro drug release study, the drug loaded in the outer layer was released over 90%, and the drug incorporated in the middle layer was released over 70%. In contrast, drug encapsulated in the core was only released about 40%, indicating that outer and middle layers were suitable for immediate release while the core could be applied for delayed release. Overall, this study demonstrates a great potential for tailoring drug release rates from a customized modular dosage form and developing personalized drug delivery systems coupling different 3D printing techniques.
Graphical Abstract
Supplementary Information
The online version contains supplementary material available at 10.1007/s11095-022-03378-9.
Keywords: 3D printing, artificial intelligence (AI), binder jetting, deep learning (DL), drop-on-demand, machine learning (ML), MicroCT, modular dosage forms
Introduction
Three-dimensional (3D) printing technology has been applied in manufacturing pharmaceutical products with innovative 3D structures to achieve ideal functions since the 1990s, such as manipulating the drug release profile, printing multiple drugs into one tablet, and enabling personalized precise drug delivery [1–3]. In recent decades, various 3D printing techniques have been applied in pharmaceutics. For instance, fused deposit modeling, semi-solid extrusion, inkjet printing, selective laser sintering, stereolithography, and powder-based binder jet 3D printing [4–19]. In 2015, U.S. Food and Drug Administration (FDA) approved the first commercial 3D printed tablet, Spritam®, which was manufactured by Aprecia [20]. Spritam® has applied powder-based binder jetting technology into product manufacturing, which is considered a milestone in 3D printing technology-assisted pharmaceutical product development. [21] Binder jetting (BJ) is one of the most widely used additive manufacturing techniques. The powders are evenly spread on the supporting bed with a roller and liquid binder is deposited on the specific area as designed on the surface of the powder layer-by-layer repeatedly. The binder functions as an adhesive that holds the loose particles and forms a 3D construct. Various studies have employed BJ to print drug-loaded tablets using a mixture of active pharmaceutical ingredients (APIs) and liquid binders or powders. [2, 3, 22–26]. However, most BJ printers are designed for mass production, which is unsuitable for small-scale dose tailoring for individualized drug delivery. To solve this problem, a three-in-one concentrical tablet model with three compartments (outer shell, mid-layer, core) was applied, enabling loading multiple drugs. In the present study, we designed a novel precise droplet deposition i.e., an electro-magnetic droplet deposition based on a drop-on-demand (DoD) concept on BJ printed muscular concentric cylinder tablets. The DoD printing technology was designed for dispensing solutions with a broad range of viscosities with high precision. The change in the magnetic field drives electrodes to trigger the printing process. When a magnetic field is applied, the magnetic valve on the nozzle opens for extruding inks out by pressure, and when the magnetic field is disappeared, the magnetic valve closes [27]. In this case, each module of 3D printed tablets could load with different drug solutions and be assembled after the solutions dried. Moreover, the dose of the drug loaded could be tailored by changing the printing area, the number of layers, cycle time, infill density, and nozzle travel speed. Therefore, a tablet is produced with the personalized formulation and precise dose.
Artificial intelligence (AI) and machine learning (ML) have gained considerable research attention in pharmaceutical science over the past decade, particularly in drug design and discovery, preformulation, and formulation [28]. The powerful ML platform could be applied to predict the physicochemical properties and in vivo performance of different types of pharmaceutical formulations such as tablets, capsules, injections, etc. For an example, Yang et al. employed different ML models to predict the disintegration time and cumulative dissolution profile of two types of pharmaceutical dosage forms, oral sustained release tablets and oral fast disintegrating films [29]. Moreover, with the discovery of a new drug, the ML platform could accurately predict the most suitable drug/excipient composition and the best dosage form. For instance, for the new drug against SARS-CoV-2, advanced ML models are expected to predict the best excipient types and the most suitable formulations to maximize therapeutic efficacy, which can significantly accelerate the drug development for COVID-19 treatment. With such remarkable advances, AI-based modeling techniques provide a great opportunity to predict successful pharmaceutical formulations, save on experimental costs, accelerate formulation development, and push the boundaries of digital pharmaceutical science. In this study, we applied AI and ML concepts to determine drug distribution in the printed tablets. A similar study was conducted earlier where ML was successfully implemented to study the distribution of drugs on hot-melt extruded formulations [30].
There are four primary aims for this investigation: 1) design and print the modulated tablets via BJ; 2) comprehensively understand the DoD process by printing on fixed-size cylindrical tablets; 3) investigate the effects of valve open and print cycle time of the DoD printing process; 4) design and print with DoD mode on the surface of the modular tablet compartments containing 3 model anti-viral drugs (hydroxychloroquine sulphate - HCS, ritonavir and favipiravir). In detail, solid and concentric cylinder tablets were designed and printed with the dimension of 12x12x4 mm (d1 = 4, d2 = 8, d3 = 12 mm). The reactive orange 16 solution was applied as a dye to study the dispersion efficiency and accuracy of the DoD deposition. In addition, the printing pressure (changed from 5 to 20 kPa), open time (1–20 ms), cycle time (50–1000 ms), print speed (1–10 mm/s), infill density (20–30%) were tested to identify the volume dispensed on each tablet. To date, our study demonstrated that dispersing drug solutions on the surface of the modular tablet is feasible for loading various drugs, including proteins, within different compartments and tailoring the dose for personalized drug delivery.
Materials and Method
Materials
The carrier matrices for BJ printing were purchased from CAD BLU (Grand Junction, CO, USA). Core materials contain 80–100% calcium sulfate hemihydrate, and the binding liquid contains 0–1% 2-pyrrolidone and 90–100% non-hazardous ingredients [31–33]. Reactive Orange 16 was bought from Sigma-Aldrich. Plastic syringe barrels (3 cc), pistons and connectors were purchased from Optimum® Nordson EFD Corporation LLC (Plano, TX, USA). Ritonavir and Favipiravir were obtained from Hangzhou Longshine Biotech Co., Ltd. (Hangzhou, Zhejiang province, China). Hydroxychloroquine sulfate was acquired from Tokyo Chemical Industry (Portland, OR, USA). The food coloring set was from Ktdorns (Shenzhen Sichuang Yi Technology Co., Ltd.). The ingredients in the coloring agents are water, sodium carboxymethylcellulose, sorbitol, propylene glycol, and glycerin. The colors used are sunset red (E110, E124), grape violet (E123, E133) and royal blue (E110, E123, E133). Ethanol 200 Proof was provided by Lab Alley (Spicewood, TX, USA). Acetonitrile (HPLC grade, 99.7% +) was supplied by Thermo Scientific ™ (Waltham, MA, USA).
Preparations of Drug-Loaded Tablets
3D Printing Solid and Concentrical Cylinder Tablets
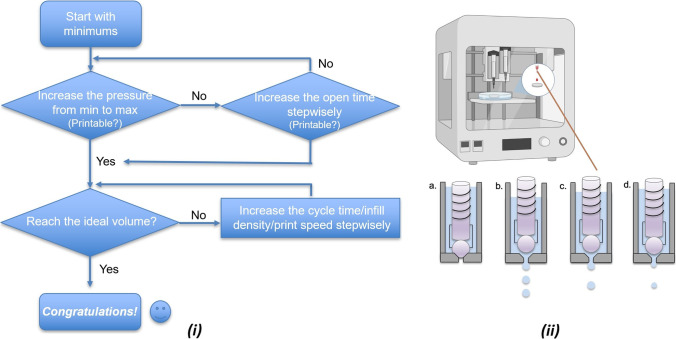
The solid (12 mm × 12 mm × 4 mm) and concentric cylindrical tablets (dout = 12 mm, dmid = 8 mm, dcore = 4 mm, height = 4 mm) were printed using ProJet®360 printer (3D Systems, Rock Hill, SC, USA) equipped with HP 11 printhead. The printing build height is 4.0 mm, layer thickness is 0.1016 mm and in total has 39 layers. The volume of a tablet (all three parts) is 0.615 cm3, surface area is 10.99 square centimeters, and the surface to volume ratio is 45.37. The estimated binder usage per tablet is 2.7 ml. The printing and overnight drying process were conducted at room temperature with shield covered. The 3D models were designed using 3D builder software, saved as. STL file and then converted to. ZBD file using the 3DPrint software (3D Systems, Rock Hill, SC, USA). Overall, Fig. 1i representing a decision flow chart for selecting print parameters was utilized to include the key printing parameters and variables and how they affect the decision making of BJ printing of the tablets reported herein.
Fig. 1.
(i) Decision flow chart for selecting print parameters.; (ii) Schematic diagram of the working principle of the DoD droplet deposition printing technology. Before printing, the system is closed (a); after printing, the valve is opened (b, c, d) and the pressurized fluid can flow. Open time and cycle time determine how long and how often the valve opens, changing the droplet size and frequency of droplet discharge. For example, if only the cycle time is reduced, the frequency of droplet discharge decreases while the droplet size remains the same (b, c). If the open time is reduced while the cycle time remains the same, it will only reduce the droplet size (c, d). [Figure adapted from manufacturer’s respective Printhead User Manual Page 44].
DoD Printing on Blank Tablets
An azo dye, reactive orange 16 (RO16), is used as the ink for better observation. In detail, 1–3 ml RO16 (1 mg/ml in deionized water) was aspirated by a plastic syringe and then loaded into a three cc Optimum® syringe barrel via a plastic syringe connector. First, the syringe barrel was assembled with a syringe adapter and the electro-magnetic DoD droplet deposition printhead was attached to a bench top 3D printer (BioX, Cellink, San Carlos, California) and the adapter was connected to the pressure control system in the printer. The 12 mm ×12 mm × 4 mm solid tablets were used to test printing conditions. The printing pressure (5–20 kPa), open time (1–20 ms), cycle time (50–1000 ms), print speed (1–10 mm/s), and infill density (20–30%) has been adjusted to explore suitable conditions for printing. A conceptual image of this DoD droplet deposition technique is depicted in Fig. 1ii.
DoD Printing on Modulated Tablets
To optimize the tablets’ printable surface area, the dimensions have been modified to dout = 14 mm, dmid = 10 mm, dcore = 6 mm, height = 4 mm). 100 mg Hydroxychloroquine sulfate (HCS) was dissolved in 10 ml of deionized water, followed by adding five drops of sunset red. 120 mg favipiravir and 80 mg ritonavir were dissolved in 10 ml of ethanol and marked with grape violet and royal blue, respectively. The red HCS solution was applied to the core using a designed g-code file (6 mm × 6 mm × 0.5 mm, cylinder). The violet favipiravir was applied on the middle layer (10 mm ×10 mm × 0.5 mm – 6 mm × 6 mm × 0.5 mm hollow cylinder). Moreover, the blue ritonavir was applied on the out layer (14 mm × 14 mm × 0.5 mm −10 mm ×10 mm × 0.5 mm hollow cylinder).
Characterizations
Solid-State Characterizations
The solid-state of raw materials was investigated via PXRD using the Rigaku MiniFlexII instrument (Rigaku Corporation, Tokyo, Japan). All the samples were scanned from 5 to 45° 2θ with a scan speed of 2°/min, the scan speed of 2°/min, and a scan step of 0.02° (45 V, 15 mA). The data were collected and viewed using MDI Jared 9 software. Then, the data were exported as .txt files and plotted as 2θ scale versus intensity using Jupiter Notebook.
About 3 mg of raw material samples were placed in T-zero aluminum differential scanning calorimetry (DSC) pans and evaluated by DSC Q20 (TA® instruments, New Castle, DE, USA). The samples were ramped from 20 to 200–260°C at a 3°C/min rate. In all DSC experiments, ultra-purified nitrogen was purged at a 50 mL/min flow rate. Data were collected and transferred to TA® instruments Universal Analysis 2000 software, then exported as .txt files and plotted using Jupiter Notebook.
The crystallinity of raw materials was observed using an Olympus BX53 polarized photomicroscope (Olympus America Inc., Webster, TX, USA) at room temperature. QICAM Fast 1394 digital camera (QImaging, Tucson, AZ, USA) and Linksys 32 software® (Linkam sci ins Ltd., Tadworth, UK) were applied to capture the images.
The 3D-printed tablets were analyzed by A Zeiss MicroCT scanner (Oberkochen, Germany) at the University of Texas at Austin (Austin). Each dataset of tablet consists of 1282 slices with a voxel size of 3.5 μm. All samples were scanned using the following parameters: Flat panel, 60 kV, 6.5 W, 0.1 s acquisition time, 5 samples per view, detector 210.18 mm, source −10.3 mm, XYZ [−123, −2854, 575], camera bin 1, angle ±180, 3001 views, no filter, dithering, and multi reference. All images were reconstructed by Xradia reconstructor (Zeiss, Oberkochen, Germany) with parameters of center shift of −3.618, beam hardening of 0.4, theta of 0, byte scaling of [−0.002, 0.02], binning of 1, and recon filter smooth (kernel size = 0.7). Reconstructed images were saved at TIFF files. DragonFly 4.1 software by Object Research Systems Inc. (Quebec, Canada) was used for artificial intelligence (AI)-based image segmentation and visualization [34].
Optical Microscopy Images
The general morphology of BJ printed tablets and EMD printed compartments were captured by Dino-Lite™ using Dino Capture software (magnification: 6.3x).
Scanning Electron Microscope (SEM) Images and Energy-Dispersive X-Ray (EDX) Spectroscopy
The drug distribution on the tablet surface was characterized by Quanta FEG 650 ESEM (FEI company, Hillsboro, OR, USA). Before observation, the blank and drug-loaded samples were coated with conductive material by EMS Sputter Coater under vacuum (Hatfield, PA, USA). The images were taken under 200x magnification, and 10 kV accelerated voltage. The element analysis was carried out with the embedded EDX spectroscopy and analyzed by Esprit 2.1 software.
Drug Loading
The weight of tablets before printing and after drying was taken by Sartorius Cubis® microanalytical balances (accurate to 0.001 mg). Drug amount was determined by drug concentration and dispersion volume (1). The dispersion volume could be learned by direct collection or calculation based on flow rate and printing time (2) and (3). Drug loading is the percentage of drug amount to total tablet weight ratio (4).
| 1 |
| 2 |
| 3 |
| 4 |
Then, UV and HPLC methods were used to detect drug content. A determined mass of the drug coated tablet was thoroughly dissolved in 10 mL 1 N HCl for each drug individually. Samples were analyzed by a Tecan Infinite M200 Plate Reader UV-Visible to detect their absorbance at 326 nm, 344 nm and 250 nm to determine concentration and thereby mass of favipiravir, hydroxychloroquine sulfate and ritonavir, respectively. For Drug loading was calculated using the following Eq. (5).
| 5 |
All the drug coated tablet was thoroughly dissolved in 50 mL mobile phase of each drug individually. The samples were then filtered by a 0.2 um filter and diluted to twice the original volume. The HPLC methods for all three drugs were separately developed using a Vanquish UHPLC (Thermo Scientific, West Palm Beach, FL, USA) with a C18 column. The mobile phase of hydroxychloroquine sulfate is methanol: acetonitrile = 90:10 (v/v), flow at 0.8 ml/min and the samples were detected at wavelength 220 nm. For favipiravir and ritonavir, the mobile phase is acetonitrile: deionized water (pH 2.2) adjusted with phosphoric acid = 30:70 (v/v) and 70:30 (v/v), respectively. The flow rate is 1 ml/min and the wavelength is 323 nm (favipiravir) and 215 nm (ritonavir). The drug loading was calculated using the same equation as UV method (5).
In Vitro Drug Release Study
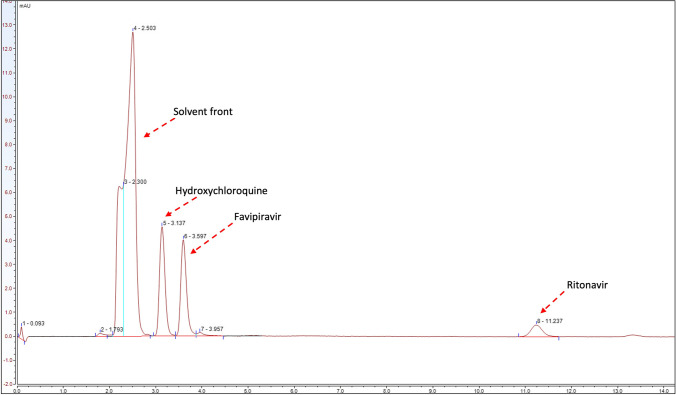
The in vitro drug release study of the assembled DoD printed BJ tablets followed the guidance of USP type II apparatus using the Varian VK 7000 dissolution system (Varian, Inc., Cary, NC, USA). Tablets were dissolved in 100 ml simulated intestinal fluid (standard phosphate buffer solution, PBS, at pH 6.8) in 150 mL vessels. The temperature of the dissolution medium was set at 37 ± 0.5°C, and the paddle speed was set at 100 RPM. Samples were taken automatically at 5, 15, 30, 45, 60, 75, 120, 180 and 240 mins to determine the amount of released drug. Then, the samples were loaded into a Vanquish UHPLC (Thermo Scientific, West Palm Beach, FL, USA), flushed with 1 ml/min acetonitrile/deionized water (50/50, v/v, pH = 2.1) in the reversed-phase C18 column. The data was measured at 227 nm wavelength and analyzed using Chromeleon 7 software. This new HPLC method was able to separate and detect three drugs at once with retention times of 3.1, 3.6 and 8.1 min for hydroxychloroquine, favipiravir and ritonavir, respectively as seen in Fig. 2. The standard curves were developed at concentrations of 5, 25, 50, 75, and 100 μg/ml using serial dilution.
Fig. 2.
Representation of retention time of hydroxychloroquine, favipiravir and ritonavir at 3.1, 3.6 and 8.1 min, respectively.
Result and Discussion
Printability Test of DoD Printing Process
To find suitable printing conditions for further studies, various parameters were optimized to accomplish successful printing. Print design, printing pressure, and valve open time were changed while the infill density, print speed, and cycle time remained constant (Table I). In Table I, for tests 1 and 2, the total volume of the solution was so large that the tablet’s surface was partially dissolved. When the surface tension was not strong enough to hold the liquid, it spilled, and the bottom of the tablet was soaked in the solution. When the pill was dried for 2 hours, it was stuck to the petri dish, which could hardly be removed. (Fig. 3i). For tests 4–7 and 9, the released droplets accumulated at the bottom of the printhead and formed large droplets due to insufficient pressure. Tests 5,8,9 have the same printing conditions, however, the results were inconsistent. Thus, the printing pressure of 5 kPa is too low for standardized printing. Increasing the printing pressure to 10 kPa enables smooth printing. When the diameter of the printing area matched or was close to the tablet design, the droplets would splash to unexpected places on the Petri dish instead of the tablet surface due to inertia. The optimized printing conditions (No.10) could print about 150 μl ink solution.
Table I.
Drop-on-Demand (DoD) Printing Condition Test on BJ Printed Solid Tablets
| No | Print design (mm x mm x mm) | Open time (ms) | Cycle time (ms) | Pressure (kPa) | Printability/Description |
|---|---|---|---|---|---|
| 1 | 10x10x2 | 10 | 100 | 20 | overflow |
| 2 | 10x10x2 | 10 | 100 | 5 | overflow |
| 3 | 10x10x0.5 | 5 | 100 | 5 | printable |
| 4 | 10x10x0.5 | 1 | 100 | 5 | poor printability |
| 5 | 10x10x0.5 | 2 | 100 | 5 | poor printability |
| 6 | 10x10x0.5 | 3 | 100 | 5 | poor printability |
| 7 | 10x10x0.5 | 5 | 100 | 5 | poor printability |
| 8 | 10x10x0.5 | 2 | 100 | 5 | printable |
| 9 | 10x10x0.5 | 2 | 100 | 5 | poor printability |
| 10 | 10x10x0.5 | 2 | 100 | 10 | printable |
| 11 | 10x10x0.5 | 2 | 100 | 10 | printable |
| 12 | 12x12x0.5 | 2 | 100 | 10 | printable |
Infill density, print speed and cycle time remain the same as the default setting (25%, 10 mm/s, and 100 ms)
Fig. 3.
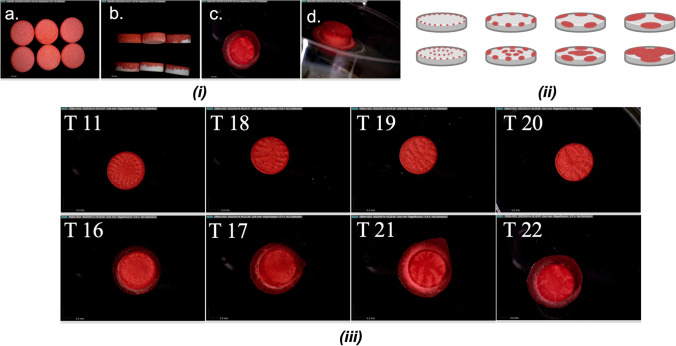
(i) Optical microscope image of the tablets with different amounts of liquid printed on the surface. If the volume of printed liquid exceeds the upper limit of the tablet, after drying, the overflowed liquid will stick to the tablets to the petri dish, making it hard to be collected; (ii) A. Schematic illustration of DOD printing when the cycle time is increased with open time at the same ratio, and (iii) Images of tests 11 and 16–22 taken by Dino-Lite.
Since the printing condition of test 11 could generate a reproducible smooth printing, we would like to investigate how printing parameters affect the dispensing volume (DV). Changing the print design will directly affect the printing surface area and the DV (Table II, Test 11–14). Ideally, the printing surface area was expected to be as large as possible to get a high DV, however, splash of droplets was observed in our previous printing (Test 12) when the printing was close to the tablet’s edge. Therefore, the print settings of test 11 were selected as the default printing parameters for further studies. It is all known that increasing the infill density would lead to higher DV without causing any overflow. Based on the experience from test 11, adjusting the infill density from 25% to 30% led to a flood. In terms of the printing speed, the total printing time was extended when a lower printing speed was applied, so more valve-open and -close cycles would increase DV. In this study, even though the printing speed was changed from 10 mm/s to 9 mm/s, overflow printing still occurred. Besides printing design, infill density, and printing speed, printing pressure is another vital parameter in droplet-based printing. According to the previous attempts, pressure lower than 5 kPa could not provide sufficient force to dispense the ink solution, whereas printing pressure at 10 kPa was suitable for printing. Therefore, higher printing pressure has been tested to see if it would carry out different results. Interestingly, when a pressure of 20 kPa was applied, the print showed overflow. This phenomenon was due to the increased velocity and momentum of each droplet given by the increased pressure, disrupting and breaking the surface tension of the liquid on the tablet surface. Therefore, a moderate printing pressure would be maintained in the following printing.
Table II.
Study on How DoD-Specific Printing Parameters Affect the Printing Results
| No | Print design (mm x mm x mm) |
Open time (ms) |
Cycle time (ms) |
Pressure (kPa) |
Printability/ Description |
Volume* (μl) |
|---|---|---|---|---|---|---|
| 11 | 10x10x0.5 | 2 | 100 | 10 | printable | 150 |
| 12 | 12x12x0.5 | 2 | 100 | 10 | printable | 217 |
| 13 | 6x6x0.5 | 2 | 100 | 10 | printable | 44 |
| 14 | 4x4x0.5 | 2 | 100 | 10 | printable | 26 |
| 15 | 10x10x0.5 | 2 | 100 | 20 | printable | 150 |
| 16 | 10x10x0.5 | 2 | 50 | 10 | overflow | – |
| 17 | 10x10x0.5 | 3 | 100 | 10 | overflow | – |
| 18 | 10x10x0.5 | 3 | 150 | 10 | printable | 150 |
| 19 | 10x10x0.5 | 4 | 200 | 10 | printable | 150 |
| 20 | 10x10x0.5 | 5 | 250 | 10 | printable | 150 |
| 21 | 10x10x0.5 | 10 | 500 | 10 | overflow | – |
| 22 | 10x10x0.5 | 20 | 1000 | 10 | overflow | – |
*Each print’s dispersing volume (DV) was collected and measured with a micropipette. The printing 3D model. stl file has been changed to the exact shape with more considerable height
Then, we moved on to understand how DoD-specific printing parameters, namely, open time and cycle time, would affect the DV, and have carried out eight more testing (Table II). The open time affected how large one droplet could be and the cycle time determined how often the droplets would be generated. As expected, either decreasing the cycle time or increasing the open time led to overflow printing results (Fig. 3ii B, T16, T17 vs. T11). Interestingly, if the open time and cycle time were changed at the same ratio, the DV maintained the same (Table II, T11 and T18–22). However, as the open time kept increasing, the momentum increased together with the mass of the droplet. It would disturb the surface liquid on the tablet, leading to overflow printing eventually. Additionally, as the cycle time and open time were longer, the distribution pattern would change and reduce the uniformity of the dispersion (Fig. 3ii).
Process Optimization
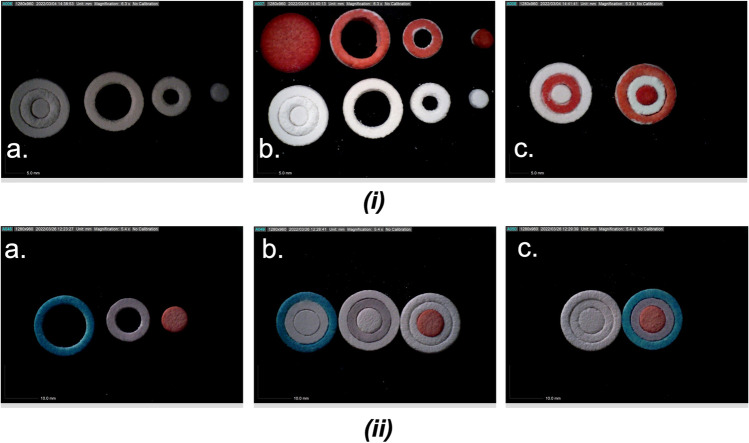
As printing under 10 kPa with 2 ms open time enabled smooth printing, we moved on to printing more complex structures using DoD. For example, the BJ printed concentrical cylinder consists of three parts - outer ring (dout = 12 mm), middle ring (dmid = 8 mm), and core (d = 4 mm). As shown in Fig. 4i, the RO16 solution could be applied to the surface of the separate tablet compartments precisely using DoD printing. The printed file has the same diameter as the 3D model printed by BJ, and the model thickness is set to 0.5 mm to avoid overflow during DoD printing. Printing pattern of concentric infill was applied to print on these compartments. During the printing process, it was found that although the DoD printing of the middle and outer rings worked well, it was difficult to calibrate the center position of the core due to the small diameter. Thus, the BJ printed concentrical cylinder was adjusted to - outer ring (dout = 14 mm), middle ring (dmid = 10 mm), and core (d = 6 mm). The opening time was 2 ms and the pressure was 10 kPa, producing small droplets while being able to discharge drop by drop. The cycle time, infill density and print speed were set to be default – 100 ms, 25%, and 10 mm/s, respectively, to avoid overflow.
Fig. 4.
(i) Optical microscope image of the assembled modulated tablet with each compartment (a), Outer layer (dout = 12 mm), middle layer (dmid = 8 mm) and core (dcore = 4 mm) of the concentric cylinder (height = 4 mm). (b), Electro-magnetic droplet printing of reactive orange 16 (1 mg/ml) on solid tablet (up left) and each compartment. EMD printing parameters: print design (same shape as the BJ design, height = 0.5 mm), infill pattern (concentric), infill density (25% as default), pressure (5 kPa), open time (2 ms), cycle time (100 ms), printing speed (10 mm/s as default). (c), EMD-printed tablet compartments assembled with the blank compartments; (ii) Images of drug-loaded tablet compartments and assembled tablets taken by optical microscope. (a), out layer: blue ritonavir; middle layer: violet favipiravir; core: red HCS. (b), single compartment assembled with blank tablet compartments to visualize the color change. (c), assembled blank tablets versus drug-loaded tablets.
3D Printed Drug-Loaded Tablet Compartments and DoD Drug Dispersion
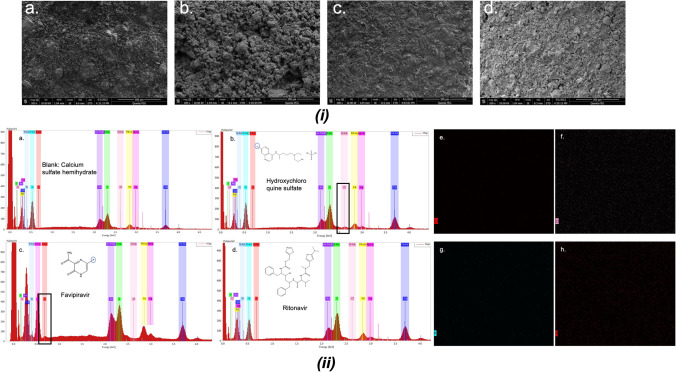
The drug-loaded tablet compartments were printed with the prepared colored drug-concentrated solutions separately. The images of the tablets were taken by Dino-Lite™ (Fig. 4ii). SEM examined the surface morphology of the pills. Figure 5i b., c., d. showed that all three printed tablets have a different morphology than the blank tablet, indicating the successful dispersion of drug solution on the surface of the modular tablets. In terms of tablet surface, as depicted in Fig. 3i, compared to a., panel b. seems to have a rougher surface whereas c. and d. have a smoother surface based on the visual observation. This could be since the drug solution dispersed on the tablet b is water-based and that of tablet c and d are ethanol-based. This phenomenon can be attributed to the solvent evaporation rate since water will take longer to evaporate compared to that of organic solvent like ethanol and freely get absorbed in the tablet making the surface rough. Nonetheless, all four images exhibited porous structure of the tablet compartments owing to the binder jetting power deposition layer-by-layer.
Fig. 5.
(i) Scanning electron microscope (SEM) images of the printed a., calcium sulfate hemihydrate (blank); b., hydroxychloroquine sulfate; c., favipiravir; d., ritonavir tablets; (ii) Energy-dispersive x-ray (EDX) spectroscopy and element analysis chart. a., calcium sulfate hemihydrate (blank); b., hydroxychloroquine sulfate; c., favipiravir; d., ritonavir tablets. Element Au, Pd and Ag were from vacuum sputtering. Element distribution images: Cl surface distribution of blank (e) and hydroxychloroquine sulfate (f); F surface distribution of blank (g) and favipiravir (h).
Due to the precision of the dispersed drug solution in each compartment of the 3D printed tablets, a homogenous particle distribution was observed on the surface (Fig. 5ii). SEM-EDX was also performed to determine the distribution of marker molecules like CL or Fl on the printed tablets. As expected, the most occupied elements were oxygen and carbon as they are the most abundant elements comprising most of the excipients and additives used in this study. Moreover, the surface elemental analysis of Chlorine (Cl) for HCS and Fluorine (Fl) for favipiravir showed a homogenous distribution. As shown in Fig. 5ii b and c, the HCS has a particular Chlorine peak, whereas the favipiravir sample has a specific Fluorine peak. The Cl and Fl peaks are less noticeable than other elements due to the low drug amount dispersed on the surface. However, the element distribution could be observed in Fig. 5ii e-h where there’s clear differences in the elemental analysis maps of CL/F between blank and drug loaded formulations. For an example, the elemental mapping for Cl in blank tablet exhibited no evidence of elemental presence whereas HCS tablet showed homogenous distribution of the marker atom. However, to provide a better representation of the homogenous distribution of Cl atoms in HCS tablets, a size-optimized figure of the Cl distribution has been provided in supplementary Fig. S1. The gold, silver, and palladium peaks represent the coating material from the vacuum sputtering.
Solid-State Characterization
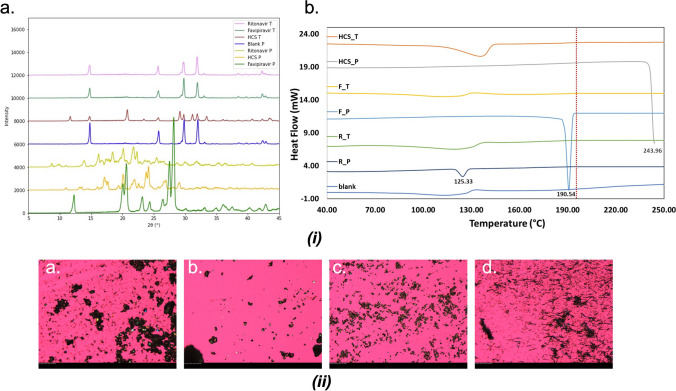
XRD, DSC and PLM were used to test the crystallinity of the raw materials and the tablets. The HCS compartment has the highest drug loading and as a result crystalline peak could be visualized. However, the drug loading of favipiravir and ritonavir is low which is out of the detection limit of the XRD and as a result the characteristic peaks for each crystalline drug were not visible in the diffractograms presented in (Fig. 6i). However, for HCS 3D printed tablets some characteristics peaks corresponding to the crystalline drug were visible which was largely attributed to the higher drug amount used in the formations. For HCS 3D printed tablets characteristics peaks corresponding to the drug were visible at ~12, 21–23, 29 and 32 2-theta positions. Similarly, absence of distinctive thermal transition due to the melting of the crystalline drugs were noticed in the DSC thermograms which was largely due to the lower amount of drug present in the formulations. Nonetheless, the DSC traces of bulk drugs exhibited endothermic thermal transition corresponding to their melting i.e., at ~190.54°C for Favipiravir, ~125.33°C for ritonavir and ~ 243.96°C for HCS. The Fig. 6ii is the PLM images of the raw materials and all of them are in crystalline form. Images of crushed tablets could not be distinguished from the blank sample (calcium sulfate hemihydrate). The calcium sulfate hemihydrate and hydroxychloroquine sulfate are irregular crystals, the favipiravir sample are flat flakes and the ritonavir sample are needle-like crystals. In samples of the crushed tablets, due to the low drug content of the latter two drugs (less than 1% w/w), we could not see the flakes and the needles clearly. They all look like the calcium sulfate hemihydrate sample; thus, we could not distinguish between them.
Fig. 6.
(i) Powder X-ray diffraction (XRD) and differential scanning calorimetry (DSC) profile of raw material powder(P) and drug-loaded tablet grinding (T); (ii) Polarized light microscopy (PLM) images of a., calcium sulfate hemihydrate; b., hydroxychloroquine sulfate; c., favipiravir; d., ritonavir.
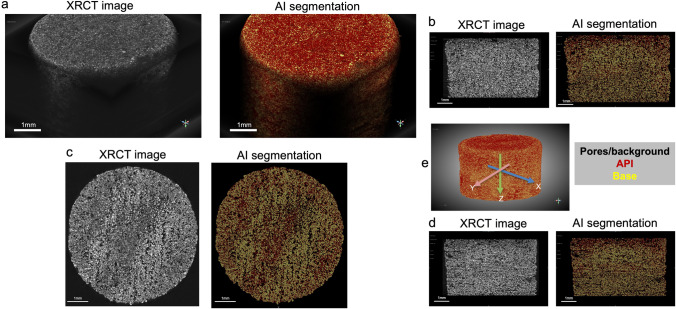
XRCT was performed for the 3D-printed tablets to better understand the morphology and internal microstructure within the tablets. Based on the XRCT images of hydroxychloroquine sulfate tablet, drug displays in dark-gray and calcium sulfate hemihydrate displays in bright gray, which corresponds to their density (1.2 g/cm3 for hydroxychloroquine sulfate, and 2.6–2.7 g/cm3 for calcium sulfate hemihydrate). Chen et al. have demonstrated the grayscale of each component corresponds to their densities [35]. Each voxel in the XRCT images was then classified as red, yellow, and black for hydroxychloroquine sulfate, calcium sulfate hemihydrate, and pores or background, respectively. In this study, a U-Net implemented in Dragonfly software was used as convolutional networks for image classification task [36]. Briefly, six slices of XRCT image (No. 100, 300, 500, 800, and 1000 XRCT images) of hydroxychloroquine sulfate tablet were labelled manually and then were used for the training of the U-Net. 10 times of image augmentation was performed by horizontal and vertical flipping, rotation, scale, and shear. 80% of the dataset was used as training subset and 20% was used as validation subset. Batch size and epoch number of the model were set to 32 and 100, respectively. OrsDiceLoss and OrsDiceCoefficient were used as loss function and metrics, respectively (Fig. S2). After the deep learning-based model training and validation, the U-Net was successfully applied to the remaining 1281 XRCT images for image classification task. In addition, the visualized 3D reconstruction of XRCT images shows hydroxychloroquine sulfate was present thought the whole tablet (Fig. 7e). XZ and YZ cross-section images of the tablet display that relatively more drugs were dispersed in the top of the tablet, which is relevant to the spraying process. XRCT images of favipiravir and ritonavir 3D-printed tablets were shown in Supplementary Fig. S3. However, we couldn’t identify the drug regions within the tablets because of the physical-chemical properties, morphologies, or the relatively low drug loadings of these two drugs, which will be further investigated in future (Fig. 7).
Fig. 7.
3D reconstructions of hydroxychloroquine sulfate 3D printed tablet of original XRCT images: black, pores or background; dark-gray, hydroxychloroquine sulfate; bright-gray, calcium sulfate hemihydrate (Left) and AI segmented images: black, pores or background; red, hydroxychloroquine sulfate; yellow, calcium sulfate hemihydrate (Right). Scale bars: 1 mm. (b) XZ cross-section images of hydroxychloroquine sulfate 3D printed tablet. (c) XY cross-section images of hydroxychloroquine sulfate 3D printed tablet. (d) YZ cross-section images of hydroxychloroquine sulfate 3D printed tablet. (e) Illustration of the 3D AI reconstructed tablets in X, Y, and Z axis.
In Vitro Release Study
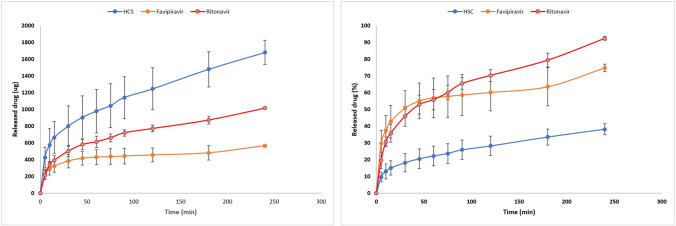
The in vitro drug release performance of the printed tablets was investigated using non-sink dissolution testing. The dissolution study was carried out in triplicates where the R2 values from the standard curve trendline were 0.9977, 0.9992 and 0.9973 for hydroxychloroquine sulfate, favipiravir and ritonavir, respectively. During the dissolution study, it was observed that the tablets completely deformed after 90 min whereas the color faded after 240 min. Figure 8 revealed that the extent of drug released was primarily affected by the initial drug amount. Ritonavir in the outer layer has the highest drug release rate, followed by favipiravir and hydroxychloroquine sulfate. Interestingly, the middle layer loaded with favipiravir has burst release rate initially followed by a slower release pattern.
Fig. 8.
The drug release profiles of modulated tablets within 240 minutes (n = 3).
At the very beginning of dissolution, the tablet absorbs water and expels air from the pores as reflected by the release of air bubbles. Because the surface area of the outer and middle tablets is relatively large, this would make the drug release faster. After 60 min under turbulent impingement with continuous stirring, the tablet outer layer begins to disintegrate, the surface area for drug release increases and so is the actual drug release. The release profile of ritonavir at the 60-min time point showed a stepped release. Similarly, at the 180-min time point, the release profile of Favipiravir showed a step-up. In contrast, the release profile of HCS has been very steady and sustained. But the highest amount release from the core is due to the high dose loaded. From these results, it can be concluded that different release modes could be achieved by loading the drug in different parts of the modular system, such as the outer middle part is suitable for quick release, and the inner part is suitable for slow and sustained release (Table S1). However, the dispersion volume is not the decisive factor for drug loading, because the drug loading can also be changed by adjusting the concentration of the drug solution.
Table III shows the weight of blank tablets, drug-loaded tablets, and calculated weight difference. Here, the weight difference does not represent the loaded drug amount because the drug was dispersed within the solution. It is noticed that not all drug solution was evaporated after drying. Calcium sulfate hemihydrate, a widely used 3D printing material, is practically insoluble in ethanol and slightly soluble in water [38–40]. During the BJ printing, calcium sulfate hemihydrates tend to adsorb water from the liquid binder, get transformed to a semi-solid calcium sulfate dihydrate paste, and forms solid tablet after drying [41, 42]. Thus, in the tablet, some untransformed calcium sulfate hemihydrate, might also absorb some water from the solution during the dispersion and drying process.
Table III.
Tablet Weight Difference Before Printing (Blank) and After Printing and Drying (n = 3)
| Drugs | Blank tablet (mg) | Drug-loaded tablet (mg) | Calculated weight difference (mg) | Weight difference to total weight ratio (%) |
|---|---|---|---|---|
| HCS | 128.286 ± 1.412 | 144.056 ± 2.074 | 15.770 ± 0.698 | 2.1 |
| Favipiravir | 226.080 ± 4.167 | 229.583 ± 3.912 | 3.503 ± 0.261 | 0.21 |
| Ritonavir | 336.376 ± 6.725 | 340.090 ± 6.611 | 3.714 ± 0.145 | 0.15 |
To determine the drug loading various methods were used and validated. Out of all four methods used, the direct dispersion volume method seemed to be the closed one to the theoretical value and hence it was selected. The flow rate was determined by loaded ink volume divided by the time taken for all the ink to run out under the same printing conditions. For example, when the printing pressure is 5 kPa, open time is 2 ms, cycle time is 100 ms, and printing speed is 10 mm/s, it takes 7 minutes for 500 μl ink to finish printing (equivalent to 1.19 μl/s). Then, the dispersion time of each printing mode was recorded, and the total drug amount was calculated accordingly (Table S2). However, this method could involve some operation errors, such as the reaction time for the operator to press the start and stop buttons on the timer. Although this error could be reduced by increasing the number of measurements, it is still considered unprecise.
Other than calculating drug amount by flow rate, there is a method that can measure the dispersion volume directly. The dispersed liquid of each printing mode was collected within an Eppendorf tube and measured with a micropipette. The volume of the micropipette was adjusted to take up all the liquid in the Eppendorf tubes and recorded in Table S3. All the dispersion ink was water solution. Determination of drug mass in each partition of the tablet using UV method was calculated to be 2.05 ± 0.01, 0.58 ± 0.02 and 1.88 ± 0.01 mg for HCS, Favipiravir and Ritonavir, respectively. The final drug content of the assembled tablet was calculated based on the weight of each compartment and the total tablet weight. Favipiravir, ritonavir and HCS content of the tablet were 0.08% (w/w), 0.29% (w/w) and 0.26% (w/w), respectively (Table S4). Three HPLC methods were developed for each drug, and the wavelengths of the most intense absorbance peak were determined by full-wavelength scan. Assessment of drug mass in each compartment using HPLC method was calculated to be 4.852 ± 0.01, 0.397 ± 0.02, and 1.574 ± 0.05 mg for HCS, Favipiravir and Ritonavir respectively. The drug loading of HCS, favipiravir and ritonavir were 0.68 ± 0.01% (/w), 0.055 ± 0.01% (w/w), and 0.22 ± 0.01% (w/w), respectively (Table S5). Among the above methods of testing DL, the method of directly collecting the liquid and measuring the volume is the most accurate as it introduces the least error and directly reflects the drug input.
Conclusion
In this study, modular tablets were 3D-printed using BJ technology. Novel DoD printing has been applied to disperse water/ethanol-based drug solution precisely on the surface of the blank cylinder tablets and the modulated tablet compartments which would be suitable for other drug delivery modalities where ultra-precision and control on the drug amount dispersed is needed such as potent drugs. The dose of tablets was determined by the solubility of each drug and the dispersion volume of the printing. Pressure is the crucial variable that affected the printing quality (10 kPa was recommended). The printing speed and infill density could change the dispersing volume essentially. The open time and cycle time could affect the dispersing volume and the uniformity of the tablets. Advanced surface analysis conducted by microCT imaging as well as Artificial Intelligence (AI)/Deep Learning (DL) model validation revealed a homogenous drug distribution in the printed tablets resulting in from the ultra-precision DoD process. According to the dissolution data, the drug loaded in outer layer would be released over 90% after 4 hours, whereas drug in the core could only be released about 40%. So, the outer and middle layer could be suitable for fast release and the core could be applied for slow release. Our study demonstrated that dispersing drug solutions on the surface of the modular tablet is feasible even at a very low volume and doses, thus opening numerous opportunities for combining multiple therapeutics within different compartments and tailoring the release rates.
Supplementary Information
(PDF 245 kb)
Acknowledgments
The research work reported herein was partly supported by Maniruzzaman’s start-up funds at The University of Texas at Austin, and the Faculty Science and Technology Acquisition and Retention (STARs) Award. The authors and specifically Anqi Lu and Vineet Kulkarni would also like to acknowledge the financial support from CoM3D Ltd., under an existing Sponsored Research Agreement (OSP Nbr: 201901238) with The University of Texas at Austin.
Author Contributions
Conceptualization, Methodology, Data collection, Software, Formal analysis, Writing - original draft, Writing - review & editing, A.L.; Conceptualization, J.Z.; Data collection, J.J., Y.Z., B.G., V.K., N.H.; Writing - review & editing, J.W.; Project administration, Supervision, Funding acquisition, Writing – final review & editing, M.M.
Declarations
Conflict of Interest
The authors declare the following conflicts of interest. The authors are co-inventors of related intellectual property (IP). Maniruzzaman. M., an author of this manuscript, holds stock in, serves on a scientific advisory board for, or is a consultant for CoM3D Ltd. (Surrey, UK) and Septum Solutions LLC (Houston, TX, USA). The terms of this arrangement have been reviewed and approved by the University of Texas at Austin in accordance with its policy on objectivity in research.
Footnotes
Publisher’s Note
Springer Nature remains neutral with regard to jurisdictional claims in published maps and institutional affiliations.
References
- 1.Reddy RDP, Sharma V. Additive manufacturing in drug delivery applications: a review. Int J Pharm. 2020;589:119820. doi: 10.1016/j.ijpharm.2020.119820. [DOI] [PubMed] [Google Scholar]
- 2.Teung P, Rowea CW, Katstrab WE, Palazzolob RD, Giritlioglua B, Cima MJ. Multimechanism oral dosage forms fabricated by three dimensional printing. J Control Release. 2000;66(1):11–17. doi: 10.1016/S0168-3659(99)00225-4. [DOI] [PubMed] [Google Scholar]
- 3.Katstra WE, Palazzolo RD, Rowe CW, Giritlioglu B, Teung P, Cima MJ. Oral dosage forms fabricated by three dimensional printing (TM) J Control Release. 2000;66(1):1–9. doi: 10.1016/S0168-3659(99)00225-4. [DOI] [PubMed] [Google Scholar]
- 4.Khaled SA, Burley JC, Alexander MR, Roberts CJ. Personalised medicine desktop 3D printing of controlled release pharmaceutical bilayer tablets. Int J Pharm. 2014;461:105–111. doi: 10.1016/j.ijpharm.2013.11.021. [DOI] [PubMed] [Google Scholar]
- 5.Tan D, Nokhodchi A, Maniruzzaman M. 3D and 4D printing in biomedical applications. Wiley-VCH Verlag GmbH & Co. KGaA; 2018. 3D and 4D printing technologies: innovative process engineering and smart additive manufacturing; pp. 25–52. [Google Scholar]
- 6.Kjar A, Huang Y. Application of micro-scale 3D printing in pharmaceutics. Pharmaceutics. 2019;11(8). 10.3390/pharmaceutics11080390. [DOI] [PMC free article] [PubMed]
- 7.Khaled SA, Burley JC, Alexander MR, Yang J, Roberts CJ. 3D printing of tablets containing multiple drugs with defined release profiles. Int J Pharm. 2015;494(2):643–650. doi: 10.1016/j.ijpharm.2015.07.067. [DOI] [PubMed] [Google Scholar]
- 8.Goole J, Amighi K. 3D printing in pharmaceutics: a new tool for designing customized drug delivery systems. 10.1016/j.ijpharm.2015.12.071. [DOI] [PubMed]
- 9.Azad MA, Olawuni D, Kimbell G, Badruddoza AZM, Hossain MS, Sultana T. Polymers for extrusion-based 3D printing of pharmaceuticals: a holistic materials–process perspective. Pharmaceutics. 2020;12(2). 10.3390/pharmaceutics12020124. [DOI] [PMC free article] [PubMed]
- 10.Tan YJN, et al. On-demand fully customizable drug tablets via 3D printing technology for personalized medicine. J Control Release. 2020;322:42–52. doi: 10.1016/j.jconrel.2020.02.046. [DOI] [PubMed] [Google Scholar]
- 11.Wallis M, Al-Dulimi Z, Tan DK, Maniruzzaman M, Nokhodchi A. 3D printing for enhanced drug delivery: current state-of-the-art and challenges. Drug Dev Ind Pharm. 2020;46(9):1385–1401. doi: 10.1080/03639045.2020.1801714. [DOI] [PubMed] [Google Scholar]
- 12.Robles-Martinez P, et al. 3D printing of a multi-layered polypill containing six drugs using a novel stereolithographic method. Pharmaceutics. 2019;11(6). 10.3390/pharmaceutics11060274. [DOI] [PMC free article] [PubMed]
- 13.Araújo MRP, Sa-Barreto LL, Gratieri T, Gelfuso GM, Cunha-Filho M. The digital pharmacies era: How 3D printing technology using fused deposition modeling can become a reality. Pharmaceutics. 2019;11(3). 10.3390/pharmaceutics11030128. [DOI] [PMC free article] [PubMed]
- 14.Khaled SA, Burley JC, Alexander MR, Yang J, Roberts CJ. 3D printing of five-in-one dose combination polypill with defined immediate and sustained release profiles. J Control Release. 2015;217:308–314. doi: 10.1016/j.jconrel.2015.09.028. [DOI] [PubMed] [Google Scholar]
- 15.Gorkem Buyukgoz G, Soffer D, Defendre J, Pizzano GM, Davé RN. Exploring tablet design options for tailoring drug release and dose via fused deposition modeling (FDM) 3D printing. Int J Pharm. 2020;591. 10.1016/j.ijpharm.2020.119987. [DOI] [PubMed]
- 16.Zheng Y, et al. Melt extrusion deposition (MED™) 3D printing technology – A paradigm shift in design and development of modified release drug products. Int J Pharm. 2021;602. 10.1016/j.ijpharm.2021.120639. [DOI] [PubMed]
- 17.Goh WJ, Tan SX, Pastorin G, Ho PCL, Hu J, Lim SH. 3D printing of four-in-one oral polypill with multiple release profiles for personalized delivery of caffeine and vitamin B analogues. Int J Pharm. 2021;598(January):120360. doi: 10.1016/j.ijpharm.2021.120360. [DOI] [PubMed] [Google Scholar]
- 18.Zhang J, Lu A, Thakkar R, Zhang Y, Maniruzzaman M. Development and evaluation of amorphous oral thin films using solvent-free processes: comparison between 3D printing and hot-melt extrusion technologies. Pharmaceutics. 2021;13(10):1613. 10.3390/pharmaceutics13101613. [DOI] [PMC free article] [PubMed]
- 19.Thakkar R, Zhang Y, Zhang J, Maniruzzaman M. Synergistic application of twin-screw granulation and selective laser sintering 3D printing for the development of pharmaceutical dosage forms with enhanced dissolution rates and physical properties. Eur J Pharm Biopharm. 2021;163:141–156. doi: 10.1016/j.ejpb.2021.03.016. [DOI] [PubMed] [Google Scholar]
- 20.APRECIA. FDA APPROVES THE FIRST 3D PRINTED DRUG PRODUCT, 2015, [Online]. Available: https://www.aprecia.com/news/fda-approves-the-first-3d-printed-drug-product#:~:text=BLUEASH%2C Ohio%2C August 3, and primary generalized tonic-clonic.
- 21.West TG, Bradbury TJ. 3D printing: a case of ZipDose® technology – world’s first 3D printing platform to obtain FDA approval for a pharmaceutical product. In: Maniruzzaman M, editors. 3D and 4D printing in biomedical applications. 2019. 10.1002/9783527813704.ch3.
- 22.Yanez-Sanchez SI, Lennox MD, Therriault D, Favis BD, Tavares JR. Model approach for binder selection in binder jetting. Ind Eng Chem Res. 2021;60(42):15162–15173. doi: 10.1021/acs.iecr.1c02856. [DOI] [Google Scholar]
- 23.Rahman Z, Charoo NA, Kuttolamadom M, Asadi A, Khan MA. Printing of personalized medication using binder jetting 3D printer. Elsevier Inc.; 2019. [Google Scholar]
- 24.Antic A, Zhang J, Amini N, Morton DAV, Hapgood KP. Screening pharmaceutical excipient powders for use in commercial 3D binder jetting printers. Adv Powder Technol. 2021;32(7):2469–2483. doi: 10.1016/j.apt.2021.05.014. [DOI] [Google Scholar]
- 25.Kozakiewicz-Latała M, et al. Binder jetting 3D printing of challenging medicines: from low dose tablets to hydrophobic molecules. Eur J Pharm Biopharm. 2022;170:144–159. doi: 10.1016/j.ejpb.2021.11.001. [DOI] [PubMed] [Google Scholar]
- 26.Wilts EM, Ma D, Bai Y, Williams CB, Long TE. Comparison of linear and 4-arm star poly (vinyl pyrrolidone) for aqueous binder jetting additive manufacturing of personalized dosage tablets. ACS Appl Mater Interfaces. 2019;11(27):23938–23947. doi: 10.1021/acsami.9b08116. [DOI] [PubMed] [Google Scholar]
- 27.Cellink. Printing cells with the Electromagnetic Droplet Printhead. 2020. https://www.cellink.com/printing-cells-with-the-electromagnetic-droplet-printhead/
- 28.Damiati SA. Digital pharmaceutical sciences. 10.1208/s12249-020-01747-4. [DOI] [PMC free article] [PubMed]
- 29.Yang Y, Ye Z, Su Y, Zhao Q, Li X, Ouyang D. Deep learning for in vitro prediction of pharmaceutical formulations. Acta Pharm Sin B. 2019;9(1):177. doi: 10.1016/J.APSB.2018.09.010. [DOI] [PMC free article] [PubMed] [Google Scholar]
- 30.Munir N, Nugent M, Whitaker D, McAfee M. Machine learning for process monitoring and control of hot-melt extrusion: current state of the art and future directions. Pharmaceutics. 2021;13(9):1432. doi: 10.3390/PHARMACEUTICS13091432. [DOI] [PMC free article] [PubMed] [Google Scholar]
- 31.Chang SY, et al. Binder-jet 3D printing of indomethacin-laden pharmaceutical dosage forms. J Pharm Sci. 2020;109(10):3054–3063. doi: 10.1016/j.xphs.2020.06.027. [DOI] [PubMed] [Google Scholar]
- 32.3D Systems. Safety Data Sheet: VisiJet® PXL Core,” pp. 1–5, 2019, [Online]. Available: https://us.vwr.com/assetsvc/asset/en_US/id/16490607/contents
- 33.3D Systems. Safety Data Sheet: VisiJet PXL Colorة. Material Safety Data Sheet, vol. 4(2), no. 1, pp. 8–10, 2012, [Online]. Available: https://us.vwr.com/assetsvc/asset/en_US/id/16490607/contents
- 34.Dragonfly 2020.2 [Computer software]. Object Research Systems (ORS) Inc, Montreal, Canada, 2020; software available at http://www.theobjects.com/dragonfly
- 35.Chen YC, et al. Development of hot-melt extruded drug/polymer matrices for sustained delivery of meloxicam. J Control Release. 2022;342:189–200. doi: 10.1016/J.JCONREL.2021.12.038. [DOI] [PubMed] [Google Scholar]
- 36.Ronneberger O, Fischer P, Brox T. U-net: convolutional networks for biomedical image segmentation. Lecture Notes in Computer Science (including subseries Lecture Notes in Artificial Intelligence and Lecture Notes in Bioinformatics) 2015;9351:234–241. doi: 10.1007/978-3-319-24574-4_28/COVER/. [DOI] [Google Scholar]
Associated Data
This section collects any data citations, data availability statements, or supplementary materials included in this article.
Supplementary Materials
(PDF 245 kb)


