

Summary
Peritoneal macrophages (PMs) have been shown to have higher stability compared to other macrophage subtypes. However, obtaining enough PMs from a single mouse is often a limitation for metabolomics analysis. Here, we describe a protocol to isolate metabolites from a small number of mouse primary PMs for 13C-stable glucose tracing and metabolomics. Our protocol uses X for metabolite extraction instead of methanol. Our protocol can consistently extract metabolites from low cell number samples with fewer steps than methanol-based approaches.
For complete details on the use and execution of this protocol, please refer to De Jesus et al., (2022).
Subject areas: Cell isolation, Immunology, Metabolism, Metabolomics, Mass spectrometry
Graphical abstract

Highlights
-
•
Streamlined isolation of murine peritoneal macrophages
-
•
Efficient metabolite extraction of limited sample amount
-
•
Detection of carbon-labeled polar metabolites from small sample size
-
•
Protocol applied to mouse primary PMs, but applicable to other cell types
Publisher’s note: Undertaking any experimental protocol requires adherence to local institutional guidelines for laboratory safety and ethics.
Peritoneal macrophages (PMs) have been shown to have higher stability compared to other macrophage subtypes. However, obtaining enough PMs from a single mouse is often a limitation for metabolomics analysis. Here, we describe a protocol to isolate metabolites from a small number of mouse primary PMs for 13C-stable glucose tracing and metabolomics. Our protocol uses X for metabolite extraction instead of methanol. Our protocol can consistently extract metabolites from low cell number samples with fewer steps than methanol-based approaches.
Before you begin
13C glucose tracing and metabolomics are powerful tools to analyze glucose utilization and metabolite levels in biological specimen. For these studies, quantifiable detection of metabolites often requires multiple analytical techniques, which calls for large cell numbers. However, there are many studies in which the availability of cells may be limited. The typical yield of PMs from a single mouse is between 100,000 to 500,000, which may limit metabolite yield for downstream metabolomics analysis. In addition, many metabolomic isolation protocols require a methanol extraction and drying steps that can increase the variability of the final analysis (DeVilbiss et al., 2021). Our protocol provides a streamlined and validated method for extracting metabolites from low cell number samples with less steps than traditional methanol-based extraction methods.
We discovered that when Hexokinase 1 (HK1) is dissociated from the mitochondria it results in a hyper-inflammatory response to LPS (De Jesus et al., 2022). To determine the physiologic function of the HK1 mitochondrial binding domain (MBD), we generated a mouse model lacking the MBD of the endogenous HK1 protein, termed ΔE1HK1. These mice allowed us to study the effect of altering the subcellular localization of hexokinase 1 (HK1) from the mitochondria to the cytoplasm in vivo. In our experiments, we wished to study glycolytic flux in PMs isolated from WT and ΔE1HK1 mice after stimulation with LPS (Pineda-Torra et al., 2015). The protocol we outline here uses primary PMs and includes steps for isolation and culture of these cells. However, the metabolite extraction and metabolomic steps can theoretically be applied to other cell types.
Institutional permissions
This protocol uses mice, and all animal studies need to be done in accordance with Institutional Animal Care and Use Committee (IACUC) guidelines and must be approved by the IACUC before you begin. Our protocol used 8–12 weeks old female & male mice (C57BL/6J) housed in the animal facility room and fed standard chow.
Key resources table
| REAGENT or RESOURCE | SOURCE | IDENTIFIER |
|---|---|---|
| Chemicals, peptides, and recombinant proteins | ||
| Premium plus fetal bovine serum | Thermo Fisher Scientific | Cat#A4766 |
| RPMI 1640 with L-Glutamine | Sigma-Aldrich | Cat#R1383 |
| Penicillin-Streptomycin | Sigma-Aldrich | Cat#P0781 |
| D- (+) Glucose | Sigma-Aldrich | Cat#G8270 |
| Phosphate buffer saline (PBS) | Sigma-Aldrich | Cat#D8537 |
| H2O HPLC grade | Sigma-Aldrich | Cat#270733 |
| Acetonitrile LC-MS grade | Sigma-Aldrich | Cat#1000291000 |
| D-Glucose (1,2-13C2, 99%) | Cambridge Isotope Laboratories | Cat#CLM-504-PK |
| RPMI 1640 Medium, no glucose | Thermo Fisher Scientific | Cat#11879020 |
| Red Blood Cell Lysis Buffer | Abcam | Cat#Ab204733 |
| TLR4 Agonist - Ultrapure LPS from E. coli 055:B5 | InvivoGen | Cat# tlrl-pb5lps |
| Pierce™ BCA Protein Assay Kit | Thermo Fisher Scientific | Cat#23225 |
| Deposited data | ||
| Metabolomics Data | MassIVE | MSV000088899 |
| Experimental models: Organisms/strains | ||
| C57BL/6J (for peritoneal isolation) male & female mice, 8–12 weeks old, wild type | NA | NA |
| Software and algorithms | ||
| MetaboAnalyst 4.0 | (Chong et al., 2019) | https://www.metaboanalyst.ca/ |
| Xcalibur 4.0 software | Thermo Fisher Scientific | |
| Tracefinder 2.1 software | Thermo Fisher Scientific | |
| Other | ||
| Surgical scissors | NA | NA |
| Forceps | NA | NA |
| Hemostat Forceps, flat | NA | NA |
| Cell culture dishes, 24 well | Thermo Fisher Scientific | Cat#142475 |
| Falcon 50 mL Conical Centrifuge Tubes | Fisher Scientific | Cat#352070 |
| Needles, 25G & 27G | Fisher Scientific | Cat#305127 |
| BD Syringe with Luer-Lok Tips (Without Needle), 10 mL | Fisher Scientific | Cat#301029 |
| 70% Ethanol | NA | NA |
| Ice Bucket | NA | NA |
| 1.5 mL Microcentrifuge Tubes | Fisher Scientific | Cat#3448PK |
| Thermo Q-Exactive | Thermo Fisher Scientific | Cat# IQLAAEGAAPFALGMBDK |
| Ultimate3000 series HPLC | Thermo Fisher Scientific | Cat#4832.5000A |
| Xbridge Amide column (4.6 mm × 100 mm and a 3.5 μm particle size) | Waters | Cat#186006595 |
Materials and equipment
PM isolation media
| Reagent | Final concentration | Amount for 500 mL |
|---|---|---|
| FBS | 3% | 15 mL |
| PBS | N/A | To 500 mL |
Complete RPMI media
| Reagent | Final concentration | Amount for 500 mL |
|---|---|---|
| FBS | 10% | 50 mL |
| Penicillin-Streptomycin | 1% | 5 mL |
| RPMI 1640 with L-Glutamine | N/A | To 500 mL |
13C-Glucose RPMI media
| Reagent | Final concentration | Amount for 500 mL |
|---|---|---|
| FBS | 10% | 50 mL |
| Penicillin-Streptomycin | 1% | 5 mL |
| D-Glucose (1,2-13C2, 99%) ∗∗ | 11 mM | N/A |
| RPMI 1640 Medium, no glucose | N/A | To 500 mL |
Step-by-step method details
Isolation and culture of peritoneal macrophages
Timing: 6 h
This step will describe the isolation of mouse peritoneal macrophages using a quick peritoneal lavage method to dislodge the resident macrophages from the peritoneal surface. This section will also detail how to culture the cells and label them with 13C-Glucose for downstream metabolite isolation and metabolomics.
-
1.
Prepare a 10 mL syringe with 5 mL PM isolation media (Store at 4°C for up to 2 weeks) and attach a 27 g needle. Keep on ice.
-
2.
Euthanize the mouse (following an approved IACUC euthanasia protocol).
-
3.
Immediately prior to dissection, place mouse face-up on sterile surface, pin down limbs, and spray abdomen with 70% EtOH. Figure 1
-
4.
Using sterile surgical scissors and forceps carefully cut the skin overlying the peritoneum and gently pull it back to expose the inner skin that lines the peritoneal cavity.
CRITICAL: Do not cut into the peritoneal cavity since any compromise of this space will allow fluid to leak out and reduce final cell recovery. Figure 2.
Note: If you accidentally cut the peritoneum open, you can use a hemostat forceps to close the opening and continue your isolation, however this may result in lower yields.
-
5.
Inject peritoneal cavity with 5 mL of PM isolation media and massage the abdominal walls for 10–25 s to dislodge any attached peritoneal cells into the PM isolation media.
-
6.
Using a new 10 mL syringe equipped with a 25 g needle, draw back up the PM isolation media and collect in 50 mL conical tube on ice. This is the peritoneal lavage and will contain the PMs and other peritoneal cells.
-
7.
To the 50 mL conical tube containing the peritoneal lavage, add PM isolation media up to the 30 mL mark.
-
8.Pellet peritoneal cells & RBC Lysis.
-
a.Centrifuge at 500 g for 10 min to pellet cells.
-
b.Aspirate supernatant. There should be a small rim of white cell pellet at the bottom of the conical tube.
-
c.If the color of the pellet is orange or red in color, this may indicate RBC contamination. Proceed to RBC lysis step.
-
d.Resuspend cell pellet in 1 mL RBC lysis buffer and pipette gently up and down until solution is homogenous.CRITICAL: Avoid creating bubbles or pipetting too harshly.
-
i.Add additional 4 mL RBC lysis buffer and incubate for 5 min on ice.
-
ii.Following 5 min incubation, add PBS to a volume of 40 mL to quench the lysis.CRITICAL: RBC lysis buffer can be toxic to cells if incubated too long. PBS must be added immediately following 5 min incubation period.
-
iii.Centrifuge at 500 g for 10 min to pellet cells and aspirate supernatant.
-
i.
-
a.
-
9.Resuspend and plate PMs
-
a.Resuspend pelleted cells in 1 mL Complete RPMI media (Store at 4°C for up to 2 weeks).
-
b.Split your cells evenly into 3 groups. One group will be for unstimulated PMs, a second group will be for LPS treatment, and the third group will be for protein concentration measurement (normalization well).
-
c.Plate experimental groups (unstimulated and LPS treated) into one 24-well plate, and the normalization well onto a new 24-well plate. This will allow for easier isolation of the normalization well, without disrupting the experimental groups during incubation.Note: Since the peritoneal lavage is a mix of different cells (i.e., B cells, T cells, epithelial cells, and resident macrophages), initial cell counts will not be accurate for plating macrophages. Thus, it is necessary to have an extra well for normalization.
-
d.Incubate cells in standard cell culture incubator for 2 h. Incubator conditions: temperature of 37°C, CO2 concentration ∼5%, and pH ∼7.3–7.5.
-
i.Macrophages will avidly stick to cell culture plates, while other cell types (B and T cells) will not.
-
ii.Figure 4 shows a representative image of PM isolated cells in culture dish.
-
i.
-
a.
-
10.
During the incubation period, prepare 13C-Glucose RPMI media (Store at 4°C for up to 2 weeks) and bring to 37°C in a water bath.
-
11.
Prepare two tubes, one with 13C-Glucose RPMI media and another with LPS (200 ng/mL) in 13C-Glucose RPMI media.
Note: For our specific experiment, we were comparing the metabolic profile of PMs with and without TLR4 stimulation. We split our experimental groups into unstimulated control and LPS treated samples.
-
12.
After 2 h, aspirate the media and gently wash with 0.5 mL of PBS to remove non-adherent cells. The remaining cells will be mostly Macrophages.
-
13.
Add 0.5 mL of 13C-Glucose RPMI media or LPS + 13C-Glucose RPMI media. Incubator conditions: temperature of 37°C, CO2 concentration ∼5%, and pH ∼7.3–7.5.
Note: Depending on the metabolite pool of interest, the incubation period for labeling will vary (Jang et al., 2018). In our experiment we aimed to label glycolytic and TCA cycle intermediates, and found that for PMs, a 4-h incubation period was sufficient to ensure proper labeling of these metabolites.
-
14.During the 4-h 13C-Glucose labeling incubation, measure protein concentration and prepare for metabolite isolation.
-
a.Take the normalization well and measure the total protein concentration; we suggest Pierce BCA Kit. Calculate the total protein per well, which will determine the amount of Metabolite isolation reagent (80% acetonitrile LC-MS grade and 20% H2O HPLC grade, Store at −20ºC for up to 1 month) needed for isolation in subsequent steps.
-
i.Try to dilute your samples to a final concentration of 0.5–1 μg/μL in metabolite isolation reagent. i.e., if your protein concentration is 1.5 μg/μL in 50 μL total volume for your normalization well, then you will want to add 75–150 μL.
-
i.
-
b.Prepare the Metabolite isolation reagent and place in −20°C for at least 2 h before use. Prepare an ice bucket to keep plates cold during metabolite isolation. Label two sets of 1.5 mL microcentrifuge tubes and prechill on ice.
-
a.
-
15.
Move on to metabolite isolation step below.
Figure 1.

Mouse dissection preparation
Figure depicts how to position and pin euthanized mouse to dissection board.
Figure 2.

Peritoneal dissection
Shows how to remove skin while maintaining the underlying peritoneum.
Figure 3.

Steps for peritoneal lavage
(A) Use forceps to gently grasp peritoneum, (B) Lift peritoneum to create a tent, (C) Insert needle filled with lavage fluid into tented area, (D) inject peritoneal lavage fluid.
Figure 4.
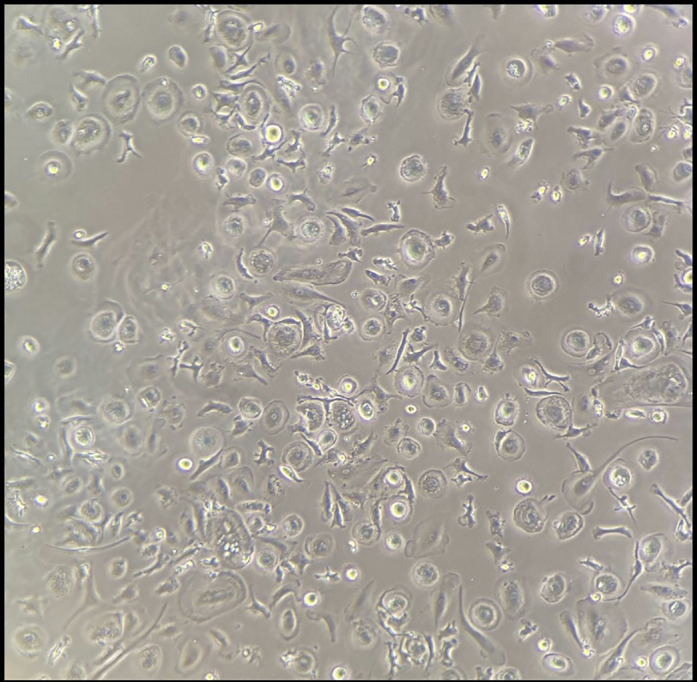
Representative image of expected PM isolation after plating
Metabolite isolation & analysis
These steps will detail how to rapidly and efficiently isolate metabolites using a simple acetonitrile-based metabolite isolation reagent. This step will also detail how to prepare isolated metabolites for analysis using tandem mass-spectrometry.
-
16.
After the 4-h labeling incubation, aspirate the labeling media.
-
17.
Do a quick wash with 0.5 mL of PBS and aspirate the PBS.
Note: Try to remove all remaining media/PBS from the wells before proceeding to isolation step. Excess salt from these buffers will interfere with downstream LC-MS analysis.
-
18.
Place plate(s) on ice and add Metabolite isolation reagent (−20°C) based on normalization well concentration to each sample.
Note: Try to keep all items on ice as much as possible and proceed through these steps as quickly as possible to prevent metabolite degradation.
-
19.
Using the pipette tip, pipette up and down (avoid generating bubbles) and scrape the bottom of the well to dislodge any cells and help with homogenizing the solution.
-
20.
Transfer solution to a prechilled 1.5 mL microcentrifuge tube.
-
21.
Vortex each sample 1x for 15 s and freeze lysates at −80°C for 1h.
Pause point: Conversely, samples can be frozen at -80°C for 16–24 h, if you choose to pause at this point.
-
22.
After 1h, or the next day if incubating 16–24 h, thaw lysates on ice and vortex 15 s.
-
23.
Centrifuge 20,000 g for 30 min at 4°C.
-
24.
Transfer supernatant to new 1.5 mL microcentrifuge tube and place on ice.
Note: Additional freeze thaw cycles (step 21–22) can be done to increase metabolite yield within the same volume of Metabolite isolation reagent.
-
25.Samples are now ready for high-performance liquid chromatography and high-resolution mass spectrometry and tandem mass spectrometry (HPLC-MS/MS) metabolomic measurement.
-
a.The amount added to the LC column is typically 10–15 μL, and the cell number per microliter will depend on the specific yield for each individual well isolated per sample (see step 14a).
-
a.
-
26.Our samples were analyzed using the Northwestern Metabolomics Core.
-
a.The system consists of a Thermo Q-Exactive in line with an electrospray source and an Ultimate3000 (Thermo) series HPLC consisting of a binary pump, degasser, and auto-sampler outfitted with an Xbridge Amide column (Waters; dimensions of 4.6 mm × 100 mm and a 3.5 μm particle size).
-
b.The mobile phase A contained 95% (vol/vol) water, 5% (vol/vol) acetonitrile, 20 mM ammonium hydroxide, 20 mM ammonium acetate, pH = 9.0; B was 100% Acetonitrile.
-
c.The gradient was as following: 0 min, 15% A; 2.5 min, 30% A; 7 min, 43% A; 16 min, 62% A; 16.1–18 min, 75% A; 18–25 min, 15% A with a flow rate of 400 μL/min.
-
d.The capillary of the ESI source was set to 275°C, with sheath gas at 45 arbitrary units, auxiliary gas at 5 arbitrary units and the spray voltage at 4.0 kV.
-
e.In positive/negative polarity switching mode, an m/z scan range from 70 to 850 was chosen and MS1 data was collected at a resolution of 70,000.
-
f.The automatic gain control (AGC) target was set at 1,000,000 and the maximum injection time was 200 ms.
-
g.The dynamic exclusion was set to 10 s and the Apex trigger was set to off
-
h.The top 5 precursor ions were subsequently fragmented, in a data-dependent manner, using the higher energy collisional dissociation (HCD) cell set to 30% normalized collision energy in MS2 at a resolution power of 17,500.
-
i.The sample volumes of 10 μL were injected.
-
j.Data acquisition and analysis were carried out by Xcalibur 4.0 software and Tracefinder 2.1 software, respectively (both from Thermo Fisher Scientific).
-
a.
Expected outcomes
If the isolation, purification, and culture of the PMs were successful, the cells should appear round and attached to the plate (Figure 4). It is possible to utilize any heavy carbon labeled metabolite to assess the flux through most metabolic pathways. For our experiments, we specifically assessed 1,2-13Carbon glucose labeling and fully labeled U-13Carbon glucose to measure glycolytic, TCA cycle and pentose phosphate pathway (PPP) metabolic fluxes (Figure 5).
Figure 5.

Schematic of fully labeled carbon 13C-glucose (A) & 1,2-13C-glucose (B) through glycolysis (upper and lower glycolysis), PPP, de novo nucleotide synthesis and TCA cycle
Limitations
13C-glucose labeling described (De Jesus et al., 2022) show carbon enrichment in pathways of interest (specifically glycolysis and TCA cycle), but do not provide detailed information on in vivo metabolic flux since PMs are labeled outside of their endogenous niche. Although these cells represent a primary immune cell population, they are not reflective of in vivo metabolite flux since the isolation and plating process may causes changes in metabolite fluxes that deviate from endogenous levels. Loss of labile compounds during metabolite extraction and sample preparation for MS analysis is also a limitation that we try to mitigate by rapid isolation of metabolites.
Troubleshooting
Problem 1
Cell contamination with other immune cells (B-cells, T-cells, and RBCs) (PM isolation and culture steps).
Potential solution
Perform surgical procedure in sterile environment with autoclaved surgical instruments. Perform cell work under sterile hood. Make sure to follow wash step after 2-h incubations (step 8) since this will remove contaminating B and T cells from peritoneal lavage.
Problem 2
Low yield of macrophages (PM isolation steps).
Potential solution
Macrophage yield is dependent on mice age and genetic background. Select mouse of minimum age of 8 weeks for PM isolation. Also make sure to thoroughly massage mouse abdomen after PBS injection in order dislodge any attached cells into PBS. For C57BL/6 strain, approximately ∼0.5–1 × 10⁶ macrophages per mouse can be obtained (Zhang et al., 2008).
Problem 3
Low yield of PM adherence after cell culture. This may be due to contamination by RBCs (PM isolation steps). Having RBCs in the isolation step will prevent macrophages from laying down on the cell culture dish.
Potential solution
Make sure to follow RBC lysis step to ensure removal of contaminating RBCs (Step 8).
Problem 4
High variability between samples (step 25).
Potential solution
Our method of extraction helps reduce this to some extent as the removal of the drying step in my hands results in less artifact and more consistent data. However, there can still be large variability in samples. I recommend at least 5 biological replicates per condition to help reduce the standard deviations. If mice are limited, at step 25 you can bank samples up to a month to build up adequate numbers of biological replicates to be run at a future date. The data can also be normalized to the total ion count of the median ion to help normalize the samples. Variability can also be reduced by loading the same number of cells onto the column.
Problem 5
Clogging of UHPLC column (step 25).
Potential solution
Excess protein from the cell extraction can result in poor LC separation and in some cases column clogging. Repeated freeze thaw cycles and a high-speed spin (step 23) are critical for removing protein. If issues with LC separation are experienced additional freeze thaw cycles and additional high-speed spins (20,000 g for 30 min at 4°C) can be added.
Problem 6
Inability to detect a metabolite of interest (step 26).
Potential solution
The ability to detect a metabolite depends not only on the amount of sample input, but also on the solvent that is used for the extraction. Historically, groups have just tried to load more sample, but in our hands changing the extraction protocol/buffer can also be effective. If metabolites of interests are not detected then other solvents can be used for extraction, such as 80% methanol or chloroform based solvents (Villaret-Cazadamont et al., 2020). However, this protocol is effective in resolving most polar metabolites of interest to glycolytic/TCA cycle flux.
Resource availability
Lead contact
Further information and requests for resources and reagents should be directed to and will be fulfilled by the lead contact, Hossein Ardehali (h-ardehali@northwestern.edu).
Materials availability
Reagents available from the lead contact upon request.
Acknowledgments
We would like to thank Chunlei Chen and Yihan Chen for managing our mouse colony and genotyping the mice used in this study. A special thank you to the Northwestern University Metabolomics Core Facility at Robert H. Lurie Comprehensive Cancer Center for performing metabolomics mass spectrometry for our metabolomics experiments. Funding for this work was provided through NRSA 5F31HL132552-04 awarded to A.D. and the Ledcuq Foundation and NHLBI HL127646, HL140973, and HL138982 awarded to H.A.
Author contributions
Experimental design and conceptualization, A.D., S.E.W., C.M.P., P.G., and H.A.; methodology, A.D., C.M.P., and P.G.; resources, S.E.W., P.G., and H.A.; writing—original draft, T.N., H.A., A.D., and C.M.P.; writing—review and editing, T.N., H.A., A.D., and C.M.P.; supervision, S.E.W. and H.A.; funding acquisition, A.D. and H.A.
Declaration of interests
The authors declare no competing interests.
Contributor Information
Samuel E. Weinberg, Email: samuel.weinberg@nm.org.
Hossein Ardehali, Email: h-ardehali@northwestern.edu.
Data and code availability
The accession number for the sample metabolomics data reported in this paper is MassIVE: MSV000088899
References
- Chong Jasmine, Wishart David S., Xia Jianguo. Using MetaboAnalyst 4.0 for Comprehensive and Integrative Metabolomics Data Analysis. Current Protocols in Bioinformatics. 2019;68:e86. doi: 10.1002/cpbi.86. 1934-340X, In press. [DOI] [PubMed] [Google Scholar]
- De Jesus A., Keyhani-Nejad F., Pusec C.M., Goodman L., Geier J.A., Stoolman J.S., Stanczyk P.J., Nguyen T., Xu K., Suresh K.V., et al. Hexokinase 1 cellular localization regulates the metabolic fate of glucose. Mol. Cell. 2022;82:1261–1277.e9. doi: 10.1016/j.molcel.2022.02.028. [DOI] [PMC free article] [PubMed] [Google Scholar]
- DeVilbiss A.W., Zhao Z., Martin-Sandoval M.S., Ubellacker J.M., Tasdogan A., Agathocleous M., Mathews T.P., Morrison S.J. Metabolomic profiling of rare cell populations isolated by flow cytometry from tissues. Elife. 2021;10:e61980. doi: 10.7554/eLife.61980. [DOI] [PMC free article] [PubMed] [Google Scholar]
- Jang C., Chen L., Rabinowitz J.D. Metabolomics and isotope tracing. Cell. 2018;173:822–837. doi: 10.1016/j.cell.2018.03.055. [DOI] [PMC free article] [PubMed] [Google Scholar]
- Pineda-Torra I., Gage M., de Juan A., Pello O.M. In: Methods in Mouse Atherosclerosis. Andrés V., Dorado B., editors. Springer New York; 2015. Isolation, culture, and polarization of murine bone marrow-derived and peritoneal macrophages; pp. 101–109. [DOI] [PubMed] [Google Scholar]
- Villaret-Cazadamont J., Poupin N., Tournadre A., Batut A., Gales L., Zalko D., Cabaton N.J., Bellvert F., Bertrand-Michel J. An optimized dual extraction method for the simultaneous and accurate analysis of polar metabolites and lipids carried out on single biological samples. Metabolites. 2020;10:338. doi: 10.3390/metabo10090338. [DOI] [PMC free article] [PubMed] [Google Scholar]
- Zhang X., Goncalves R., Mosser D.M. The isolation and characterization of murine macrophages. Curr. Protoc. Im. 2008;83:14-11.11–14.11.14. doi: 10.1002/0471142735.im1401s83. [DOI] [PMC free article] [PubMed] [Google Scholar]
Associated Data
This section collects any data citations, data availability statements, or supplementary materials included in this article.
Data Availability Statement
The accession number for the sample metabolomics data reported in this paper is MassIVE: MSV000088899