Abstract
Aim
Liver fibrosis is mainly characterized by the formation of fibrous scars. Galactosylated chitosan (GC) has gained increasing attention as a liver-targeted drug carrier in recent years. The present study aimed to investigate the availability of betulinic acid-loaded GC nanoparticles (BA-GC-NPs) for liver protection. Covalently-conjugated galactose, recognized by asialoglycoprotein receptors exclusively expressed in hepatocytes, was employed to target the liver.
Materials and Methods
Galactose was coupled to chitosan by chemical covalent binding. BA-GC-NPs were synthesized by wrapping BA into NPs via ion-crosslinking method. The potential advantage of BA-GC-NP as a liver-targeting agent in the treatment of liver fibrosis has been demonstrated in vivo and in vitro.
Results
BA-GC-NPs with diameters <200 nm were manufactured in a virtually spherical core-shell arrangement, and BA was released consistently and continuously for 96 h, as assessed by an in vitro release assay. According to the safety evaluation, BA-GC-NPs demonstrated good biocompatibility at the cellular level and did not generate any inflammatory reaction in mice. Importantly, BA-GC-NPs showed an inherent liver-targeting potential in the uptake behavioral studies in cells and bioimaging tests in vivo. Efficacy tests revealed that administering BA-GC-NPs in a mouse model of liver fibrosis reduced the degree of liver injury in mice.
Conclusion
The findings showed that BA-GC-NPs form a safe and effective anti-hepatic fibrosis medication delivery strategy.
Keywords: nanoparticles, lactobionic acid, chitosan, liver fibrosis, betulinic acid
Introduction
Liver fibrosis is a serious medical condition that develops as a result of chronic liver injury caused by various sources.1,2 It is speculated to be a dynamic process marked by an excess of extracellular matrix components that lead to fibrous scarring.3,4 The presence of a fibrous scar disrupts the architecture of the liver, disturbing the normal function of the liver.5,6 Currently, anti-fibrosis therapy is a major concern for preventing the progression of liver disease.7 One of the limiting factors is that candidate drugs are clinically ineffective or have limited antifibrotic effects in the liver and are frequently associated with toxicity in other organs. Therefore, developing effective anti-fibrosis therapy is critical.8,9
Betulinic acid (BA) is a natural plant-derived pentacyclic triterpenoid acid that exists widely in nature and has several biological functions.10,11 Typically, in a specific dosage range, BA is harmless to normal tissues.12 Wan et al13 demonstrated that BA reduces the increase in hydroxyproline and α-smooth muscle actin (α-SMA) in liver tissue mediated by thioacetamide (TAA) and plays a role in the prevention and treatment, showing great efficacy in liver fibrosis. Liu et al14 showed that BA might be a viable novel medication for the treatment of liver fibrosis because it reduces the pathological damage related to liver fibrosis and can lower the serum platelet-derived growth factor and serum hydroxyproline levels by activating autophagy. Although BA has significant biological activity, and some disadvantages, such as poor water solubility and short in vivo half-life, hinder the clinical efficacy.15,16 To overcome these drawbacks, some biodegradable polymer nanoparticles (NPs) of BA have been developed for cancer with excellent efficacy.17,18 However, a nanoscale drug delivery carrier for BA has not yet been reported for anti-hepatic fibrosis therapy.
Chitosan (CS) is a macromolecule straight chain polymer with unique physical and chemical properties and has become a research hotspot because of its biodegradability and biocompatibility.19,20 Protonated amino groups and other active functional groups in CS participate in various bonding processes for chemical modification, endowing it with specific liver targeting function.21,22 In recent years, galactose-modified CS has been developed as a liver-specific drug carrier.23,24 For use as hepatocyte-specific carriers, several forms of lactosaminated or galactosylated CS (GC) derivatives have been identified.25,26 In addition, gene vectors containing GC copolymers with liver targeting capabilities have been employed.27,28 Therefore, GC may be a feasible carrier to deliver BA to the liver.
To the best of our knowledge, liver-targeted GC-NPs have not yet been investigated in-depth with respect to BA administration. Accordingly, in the present study, BA-loaded GC NPs (BA-GC-NPs) were prepared and characterized using the ion-crosslinking method. Furthermore, the in vitro cellular uptake, cytotoxicity, hemolytic activity experiments, and in vivo imaging, anti-liver fibrosis efficacy, and inflammation of NPs were assessed. The results indicated that BA-GC-NPs had significant advantages as a hepatic targeted transport carrier system in the treatment of hepatic fibrosis.
Materials and Methods
Materials
Betulinic acid (BA) was obtained from Derek (Chengdu, China). Chitosan (CS), Lactobionic acid (LA), 1-ethyl-3-(3-dimethylaminopropyl))-Carbodiimide (EDC), N-hydroxysuccinimide (NHS) and Sodium dodecyl sulfate (SDS) were purchased from Aladdin Industries Inc. (Nashville, TN, USA). Sodium tripolyphosphate (TPP) was purchased from Ion Chemical Technology (Shanghai, China). N,N,N′N′-tetramethylethylenediamine (TEMED) was purchased from Titan (Shanghai, China). Phosphoric acid was obtained from Beijing Chemical Plant (Beijing, China). Coumarin-6 was obtained from Sigma Aldrich (St. Quentin Fallavier, France) and 1,1-octadecyl-3,3,3,3-tetramethylindolocyanine iodide (DiR) was obtained from AAT Bioquest (California, USA). And 3-(4,5-dimethylthiazol-2-yl)-2,5-diphenyltetrazolium bromide (MTT) was obtained from Solarbio (Beijing, China).
Cell Lines and Animals
Human hepatocellular carcinoma cells (HepG2) and human hepatic stellate cells (LX-2) were incubated in Dulbecco’s Modified Eagle medium containing 10% fetal calf serum, 80 U·mL−1 penicillin and 80 μg·mL−1 streptomycin. Human hepatocyte cells (LO2) were incubated in Roswell Park Memorial Institute 1640 medium containing 10% fetal calf serum, 80 U·mL−1 penicillin and 80 μg·mL−1 streptomycin. All three kinds of cells were cultured at 37°C and 5% CO2. All the cell lines used in this study were purchased from Procell Life Science&Technology Co., Ltd. (Wuhan, China).
Male white rabbit was provided by the Animal Center of Yanbian University. Male C57BL/6 mice (7–9 weeks old, 20±2g) were provided by Changsheng Biotechnology Co., Ltd. (Liaoning, China). All animals were kept at 25°C and 40–60% humidity, and the light/dark period was 12 h, and they were given free access to water and laboratory food. All animal experiments were conducted under protocols approved by the Ministry of Health of the People’s Republic of China and following Guidelines for the Care and Use of Laboratory Animals of Yanbian University. All animal procedures were approved by the Animal Research Committee of Yanbian University with permission number 2017102610.
Synthesis and Characterization of GC
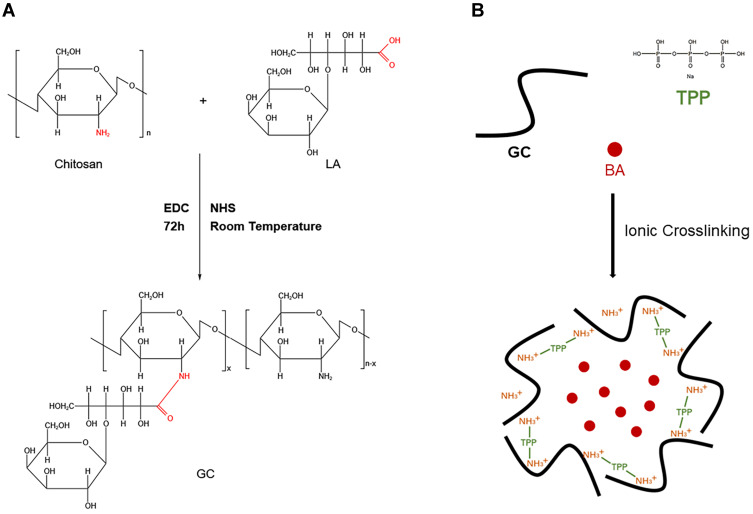
As previously reported,29,30 CS was coupled with LA via an active ester using EDC and NHS. Briefly, 0.5 g of chitosan was dissolved in 50 mL of a TEMED/HCl buffer solution (10 mmol·L−1, pH = 4.7). Subsequently, 2.3g of LA was activated with a mixture of NHS and EDC dissolved in 10 mL of TEMED/HCl buffer solution, in which EDC was 4-fold molar excess over LA and EDC/NHS was at an equivalent molar ratio. Then, the activated LA was added into the CS solution and stirred for 72 h at room temperature. The obtained solution was purified and dialyzed against distilled water for 4 days with a dialysis tube to remove unreacted lactose acid monomers and excess reaction catalysts and solvents, and GC was obtained by freeze drying at −50°C. The synthetic pathway was presented in Figure 1A.
Figure 1.
(A) Synthesis process of GC.29 (B) Preparation of BA-GC-NPs by cross-linking method.
Fourier transform infrared spectroscopy (FT-IR) (IR Prestige-21, Shimadzu, Japan) was used to analyze the chemical structures of CS, LA and GC. Specifically, the solid samples were mixed and ground with potassium bromide powder respectively. The tablets were pressed under the condition of keeping dry and were put into the detection light path to record their maps. The synthesis and grafting rate of GC were further examined by dissolving CS and GC in the D2O with the final concentration of 10 mg·mL−1 and loading them into nuclear magnetic tubes, respectively. The nuclear magnetic resonance hydrogen spectrum (1H-NMR) was detected and recorded in NMR spectrometer (Bruker AV-500; Bruker, USA).
Preparation of BA-GC-NPs
The ionic cross-linking method used to prepare the nanoparticles was described in a previous report.31,32 The steps for making BA-GC-NPs using the ion crosslinking method are shown in Figure 1B. Before preparing BA-loaded nanoparticles, 0.15 wt% acetic acid solution of synthetic material GC and 0.5% ethanol solution of BA were prepared. Subsequently, 20 mL of 0.07% TPP solution was added drop by drop to a full mixture of 30 mL GC solution and 2 mL BA solution with a magnetic stirrer. After centrifugation of the above-mentioned mixture at 10,000 rpm·min−1, the collected nanoparticles were re-suspended in purified water and rinsed with purified water until the pH value of the solution became neutral. The nanoparticles used in the following experiments were processed by lyophilization.
Determination of Entrapment Efficiency and Loading Efficiency
HPLC (1260 Infinity, Agilent Technologies, USA) was used to determine the amount of BA in the sample. The chromatographic conditions for HPLC detection and analysis were: mobile phase was acetonitrile-0.5% phosphoric acid water (85:15), flow rate was 1 mL·min−1, detection Wavelength was 202 nm, column temperature was 40°C, and injection volume was 10 μL.
The drug loading (LE) and encapsulation efficiency (EE) of the nanoparticles were determined according to the reported method.33,34 The lyophilized nanoparticles were first washed twice with distilled water and then centrifuged at 10,000 rpm·min−1 for 30 min, with the free BA in the supernatant being discarded. After dispersing the precipitated nanoparticles in ethanol and vortexing for 10 min, the supernatant collected by centrifugation passed through a 0.45 μm filter membrane. EE of the nanoparticles was evaluated by following equation:
 |
(1) |
Among them, WE is the weight of BA wrapped in nanoparticles, and WN is the weight of nanoparticles.
LE of the nanoparticles was evaluated as follows:
 |
(2) |
Among them, WE is the weight of BA wrapped in nanoparticles, and WT is the weight of total BA added.
Characterization of BA-GC-NPs
A Zeta potential particle size analyzer (Nanobrook 90Plus Zeta, Brookhaven Instruments, USA) was used to measure the particle size, polydispersity index (PDI) and Zeta potential (ζ) of the nanoparticles. The nanoparticles were uniformly dispersed and placed in the absorption tank, and all parameter values were recorded in the analyzer.
Transmission electron microscope (TEM) (HT7700, Hitachi, Japan) was used to watch the morphology of BA-CS-NPs. The nanoparticles were suspended in deionized water in a low-concentration solution and treated with ultrasound for 2 min to make them in a monodispersed state, before being placed on a clean copper net for observation.
Analysis of in vitro BA Release Behavior
The release behavior in vitro of BA from BA-GC-NPs was studied by centrifugal method with a PBS solution (pH 7.4) containing 0.5% sodium dodecyl sulfate (SDS) and 10% ethanol as the release media. The known amount of free BA and BA-GC-NPs in a microcentrifuge tube containing 8 mL of release medium and shaken at a set amplitude of 120 rpm·min−1 on a table concentrator (GHA-E, Zhongjie, China) at 37°C. The above tubes were centrifuged at 12,000 rpm·min−1 and 4°C for 10 minutes at predetermined intervals to collect an equal volume of supernatant and supplemented with an equal volume of release medium. The content of BA in the released samples was determined by HPLC in order to calculate the cumulative release rate and match with the release model.
Hemolytic Activity Test
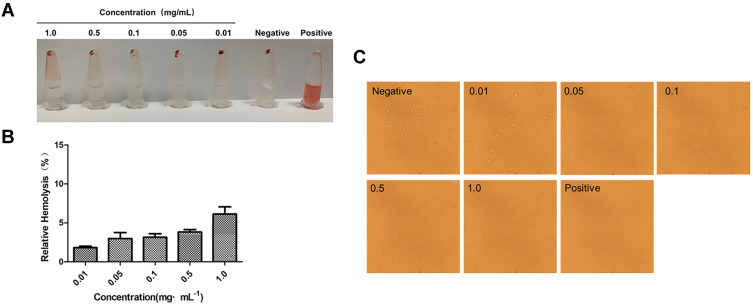
Hemolytic activity was evaluated as previously reported.35 200 μL of 2%(V/V) red blood cell suspension from male white rabbit was added to 800 μL of PBS (pH 7.4) containing different amounts of BA-GC-NPs (0.01, 0.05, 0.1, 0.5, 1 mg) as the experimental group, and mixed with PBS or distilled water of equal volume as a negative control and a positive control, respectively. After incubation at 37°C for 3 h, all sample solutions were centrifuged at 860 × g for 5 minutes, and the absorbance of the supernatant was measured at 540 nm using a microplate detector (Biotek, USA). The hemolysis ratio was calculated using the following formula:
 |
(3) |
Among them, A sample is the absorbance of sample, A negative control is the absorbance of negative controls, A positive control is the absorbance of positive controls.
Red Blood Cell Morphology
A certain amount of different concentrations of BA-GC-NPs experimental group, negative control group, and positive control group samples were taken into a 96-well plate, and observed under an inverted microscope to obtain the morphology of red blood cells.
Cytotoxicity Study
The toxicity of BA, blank nanoparticles without BA (GC-NPs), and BA-GC-NPs to LX-2, HepG2, and LO2 cells were determined by MTT method, respectively. HepG2, LX-2, and LO2 cells in the logarithmic growth phase were seeded into a 96-well plate at a density of 1×10⁴ cells/well, with a seeding volume of 200 μL/well. After incubating for 24 h, the culture medium of each well was removed and replaced with 100 μL of BA, GC-NPs or BA-GC-NPs in FBS-free medium at a predetermined concentration, with the same volume of FBS-free medium as the control wells, and the cells were further incubated for 24, 48 or 72 h. Then, 20 μL of MTT solution (5 mg/mL solution) was added to each well and cultured for 4 h. After aspirating the medium in each well, 150 μL of dimethyl sulfoxide (DMSO) was added into each well and the 96-well plate was placed on a shaker to shake at a low speed for 10 minutes to fully dissolve the blue formazan crystals. Absorbance of each well was measured at 490 nm using a microplate reader. The cell viability was calculated using the following formula:
 |
(4) |
where A sample, A blank, A control represent the absorbance of sample, blank and control, respectively.
Cellular Uptake
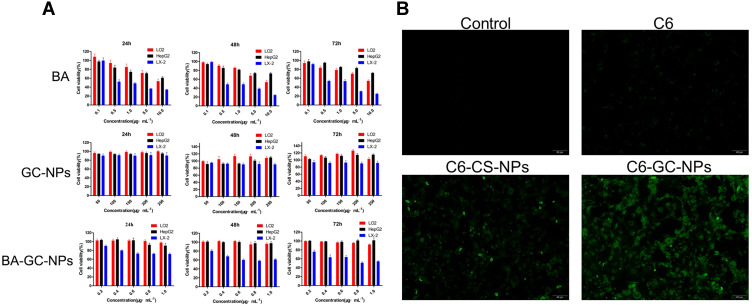
The uptake of BA-GC-NPs by cells in vitro was examined using coumarin-6(C6) as a fluorescent probe instead of BA. The drug-loading content of C6-labeled GC-NPs (C6-GC-NPs) and C6-labeled CS-NPs (C6-CS-NPs) was determined after they were lyophilized as indicated above. LX-2 cells were seeded on a 24-well plate at a density of 6×10⁴ cells/well and incubated overnight. Then, the culture medium was replaced with 1 mL FBS-free DMEM containing C6, C6- GC-NPs or C6-CS-NPs at a concentration of 10 ng/mL of C6, and then the cells were incubated for 4 h. After aspirating the medium, the cells were washed with ice-cold PBS three times to remove superfluous preparation and observed under a fluorescent inverted microscope.
Animal Studies
Before the experiment, the mice were randomly divided into at least six in each group. To establish a model of liver fibrosis, after diluting carbon tetrachloride (CCL 4) with corn oil (1:7), mice were intraperitoneally injected with the above mixture twice a week for 4 weeks (4μL/g body weight). The mice in the non-fibrotic control group were injected with the same volume of corn oil only.
For liver toxicity and inflammation studies, normal mice were injected with 10 mg/kg of free BA or the same dose of BA-GC-NPs through the tail vein once a day for 3 consecutive days, and injected with an equal volume of PBS as control. After the mice were killed, blood was drawn and livers were preserved for later analysis.
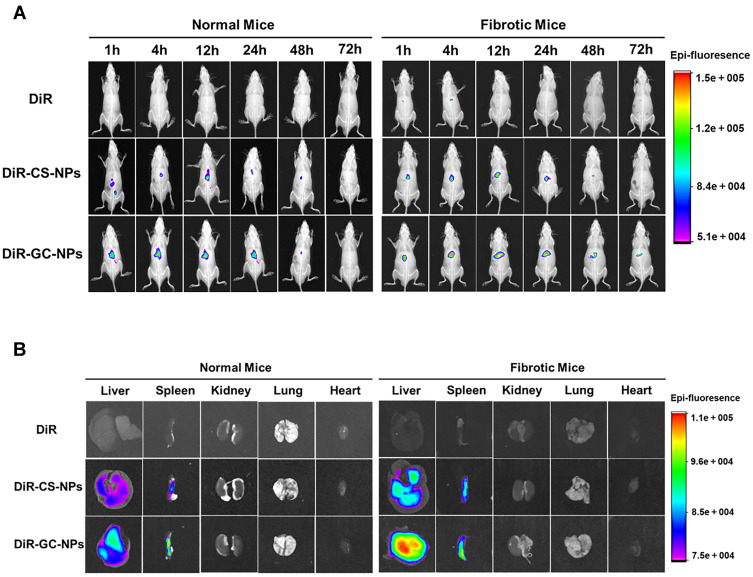
For in vivo imaging studies, DiR was used in place of BA as an in vivo tracer in mice. DiR-labeled GC-NPs (DiR-GC-NPs) and DiR-labeled CS-NPs (DiR-CS-NPs) were prepared and further lyophilized, and then the drug loading was calculated. Free DiR, DiR-labeled DiR-GC-NPs or DiR labeled DiR-CS-NPs (DiR dose, 1 mg/kg body weight) were injected into the fibrotic mouse group and non-fibrotic mouse control group through the tail vein at different times, and their hair was cleaned with shaver. After the mice were anesthetized, the mice were imaged in vivo at 1, 4, 12, 24, 48, and 72 h using an in vivo imaging system (In-Vivo Xtreme, Bruker, Germany). Corresponding in vitro imaging determinations were also performed using isolated organs.
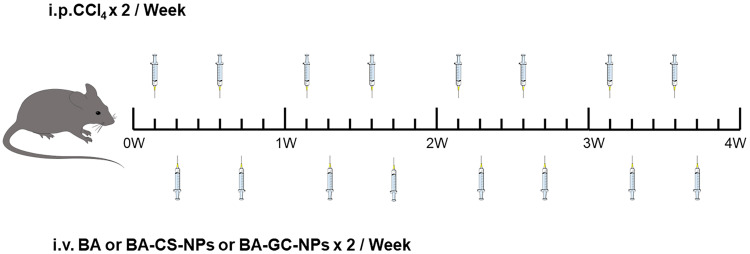
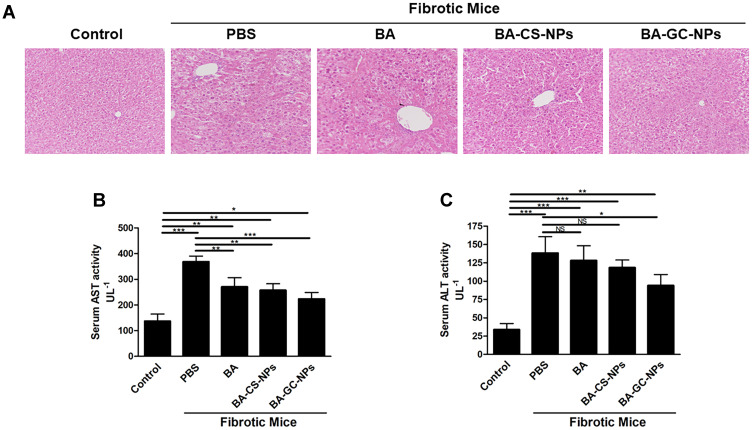
For fibrosis regression studies, 200 μL of PBS containing free BA, BA-CS-NPs and BA-GC-NPs was injected into the liver fibrosis model group of mice through the tail vein twice a week. (BA, 5 mg/kg) for 4 weeks. To compare the therapeutic effects of injecting various preparations in other liver fibrosis mice, non-liver fibrosis mice were used as the negative control, and liver fibrosis mice were only given PBS as the positive control. The dosing schedule is shown in Figure 2 After the mice were killed, blood was drawn and livers were preserved for later analysis.
Figure 2.
The dosing schedule in liver-fibrosis regression studies.
Analysis of ALT and AST in Serum
Standard kits (Huili, BioTech, Changchun, China) were used to quantify serum levels of the liver damage indicators alanine transaminase (ALT) and aspartate transaminase (AST) in various animal groups, according to the manufacturer’s recommendations.
Test of Tissue Section
Deparaffinized and hydrated paraffin-embedded liver tissues were sectioned at 5μm. Thereafter, sections were stained with a hematoxylin and eosin (H&E) staining Kit (Solarbio, Beijing, China). Slides were fixed and imaged at a magnification of 20 after being dehydrated.
Statistical Analysis
All of the experiments were conducted at least three times, and the typical data were provided as means ± standard error of the mean. For multiple groups, a one-way ANOVA analysis of variance was performed, followed by a Tukey’s post hoc test.
Results
Characterization of GC
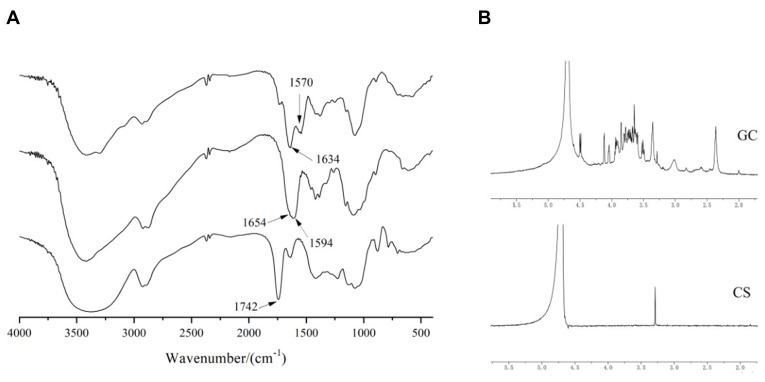
GC was achieved by forming amide bonds between carboxyl groups in LA and residual amine groups in CS that were confirmed by FTIR and 1H-NMR measurements. As shown in Figure 3A, the characteristic absorption peak of the carboxyl group at 1742 cm−1 in the FTIR spectra of LA disappeared in the FTIR spectra of GC, indicating that the carboxyl group of LA and the primary amine group of CS formed an amide bond. The weak absorption peak of CS at 1654 cm−1 was attributed to the stretching vibration of C=O, and the strong absorption peak of CS at 1594 cm−1 was attributed to the stretching vibration of N-H, proving the presence of a large number of primary amino groups.36 In the FTIR spectra of GC, the absorption peak caused by C=O stretching vibration shifted from 1654 cm−1 to 1634 cm−1, and the intensity increased due to the newly formed numerous amide bonds.37 In addition, the absorption peak of GC caused by the bending vibration of N-H shifted from 1594 cm−1 to 1570 cm−1, which was attributed to the residual primary amine groups on CS not bound to LA. The intermolecular conformational changes after the reaction of CS and LA indicated that LA was introduced into the CS chain.
Figure 3.
(A) FTIR spectra of GC, CS, and LA. (B) 1H-NMR spectra of GC and CS.
As shown in Figure 3B, 1H-NMR of GC showed that the number of absorption peaks between δ:3.5 and 4.0 ppm was more than that of CS, indicating an interaction between LA and CS.38 The ratio of the characteristic peak area of LA (4.131 ppm, Hc) and CS (3.066 ppm, H2) in the 1H-NMR of GC was used as the grafting rate to estimate the efficiency of LA connecting to CS, which was 18.86%.39 While considering the potential applications of the current synthetic vectors, a high degree of galactosylation of GC might be beneficial in enhancing liver targeting.
Characterization of BA-GC-NPs
The concentration of GC solution and the amount of TPP were identified as the key factors that regulated the morphology and performance of BA-GC-NPs and were investigated to obtain the optimum formulation. The amount of LA in GC and the amount of BA added to GC were maintained constant, while the concentration of GC was controlled at 0.10, 0.15, and 0.20 wt%, and the concentration of TPP was controlled at 0.06, 0.07, and 0.08 wt% to prepare and characterize the BA-GC-NPs, respectively. The related parameters of the various NPs are summarized in Table 1. The results showed that the average size, EE%, and LD% of NPs in each group changed with the amount of TPP and the concentration of GC solution, which could be attributed to the effect of charge interactions between molecules. According to the parameters of NPs prepared by different formulas, formula 5 with the highest EE% and LD% and the smallest particle size was selected for subsequent experiments.
Table 1.
Characterization Parameters of BA-GC-NPs Nanoparticles
| Formula | GC (wt%) | TPP (wt%) | Partical Size (nm) | PDI | ζ (mV) | LE (%) | EE (%) |
|---|---|---|---|---|---|---|---|
| 1 | 0.10 | 0.06 | 212.6±9.4 | 0.14±0.04 | −4.12±0.51 | 9.46±0.79 | 25.0±2.89 |
| 2 | 0.10 | 0.07 | 119.6±1.6 | 0.20±0.01 | −1.23±0.00 | 9.60±0.54 | 21.9±3.54 |
| 3 | 0.10 | 0.08 | 133.3±7.9 | 0.10±0.01 | −0.16±0.00 | 11.66±1.56 | 19.0±2.68 |
| 4 | 0.15 | 0.06 | 132.9±5.9 | 0.26±0.02 | −1.30±0.00 | 12.06±0.89 | 42.2±5.64 |
| 5 | 0.15 | 0.07 | 108.2±5.5 | 0.22±0.08 | −0.58±0.37 | 13.24±1.16 | 48.4±4.85 |
| 6 | 0.15 | 0.08 | 134.6±3.2 | 0.17±0.09 | 2.37±0.07 | 11.60±0.46 | 43.0±6.58 |
| 7 | 0.20 | 0.06 | 143.8±13.3 | 0.21±0.06 | −0.14±0.00 | 9.86±0.83 | 46.6±5.15 |
| 8 | 0.20 | 0.07 | 120.8±7.2 | 0.39±0.02 | 1.68±0.26 | 9.71±0.57 | 46.3±3.21 |
| 9 | 0.20 | 0.08 | 142.3±8.4 | 0.23±0.04 | 0.87±0.00 | 8.38±0.65 | 38.9±4.56 |
The DLS study found that the average particle size of the NPs was <200 nm, indicating that the prepared NPs could be absorbed by the liver. This is because NPs with large sizes (for example, >250 nm) can barely escape macrophage capture in the hepatic reticuloendothelial system to reach the majority of the cell types in the liver, including the liver parenchyma cells and liver stellate cells via the foramen of liver sinusoids endothelial cell. On the other hand, small NPs (<100 nm) accumulate in the kidney or rapidly penetrate into the capillaries.40 Therefore, the optimal size of NPs obtained by adjusting the average size of NPs was >100 nm but <250 nm. As shown in Table 1, the PDI of NPs was <0.3, suggesting that they were distributed equally without aggregation and thus met the conditions for intravenous injection. In addition, the zeta potential of these NPs changed from −4 mV to 1 mV, which could be attributed to the residual amino groups in the CS unit and hydrophilic CS chains stretching out to form the outer layer during the formation process of the NPs.41
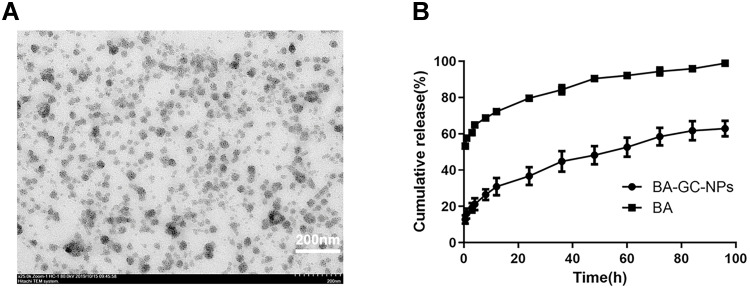
TEM was used to examine the morphology of BA-GC-NPs. Figure 4A shows that the NPs presented a regular and uniform spherical morphology.
Figure 4.
(A) TEM micrograph of BA-GC-NPs (scale bar = 200 nm). (B) In vitro cumulative release curves of BA-GC-NPs and BA.
Analysis of in vitro BA Release
The release curves of BA and BA-GC-NPs are shown in Figure 4B. The rapid release of free BA was released completely only at about 8 h. The in vitro release of BA-GC-NPs exhibited a two-stage release behavior. In the initial phase of 0.5–12 h, about 30.91% of the drugs in BA-GC-NPS were suddenly released, which might be due to the fact that the surface of the NPs produced by crosslinking with TPP in aqueous media is hydrophilic.42 Subsequently, the drug was released gradually from the NPs, and the release rate was constant during 12–96 h, which could be due to the erosion and degradation of NPs leading to the continuous release of BA encapsulated in BA-GC-NPs.43 Contrary to free BA, the drugs wrapped in NPs were released slowly and continuously because of the gradual dissolution of the material, which was beneficial to the curative effect of the drug at the lesion site.44
As shown in Table 2, various kinetic models were used to explain the release behavior of BA from BA-GC-NPS; the drug release of BA-GC-NPs fit the Higuchi equation (r2 = 0.9968 for formulations). The release behavior of BA from BA-GC-NPS in vitro followed Fick’s diffusion theorem,45,46 as shown by the conformity of the release mechanism according to Higuchi’s model. The process of drug release involves the diffusion of the drugs on the surface of the nanoparticle, followed by the diffusion and disintegration of a significant number of drugs present in the carrier’s internal structure. Strikingly, some of the carrier materials disintegrated along with a small amount of the drugs, the osmotic pressure dropped, and the drug release process entered a state of dynamic equilibrium.
Table 2.
Interpretation of the BA Release from BA-GC-NPs Using Different Kinetic Models
| Sample | Zero-Order r2 | First-Order r2 | Higuchi r2 | Ritger-Peppas r2 | Weibull r2 | Double-Exponential r2 |
|---|---|---|---|---|---|---|
| BA-GC-NPs | 0.9316 | 0.7621 | 0.9968 | 0.9915 | 0.9963 | 0.9966 |
Hemolytic Activity Test
As shown in Figure 5A, the supernatant of the negative control group and each experimental group was clarified by centrifugation as the red blood cells formed a pellet. Conversely, the positive control group did not see any stratification after centrifugation; the solution was red, indicating that the red blood cells were completely ruptured and the hemoglobin was released from the red blood cells. As shown in Figure 5B, the hemolysis rate of BA-GC-NPs increased in a dose-dependent manner in the range of 0.01–1.0 mg·mL−1; however, the increase was <10%. BA-GC-NPs demonstrated good blood compatibility because even at high concentrations (1.0 mg·mL−1), no substantial erythrocytic lysis was observed.47 Experimental results showed that BA-GC-NPs met the hemolysis standards of medicinal materials and could be safely administered intravenously.
Figure 5.
(A) Macroscopic observation of hemolysis caused by NPs in PBS. (B) Hemolysis rate of different concentrations of NPs in PBS. (C) Red blood cell state after co-incubation with different concentrations of BA-GC-NPs (20×10).
Red Blood Cell Morphology
Figure 5C shows, the inverted microscope image, wherein almost all the red blood cells were pierced in the positive control group, while the experimental groups showed a complete round cake shape with convex on both sides and concave in the middle.48 No obvious rupture, aggregation, or blistering of erythrocytes was detected even with 1.0 mg·mL−1 BA-GC-NPs, which was compatible with the status of the erythrocytes in the negative control group.
Cytotoxicity Study
As shown in Figure 6A, the survival rate of the three kinds of cells was inversely proportional to the concentration and action time of BA after administration. With the increase in BA dosage and action time, the survival rate of the three types of cells continued to decline. Figure 5A shows the strong inhibitory effect of BA on LX-2 cells under the same conditions. When the concentration was >0.5 μg·mL−1, the cell survival rate of LX-2 cells was <50%. When the concentration of BA was 0.1–1 μg·mL−1, the survival rates of LO2 and HepG2 cells were >80% at 24 h, 48 h, and 72 h. This phenomenon presented weak toxicity of BA on both LO2 and HepG2 cells at a concentration of 0.1–1 μg·mL−1 but a strong inhibitory effect on LX-2 cells.
Figure 6.
(A) Cytotoxicity of BA, GC-NPs and BA-GC-NPs on HepG2, LX-2 and LO2 cells respectively for different time points. (B) Cellular uptake behavior of free C6 and C6-labeled NPs.
The cytotoxicity results of GC-NPs showed that the survival rates of the three types of cells were >90% even at a high concentration (250 μg·mL−1) after 24 h, 48 h, or 72 h incubation. The results proved that the prepared carrier GC-NPs (50–250 μg·mL−1) did not exert any toxic effect on the three types of cells and had good cytocompatibility.
After 24 h, 48 h, or 72 h of incubation, the survival rate of LX-2 cells treated with BA-GC-NPs decreased with the increase in drug concentration and reaction time. When 1.0 μg·mL−1 BA-GC-NPs were applied to LX-2 cells for 72 h, the cell survival rate of the LX-2 cells decreased to 54.4%, showing a strong inhibitory effect. However, the survival rate of LO2 and HepG2 cells was unaltered with the concentration and duration of reaction, and the survival rate of the two cells was >90% even at the concentration of 1.0 μg·mL−1 for 72 h.
These results showed that these GC-NPs had no toxic effect on the three cells and had good cell compatibility, and hence, could be used as carriers for in vivo drug delivery. When the concentration of BA-GC-NPs was in the range of 0.2–1.0 μg·mL−1, it could ensure that it had no effect on the LO2 cells and had a stronger inhibitory effect on LX-2 cells.
Cellular Uptake
In order to study the effect of LA modification on cell uptake, we compared the uptake results of C6-GC-NPs and C6-CS-NPs when C6 was used instead of BA. As shown in Figure 6B, under the same dosage conditions, LX-2 cells treated with free C6 showed only weak fluorescence, while the fluorescence of GC-NPs labeled with C6 and the LX-2 cells treated with Bean 6-labeled CS NPs was significantly enhanced. Under the same conditions, LX-2 cells treated with C6-GC-NPs exerted a strong fluorescence, indicating that the cells had a high uptake of C6.
The results showed that due to the passive targeting effect of the NPs, the uptake of C6 encapsulated by the carrier material by LX-2 cells increased significantly. In addition, the intake of LA-modified GC-NPs was higher than that of unmodified CS NPs.
In vivo Imaging Studies
In vivo imaging results (Figure 7A) showed that DiR-CS-NPs and DiR-GC-NPs were more effective than free DiR accumulation in mice. Furthermore, the concentration of DiR-GC-NPs was higher than that of DiR-CS-NPS in both normal and liver fibrosis mice; this could be attributed to the enhanced uptake of DiR-GC-NPs by the liver due to LA modification. In normal mice, the fluorescence signals of DiR-CS-NPs and DiR-GC-NPs were detected within 1 h and decreased gradually after reaching the peak at 12 h. However, DiR-GC-NPs could still be detected in fibrotic liver mice until day 3, while the fluorescence signal of DiR-CS-NPs was very weak at 48 h and disappeared after 72 h. These results confirmed that DiR-GC-NPs had high liver specificity and long-term accumulation in the liver.49
Figure 7.
(A) In vivo imaging in mice. (B) Fluorescence imaging of isolated mouse organs.
On day 3, the liver, spleen, kidney, lung, and heart of the mice were harvested for fluorescence imaging. The findings (Figure 7B) were similar to the results of in vivo imaging. The fluorescence intensity of DiR-GC-NPs and DiR-CS-NPs was much higher in the liver than in the other organs, and the fluorescence intensity of DiR-GC-NPs was higher than that of DiR-CS-NPs, revealing a significant accumulation of DiR-GC-NPs in the liver. DiR-CS-NPs and DiR-GC-NPs were more abundant in fibrotic livers than in normal livers, owing to their small particle size, which facilitated their extravasation and retention in the damaged tissue, closed to the advanced penetrability and retention seen with nanoparticle therapeutic agents in tumors. Moreover, the pathological state of the fibrosis liver weakened the metabolic capacity of the liver, resulting in long-term aggregation of NPs, and the deposition of collagen protein in the fibrosis liver accelerated this process.50 These findings revealed that DiR-GC-NPSs and DiR-CS-NPs accumulated strongly in the spleen. The reason for this phenomenon was that the spleen, like the liver, has a leaky endothelium membrane,51 and the lymphocytes, macrophages, and dendritic cells also played a significant role in the spleen.52
Liver Toxicity and Inflammation Studies
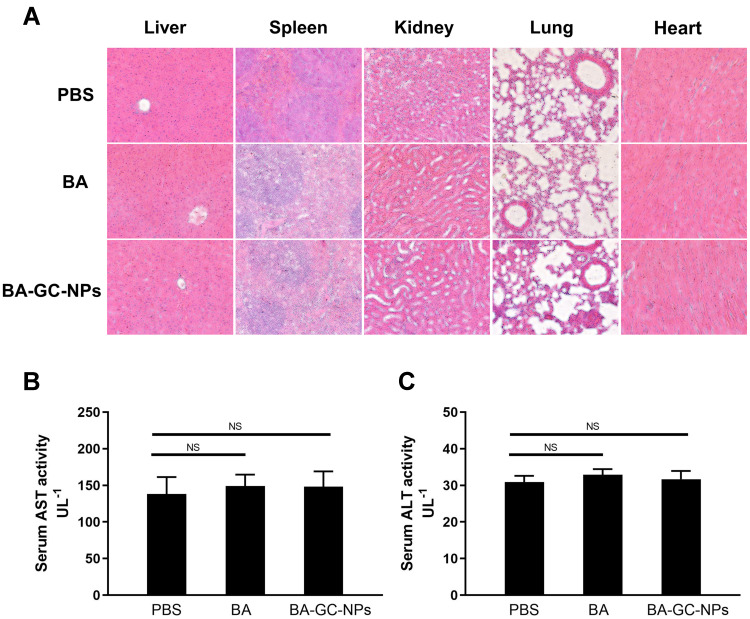
Hepatotoxicity and inflammation caused by BA-GC-NPs were studied by tail vein injection of normal C57BL/6 mice at a dose of 10 mg/kg BA once a day for 3 days. In the study of organ toxicity, as shown in Figure 8A, the histological analysis using hematoxylin-eosin staining showed that after treatment with BA-GC-NPs and BA, the mice livers did not show any significant lesions and inflammatory infiltration compared to the PBS control group. Moreover, in each group after treatment, the main tissues, including the spleen, kidney, lung, and heart, did not show any obvious pathological morphology. The in vivo toxicity of BA and BA-GC-NPs in mice was further evaluated by evaluating the serum levels of hepatotoxicity markers, AST and ALT. As shown in Figure 8B and C, the serum AST and ALT levels of mice in the BA and BA-GC-NPs groups did not differ significantly from those in the control group after administration, indicating that BA and BA-GC-NPs do not cause liver damage.53
Figure 8.
(A) Inflammatory response of various organs of BA- and BA-GC-NPs-administered mice was analyzed by HE staining section (20×10). Levels of (B) AST and (C) ALT in serum of normal mice administered PBS, BA, and BA-GC-NPs were determined by biochemical analysis. NS p ˃ 0.05.
These findings showed that BA-GC-NPs had no toxicity and pro-inflammatory properties in mice, which further confirmed that BA-GC-NPs are well-tolerated, thus providing a reliable delivery strategy for the treatment of hepatic fibrosis.
Fibrosis Regression Studies
As shown in Figure 9A, the HE staining results showed that the liver of mice in the control group had a normal lobular structure and almost no fibrous septa. On the contrary, the liver slices of mice with liver fibrosis injected with PBS showed severe lobular necrosis, disordered central venous sinusoid distribution of the liver lobules, deposition of collagen fibers, and mild formation of fibrous septa.54 Compared to the control group, the treatment with BA, BA-CS-NPs, and BA-GC-NPs reduced the degree of liver fibrosis. The liver sections of the mice in the model group treated with BA-GC-NPs showed that the cord-like distribution disorder was improved significantly, without any inflammatory infiltration. The test results showed that BA-GC-NPs had obvious hepatoprotective effects.
Figure 9.
(A) HE staining of the liver tissue sections (20×10). Levels of (B) AST and (C) ALT in mice after treatment with different drug groups. *p < 0.05, **p < 0.01, ***p < 0.001, NS p ˃ 0.05.
Liver damage is usually associated with elevated ALT and AST levels. Herein, the serum ALT and AST levels of the fibrosis mice were significantly higher than those in the control group, indicating that a liver fibrosis mouse model was established successfully.55 As shown in Figure 9B and C, the model group treated only with PBS showed a significantly high AST level in the model group than the normal mice.56 Moreover, after administration of different drugs, significant differences were detected in AST levels between BA and BA-CS-NPs treatment groups compared to the PBS treatment group, indicating that BA and BA-CS-NPs treatment reduced the level of AST in vivo, but it was higher than that of the normal mice. After treatment with BA-GC-NPs, the AST levels of mice decreased significantly compared to the fibrotic mice treated with PBS only, which is similar to that of the control group. Thus, it could be deduced that the changes in the ALT levels were similar to those of AST. The ALT level of the BA and BA-CS-NPs treatment groups was much higher than that of the control group, but no significant difference was detected compared to the group administered only PBS. Also, after treatment with BA-GC-NPs, although the ALT level was significantly lower than that of the group administered only PBS, there was still a considerable gap between the BA-GC-NPs treatment and the control groups. This finding suggested that the treatment with BA-GC-NPs can decrease the level of ALT in fibrosis mice, which was already lower than the AST level.
These results suggested that the injection of BA, BA-CS-NPs, or BA-GC-NPs through the tail vein improves the degree of liver fibrosis. Notably, BA-GC-NPs had the best therapeutic effect, which put forth that encapsulating BA into GC-NPs facilitated BA efficacy in the diseased liver.
Discussion and Conclusions
Due to the lack of effective and specific methods, the anti-fibrosis treatment of liver fibrosis is yet an enigma.57 Therefore, novel interventions for liver fibrosis are essential.58 Herein, we designed and evaluated the BA-GC-NPs and confirmed that BA-GC-NPs constituted a safe, liver-targeted chemical drug delivery system to protect liver fibrosis.
First, GC was synthesized according to literature reports, and BA-GC-NPs were prepared using an ion-crosslinking method. Different NPs were prepared by changing the concentration of GC and the crosslinking agent TPP. The particle size, potential, and DL% of the prepared BA-GC-NPs can be regulated by the amount of GC and TPP used. Reportedly, the main factor affecting the release of GC-NPs is the degree of substitution of LA on CS.59 This study did not synthesize GC- with different degrees of substitution. Regarding lactose, the effect of acid substitution degree on the release of CS NPs needs to be investigated further. BA-GC-NPs prepared by the best prescription had high encapsulation efficiency and sustainable drug release. In addition, the TEM image showed that BA-GC-NPs were spherical, well-dispersed particles, with an average diameter of 108.2 ± 5.5 nm and a modest size (200 nm), which might be beneficial for the treatment of hepatic fibrosis. First, this allows BA-GC-NPs to be cleared from the spleen and be redirected to the liver, while due to the small size, the particle penetrates into the fibrotic liver tissue.60 Furthermore, the zeta potential of BA-GC-NPs was almost neutral (−0.58 mV), preventing negatively charged biomolecules from adsorbing and extending the cycle’s half-life.61 Therefore, these functions might enhance the uptake of hepatic stellate cells.
Hepatic stellate cells are involved in the secretion of extracellular matrix and play a key role in liver fibrosis. However, due to the anatomical location, the drugs are not easily absorbed by the hepatic stellate cells, which is why several drugs that show antifibrotic activity in vitro are ineffective in vivo. Compared to BA-CS-NPs in LX-2 cells, BA-GC-NPs have a higher cellular uptake. The current issue with the systemic administration of NPs is that they cannot concentrate on the target organs.62,63 In vivo imaging results in mice showed that the accumulation of DiR-GC-NPs in the liver was higher than that in other organs. Even after 3 days, DiR-GC-NPs were still detected in the liver. As mentioned above, the small size and low surface charge of BA-GC-NPs prevent these particles from eliminating RES and facilitate their preferential delivery to the liver. Next, we investigated the treatment of liver fibrosis in vivo based on the above findings. BA-GC-NPs was more effective in treating liver fibrosis than BA-CS-NPs or BA, indicating that BA-GC-NPs form a precise and efficient drug delivery strategy that increases the anti-fibrosis efficacy of BA. Safety is a major aspect of drug delivery systems in addition to therapeutic effectiveness.64 BA-GC-NPs were composed of natural biodegradable materials and exhibited low toxicity. Therefore, BA-GC-NPs were deemed to have low toxicity and high blood compatibility but no hepatotoxicity or inflammatory effects.
In summary, we found that BA-GC-NPs constitute a promising drug delivery mechanism with high safety for the treatment of liver fibrosis. Taken together, BA-GC-NPs can be a safe and effective liver-targeted chemical drug delivery system that improves the degree of liver damage in fibrotic mice and can be used for liver protection.
Acknowledgments
This study was supported by the Key R&D Project of the Jilin Province Science and Technology Development Plan of China (No. 20210204166YY).
Disclosure
The authors report no conflicts of interest in this work.
References
- 1.Friedman SL, Pinzani M. Hepatic fibrosis 2022: unmet needs and a blueprint for the future. Hepatology. 2022;75(2):473–488. doi: 10.1002/hep.32285 [DOI] [PMC free article] [PubMed] [Google Scholar]
- 2.Lee YA, Wallace MC, Friedman SL. Pathobiology of liver fibrosis: a translational success story. Gut. 2015;64(5):830–841. doi: 10.1136/gutjnl-2014-306842 [DOI] [PMC free article] [PubMed] [Google Scholar]
- 3.Kisseleva T, Brenner D. Molecular and cellular mechanisms of liver fibrosis and its regression. Nat Rev Gastroenterol Hepatol. 2021;18(3):151–166. doi: 10.1038/s41575-020-00372-7 [DOI] [PubMed] [Google Scholar]
- 4.Higashi T, Friedman SL, Hoshida Y. Hepatic stellate cells as key target in liver fibrosis. Adv Drug Deliv Rev. 2017;121:27–42. doi: 10.1016/j.addr.2017.05.007 [DOI] [PMC free article] [PubMed] [Google Scholar]
- 5.Kisseleva T, Brenner DA. Mechanisms of fibrogenesis. Exper Biol Med. 2008;233(2):109–122. doi: 10.3181/0707-mr-190 [DOI] [PubMed] [Google Scholar]
- 6.Parola M, Pinzani M. Liver fibrosis: pathophysiology, pathogenetic targets and clinical issues. Mol Aspects Med. 2019;65:37–55. doi: 10.1016/j.mam.2018.09.002 [DOI] [PubMed] [Google Scholar]
- 7.Friedman SL, Bansal MB. Reversal of hepatic fibrosis – fact or fantasy? Hepatology. 2006;43(2Suppl 1):S82–88. doi: 10.1002/hep.20974 [DOI] [PubMed] [Google Scholar]
- 8.Puche JE, Saiman Y, Friedman SL. Hepatic stellate cells and liver fibrosis. Compr Physiol. 2013;3(4):1473–1492. doi: 10.1002/cphy.c120035 [DOI] [PubMed] [Google Scholar]
- 9.Gupta G, Khadem F, Uzonna JE. Role of hepatic stellate cell (HSC)-derived cytokines in hepatic inflammation and immunity. Cytokine. 2019;124:154542. doi: 10.1016/j.cyto.2018.09.004 [DOI] [PubMed] [Google Scholar]
- 10.Wan Y, Jiang S, Lian LH, et al. Betulinic acid and betulin ameliorate acute ethanol-induced fatty liver via TLR4 and STAT3 in vivo and in vitro. Int Immunopharmacol. 2013;17(2):184–190. doi: 10.1016/j.intimp.2013.06.012 [DOI] [PubMed] [Google Scholar]
- 11.Zheng ZW, Song SZ, Wu YL, Lian LH, Wan Y, Nan JX. Betulinic acid prevention of d-galactosamine/lipopolysaccharide liver toxicity is triggered by activation of Bcl-2 and antioxidant mechanisms. J Pharm Pharmacol. 2011;63(4):572–578. doi: 10.1111/j.2042-7158.2010.01239.x [DOI] [PubMed] [Google Scholar]
- 12.Lou H, Li H, Zhang S, Lu H, Chen Q. A review on preparation of betulinic acid and its biological activities. Molecules. 2021;26(18):18. doi: 10.3390/molecules26185583 [DOI] [PMC free article] [PubMed] [Google Scholar]
- 13.Wan Y, Wu YL, Lian LH, et al. The anti-fibrotic effect of betulinic acid is mediated through the inhibition of NF-κB nuclear protein translocation. Chem Biol Interact. 2012;195(3):215–223. doi: 10.1016/j.cbi.2012.01.002 [DOI] [PubMed] [Google Scholar]
- 14.Liu Y, Bi Y, Mo C, et al. Betulinic acid attenuates liver fibrosis by inducing autophagy via the mitogen-activated protein kinase/extracellular signal-regulated kinase pathway. J Nat Med. 2019;73(1):179–189. doi: 10.1007/s11418-018-1262-2 [DOI] [PubMed] [Google Scholar]
- 15.Saneja A, Arora D, Kumar R, Dubey RD, Panda AK, Gupta PN. Therapeutic applications of betulinic acid nanoformulations. Ann N Y Acad Sci. 2018;1421(1):5–18. doi: 10.1111/nyas.13570 [DOI] [PubMed] [Google Scholar]
- 16.Saneja A, Sharma L, Dubey RD, et al. Synthesis, characterization and augmented anticancer potential of PEG-betulinic acid conjugate. Mater Sci Eng C Mater Biol Appl. 2017;73:616–626. doi: 10.1016/j.msec.2016.12.109 [DOI] [PubMed] [Google Scholar]
- 17.Saneja A, Kumar R, Singh A, et al. Development and evaluation of long-circulating nanoparticles loaded with betulinic acid for improved anti-tumor efficacy. Int J Pharm. 2017;531(1):153–166. doi: 10.1016/j.ijpharm.2017.08.076 [DOI] [PubMed] [Google Scholar]
- 18.Oladimeji O, Akinyelu J, Daniels A, Singh M. Modified gold nanoparticles for efficient delivery of Betulinic acid to cancer cell mitochondria. Int J Mol Sci. 2021;22(10):10. doi: 10.3390/ijms22105072 [DOI] [PMC free article] [PubMed] [Google Scholar]
- 19.Pramanik S, Sali V. Connecting the dots in drug delivery: a tour d’horizon of chitosan-based nanocarriers system. Int J Biol Macromol. 2021;169:103–121. doi: 10.1016/j.ijbiomac.2020.12.083 [DOI] [PubMed] [Google Scholar]
- 20.Boominathan T, Sivaramakrishna A. Recent advances in the synthesis, properties, and applications of modified chitosan derivatives: challenges and opportunities. Top Curr Chem. 2021;379(3):19. doi: 10.1007/s41061-021-00331-z [DOI] [PubMed] [Google Scholar]
- 21.Muxika A, Etxabide A, Uranga J, Guerrero P, de la Caba K. Chitosan as a bioactive polymer: processing, properties and applications. Int J Biol Macromol. 2017;105(Pt 2):1358–1368. doi: 10.1016/j.ijbiomac.2017.07.087 [DOI] [PubMed] [Google Scholar]
- 22.Abd El-Hack ME, El-Saadony MT, Shafi ME, et al. Antimicrobial and antioxidant properties of chitosan and its derivatives and their applications: a review. Int J Biol Macromol. 2020;164:2726–2744. doi: 10.1016/j.ijbiomac.2020.08.153 [DOI] [PubMed] [Google Scholar]
- 23.Li M, Wang Y, Jiang S, et al. Biodistribution and biocompatibility of glycyrrhetinic acid and galactose-modified chitosan nanoparticles as a novel targeting vehicle for hepatocellular carcinoma. Nanomedicine. 2020;15(2):145–161. doi: 10.2217/nnm-2018-0455 [DOI] [PubMed] [Google Scholar]
- 24.Kong F, Tang C, Yin C. Benzylguanidine and galactose double-conjugated chitosan nanoparticles with reduction responsiveness for targeted delivery of doxorubicin to CXCR 4 positive tumors. Bioconjug Chem. 2020;31(10):2446–2455. doi: 10.1021/acs.bioconjchem.0c00496 [DOI] [PubMed] [Google Scholar]
- 25.Kato Y, Onishi H, Machida Y. Biological characteristics of lactosaminated N-succinyl-chitosan as a liver-specific drug carrier in mice. J Control Release. 2001;70(3):295–307. doi: 10.1016/S0168-3659(00)00356-4 [DOI] [PubMed] [Google Scholar]
- 26.Liang M, Zheng X, Tu L, et al. The liver-targeting study of the N-galactosylated chitosan in vivo and in vitro. Artif Cells, Nanomed Biotechnol. 2014;42(6):423–428. doi: 10.3109/21691401.2013.841173 [DOI] [PubMed] [Google Scholar]
- 27.Mohammadi Z, Eini M, Rastegari A, Tehrani MR. Chitosan as a machine for biomolecule delivery: a review. Carbohydr Polym. 2021;256:117414. doi: 10.1016/j.carbpol.2020.117414 [DOI] [PubMed] [Google Scholar]
- 28.Kim TH, Jiang HL, Nah JW, Cho MH, Akaike T, Cho CS. Receptor-mediated gene delivery using chemically modified chitosan. Biomed Mater. 2007;2(3):S95–100. doi: 10.1088/1748-6041/2/3/s02 [DOI] [PubMed] [Google Scholar]
- 29.Park IK, Yang J, Jeong HJ, et al. Galactosylated chitosan as a synthetic extracellular matrix for hepatocytes attachment. Biomaterials. 2003;24(13):2331–2337. doi: 10.1016/s0142-9612(03)00108-x [DOI] [PubMed] [Google Scholar]
- 30.Fatouh AM, Elshafeey AH, Abdelbary A. Galactosylated chitosan coated liposomes of ledipasvir for liver targeting: chemical synthesis, statistical optimization, in-vitro and in-vivo evaluation. J Pharm Sci. 2021;110(3):1148–1159. doi: 10.1016/j.xphs.2020.10.002 [DOI] [PubMed] [Google Scholar]
- 31.Desai KG. Chitosan nanoparticles prepared by ionotropic gelation: an overview of recent advances. Crit Rev Ther Drug Carrier Syst. 2016;33(2):107–158. doi: 10.1615/CritRevTherDrugCarrierSyst.2016014850 [DOI] [PubMed] [Google Scholar]
- 32.Zhou N, Zan X, Wang Z, et al. Galactosylated chitosan-polycaprolactone nanoparticles for hepatocyte-targeted delivery of curcumin. Carbohydr Polym. 2013;94(1):420–429. doi: 10.1016/j.carbpol.2013.01.014 [DOI] [PubMed] [Google Scholar]
- 33.Kim DG, Jeong YI, Choi C, et al. Retinol-encapsulated low molecular water-soluble chitosan nanoparticles. Int J Pharm. 2006;319(1–2):130–138. doi: 10.1016/j.ijpharm.2006.03.040 [DOI] [PubMed] [Google Scholar]
- 34.Das RK, Kasoju N, Bora U. Encapsulation of curcumin in alginate-chitosan-pluronic composite nanoparticles for delivery to cancer cells. Nanomedicine. 2010;6(1):153–160. doi: 10.1016/j.nano.2009.05.009 [DOI] [PubMed] [Google Scholar]
- 35.Qiao JB, Fan QQ, Xing L, et al. Vitamin A-decorated biocompatible micelles for chemogene therapy of liver fibrosis. J Control Release. 2018;283:113–125. doi: 10.1016/j.jconrel.2018.05.032 [DOI] [PubMed] [Google Scholar]
- 36.Zheng D, Duan C, Zhang D, et al. Galactosylated chitosan nanoparticles for hepatocyte-targeted delivery of oridonin. Int J Pharm. 2012;436(1–2):379–386. doi: 10.1016/j.ijpharm.2012.06.039 [DOI] [PubMed] [Google Scholar]
- 37.Wang Q, Zhang L, Hu W, et al. Norcantharidin-associated galactosylated chitosan nanoparticles for hepatocyte-targeted delivery. Nanomedicine. 2010;6(2):371–381. doi: 10.1016/j.nano.2009.07.006 [DOI] [PubMed] [Google Scholar]
- 38.Song B, Zhang W, Peng R, et al. Synthesis and cell activity of novel galactosylated chitosan as a gene carrier. Colloids Surf B Biointerfaces. 2009;70(2):181–186. doi: 10.1016/j.colsurfb.2008.12.018 [DOI] [PubMed] [Google Scholar]
- 39.Zhang T, Yu YY, Li D, et al. Synthesis and properties of a novel methoxy poly(ethylene glycol)-modified galactosylated chitosan derivative. J Mater Sci Mater Med. 2009;20(3):673–680. doi: 10.1007/s10856-008-3620-1 [DOI] [PubMed] [Google Scholar]
- 40.Kim TH, Park IK, Nah JW, Choi YJ, Cho CS. Galactosylated chitosan/DNA nanoparticles prepared using water-soluble chitosan as a gene carrier. Biomaterials. 2004;25(17):3783–3792. doi: 10.1016/j.biomaterials.2003.10.063 [DOI] [PubMed] [Google Scholar]
- 41.Zhang J, Tang C, Yin C. Galactosylated trimethyl chitosan-cysteine nanoparticles loaded with Map4k4 siRNA for targeting activated macrophages. Biomaterials. 2013;34(14):3667–3677. doi: 10.1016/j.biomaterials.2013.01.079 [DOI] [PubMed] [Google Scholar]
- 42.Cai Y, Lapitsky Y. Pitfalls in analyzing release from chitosan/tripolyphosphate micro- and nanoparticles. Eur J Pharm Biopharm. 2019;142:204–215. doi: 10.1016/j.ejpb.2019.06.020 [DOI] [PubMed] [Google Scholar]
- 43.Bharathala S, Singh R, Sharma P. Controlled release and enhanced biological activity of chitosan-fabricated carbenoxolone nanoparticles. Int J Biol Macromol. 2020;164:45–52. doi: 10.1016/j.ijbiomac.2020.07.086 [DOI] [PubMed] [Google Scholar]
- 44.Natarajan JV, Nugraha C, Ng XW, Venkatraman S. Sustained-release from nanocarriers: a review. J Control Release. 2014;193:122–138. doi: 10.1016/j.jconrel.2014.05.029 [DOI] [PubMed] [Google Scholar]
- 45.Paul DR. Elaborations on the Higuchi model for drug delivery. Int J Pharm. 2011;418(1):13–17. doi: 10.1016/j.ijpharm.2010.10.037 [DOI] [PubMed] [Google Scholar]
- 46.Siepmann J, Peppas NA. Higuchi equation: derivation, applications, use and misuse. Int J Pharm. 2011;418(1):6–12. doi: 10.1016/j.ijpharm.2011.03.051 [DOI] [PubMed] [Google Scholar]
- 47.Wang K, Xu J, Liu Y, et al. Self-assembled Angelica sinensis polysaccharide nanoparticles with an instinctive liver-targeting ability as a drug carrier for acute alcoholic liver damage protection. Int J Pharm. 2020;577:118996. doi: 10.1016/j.ijpharm.2019.118996 [DOI] [PubMed] [Google Scholar]
- 48.Liu XY, Li D, Li TY, Wu YL, Piao JS, Piao MG. Vitamin A - modified Betulin polymer micelles with hepatic targeting capability for hepatic fibrosis protection. Eur J Pharmaceut Sci. 2022;174:106189. doi: 10.1016/j.ejps.2022.106189 [DOI] [PubMed] [Google Scholar]
- 49.Qiao JB, Fan QQ, Zhang CL, et al. Hyperbranched lipoid-based lipid nanoparticles for bidirectional regulation of collagen accumulation in liver fibrosis. J Control Release. 2020;321:629–640. doi: 10.1016/j.jconrel.2020.02.049 [DOI] [PubMed] [Google Scholar]
- 50.Fan QQ, Zhang CL, Qiao JB, et al. Extracellular matrix-penetrating nanodrill micelles for liver fibrosis therapy. Biomaterials. 2020;230:119616. doi: 10.1016/j.biomaterials.2019.119616 [DOI] [PubMed] [Google Scholar]
- 51.Pan TL, Wang PW, Hung CF, Aljuffali IA, Dai YS, Fang JY. The impact of retinol loading and surface charge on the hepatic delivery of lipid nanoparticles. Colloids Surf B Biointerfaces. 2016;141:584–594. doi: 10.1016/j.colsurfb.2016.02.029 [DOI] [PubMed] [Google Scholar]
- 52.Zhou JE, Sun L, Liu L, et al. Hepatic macrophage targeted siRNA lipid nanoparticles treat non-alcoholic steatohepatitis. J Control Release. 2022;343:175–186. doi: 10.1016/j.jconrel.2022.01.038 [DOI] [PubMed] [Google Scholar]
- 53.Teng W, Zhao L, Yang S, et al. The hepatic-targeted, resveratrol loaded nanoparticles for relief of high fat diet-induced nonalcoholic fatty liver disease. J Control Release. 2019;307:139–149. doi: 10.1016/j.jconrel.2019.06.023 [DOI] [PubMed] [Google Scholar]
- 54.Morsy MA, Nair AB. Prevention of rat liver fibrosis by selective targeting of hepatic stellate cells using hesperidin carriers. Int J Pharm. 2018;552(1–2):241–250. doi: 10.1016/j.ijpharm.2018.10.003 [DOI] [PubMed] [Google Scholar]
- 55.Wang J, Ding Y, Zhou W. Albumin self-modified liposomes for hepatic fibrosis therapy via SPARC-dependent pathways. Int J Pharm. 2020;574:118940. doi: 10.1016/j.ijpharm.2019.118940 [DOI] [PubMed] [Google Scholar]
- 56.de Carvalho TG, Garcia VB, de Araújo AA, et al. Spherical neutral gold nanoparticles improve anti-inflammatory response, oxidative stress and fibrosis in alcohol-methamphetamine-induced liver injury in rats. Int J Pharm. 2018;548(1):1–14. doi: 10.1016/j.ijpharm.2018.06.008 [DOI] [PubMed] [Google Scholar]
- 57.Roehlen N, Crouchet E, Baumert TF. Liver fibrosis: mechanistic concepts and therapeutic perspectives. Cells. 2020;9(4):875. doi: 10.3390/cells9040875 [DOI] [PMC free article] [PubMed] [Google Scholar]
- 58.Lin L, Zhou F, Shen S, Zhang T. Fighting liver fibrosis with naturally occurring antioxidants. Planta Med. 2018;84(18):1318–1333. doi: 10.1055/a-0757-0008 [DOI] [PubMed] [Google Scholar]
- 59.Jain NK, Jain SK. Development and in vitro characterization of galactosylated low molecular weight chitosan nanoparticles bearing doxorubicin. AAPS PharmSciTech. 2010;11(2):686–697. doi: 10.1208/s12249-010-9422-z [DOI] [PMC free article] [PubMed] [Google Scholar]
- 60.Sun H, Jiao R, An G, Xu H, Wang D. Influence of particle size on the aggregation behavior of nanoparticles: role of structural hydration layer. J Environ Sci. 2021;103:33–42. doi: 10.1016/j.jes.2020.10.007 [DOI] [PubMed] [Google Scholar]
- 61.Yang KJ, Son J, Jung SY, et al. Optimized phospholipid-based nanoparticles for inner ear drug delivery and therapy. Biomaterials. 2018;171:133–143. doi: 10.1016/j.biomaterials.2018.04.038 [DOI] [PubMed] [Google Scholar]
- 62.Donahue ND, Acar H, Wilhelm S. Concepts of nanoparticle cellular uptake, intracellular trafficking, and kinetics in nanomedicine. Adv Drug Deliv Rev. 2019;143:68–96. doi: 10.1016/j.addr.2019.04.008 [DOI] [PubMed] [Google Scholar]
- 63.Algar WR, Prasuhn DE, Stewart MH, et al. The controlled display of biomolecules on nanoparticles: a challenge suited to bioorthogonal chemistry. Bioconjug Chem. 2011;22(5):825–858. doi: 10.1021/bc200065z [DOI] [PubMed] [Google Scholar]
- 64.Wolfram J, Zhu M, Yang Y, et al. Safety of nanoparticles in medicine. Curr Drug Targets. 2015;16(14):1671–1681. doi: 10.2174/1389450115666140804124808 [DOI] [PMC free article] [PubMed] [Google Scholar]


