

Abstract
Coherent anti-Stokes Raman spectroscopy (CARS) is a technique classically employed by chemists and physicists to produce a coherent signal of signature vibrations of molecules. However, these vibrational signatures are also characteristic of molecules within anatomical tissue such as the brain, making it increasingly useful and applicable for Neuroscience applications. For example, CARS can measure lipids by specifically exciting chemical bonds within these molecules, allowing for quantification of different aspects of tissue, such as myelin involved in neurotransmission. In addition, compared to other techniques typically used to quantify myelin, CARS can also be set up to be compatible with immunofluorescent techniques, allowing for co-labeling with other markers such as sodium channels or other components of synaptic transmission. Myelination changes as an inherently important mechanism in demyelinating diseases such as multiple sclerosis or other neurological conditions such as Fragile X Syndrome or autism spectrum disorders is an emerging area of research. In conclusion, CARS can be utilized in innovative ways to answer pressing questions in Neuroscience and provide evidence for underlying mechanisms related to many different neurological conditions.
SUMMARY:
Visualizing myelination is an important goal for many researchers studying the nervous system. CARS is a technique that is compatible with immunofluorescence that can natively image lipids within tissue such as the brain illuminating specialized structures such as myelin.
INTRODUCTION:
Action potentials are the basic unit of information in the brain, and action potential propagation through axons forms one pillar of information processing 1–3. Neurons typically receive afferent inputs from multiple other neurons and integrate these inputs within a given narrow time window4, 5. Therefore, the mechanisms of action potential propagation in axons have received a significant amount of attention from investigators.
When propagating through an axon, an action potential is regenerated repeatedly along the axon to ensure reliable propagation6. In most neurons of jawed vertebrates (gnathostomes) axons are surrounded by a sheath of myelin, which is a lipid-rich substance produced by nearby oligodendrocytes or Schwann cells, which are types of glial cells (reviewed in 7, 8). This myelin sheath electrically insulates the axon, reducing its capacitance and allowing action potential propagation efficiently, quickly, and with lower energy consumption. Myelin does not cover the axon uniformly, but it sheaths the axon in segments that have short gaps in between them, called the nodes of Ranvier (reviewed in 9, 10). Both myelination thickness, which controls the level of electrical insulation of an axon, and the spacing of the nodes of Ranvier, which control the frequency with which action potentials are regenerated along an axon, influence the speed of action potential propagation (reviewed in 11).
There is a large body of literature suggesting that myelination thickness affects the speed of action potential propagation in axons12–14. Moreover, alterations in axon myelination can result in a number of CNS deficits15–21. It is therefore not surprising that the focus of many research efforts involves the measurement and characterization of axon myelination. Measurements of myelin thickness have most commonly been done with electron microscopy, a technique which requires a significant amount of tissue preparation and is challenging to use in combination with immunohistochemistry. However, there is also a faster and simpler technique to measure axon myelination which is based on Coherent Anti-Stokes Raman Spectroscopy (CARS). A CARS laser can be tuned to various frequencies and when tuned to frequencies that are suitable to excite lipids, myelin can be imaged without the need for any additional labels22. The lipid imaging can be combined with standard immunohistochemistry such that lipids can be imaged together with several fluorescent channels23. Imaging myelination with CARS is significantly faster than electron microscopy and has a resolution that is, albeit lower than EM, sufficient to detect even small differences in myelination in the same type of axons.
PROTOCOL:
All experiments complied with all applicable laws, National Institutes of Health guidelines, and were approved by the University of Colorado Anschutz Institutional Animal Care and Use Committee.
1. Animals
All experiments were conducted in C57BL/6J (stock #000664) mice (Mus musculus) obtained from The Jackson Laboratory or Mongolian gerbils (Meriones unguiculatus) originally obtained from Charles River.
2. Tissue preparation
-
2.1
For transcardial perfusion, overdose rodent species of interest with pentobarbital (120 mg/kg body weight) and transcardially perfuse them with phosphate-buffered saline (PBS; 137 mM NaCl, 2.7 mM KCl, 1.76 mM KH2PO4, 10 mM Na2HPO4 ) followed by 4% paraformaldehyde (PFA)24.
-
2.1.1
Specifically, open the abdomen and the rib cage using scissors and hold the rib cage in place with kelly hemostatic forceps to expose the heart.
-
2.1.2
Insert a 23 GA needle connected to a perfusion pump into the left ventricle and quickly cut the right atrium using fine scissors.
-
2.1.3
Administer PBS through the perfusion pump and the needle in the heart for ten minutes to clear the brain and body of blood.
-
2.1.4
Switch the perfusion pump to 4% PFA for ten minutes and check for rigidity of limbs and tail to confirm successful perfusion.
-
2.1.1
-
2.2
After perfusion, decapitate the animals and remove their brain from the skull. Keep the brains overnight in 4% PFA before transferring to PBS. Embed brainstems in 4% agarose (in PBS) and slice coronally using a Vibratome at 200 μm thickness
3. Staining
-
3.1
Stain free floating sections for Nissl, to visualize cell bodies (1:100), in antibody media (AB media: 0.1 M phosphate buffer (PB: 50 mM KH2PO4, 150 mM Na2HPO4), 150 mM NaCL, 3 mM Triton-X, 1% bovine serum albumin (BSA)) for thirty minutes at room temperature on a standard laboratory shaker25
NOTE: sections should be protected from light using aluminum foil and/or a cover. 550 nm or below wavelengths are compatible with CARS imaging.
NOTE: while we do not expect that Triton-X or other reagents has an impact on CARS imaging of lipids, additional controls with specific antibody media may be warranted.
-
3.2
PAUSE POINT: Free floating sections can then be stored (while protected from light) in PBS until imaging. Once sectioned, image brain sections within two weeks.
4. Imaging
The CARS laser set up contains a fiber laser which provides the 80MHz clock, and an OPO (Optical Parametric Oscillator) laser with a tunable range of 770–990 nm with stokes beam fixed at 1031 nm, which are needed for collecting the CARS signal. There is one aperture for both beams.
-
4.1
Before bringing samples to the microscope, turn on and warm up CARS laser for at least 1 hour, align CARS laser, and Koehler the condenser optics and the diaphragm of the microscope for forward CARS imaging.
NOTE: this step is critical for proper function of CARS microscopy and would be well suited for video.
-
4.1.1
For spatial alignment of the two laser beams (pump and stokes) there are two internal PSDs (position sensitive detectors) that can be accessed via CARS laser GUI.
-
4.1.2
Achieve temporal alignment by using the delay function in the CARS laser GUI which can help overlap the pulses of the two lasers (pump and stokes) that have different dispersions because of their different wavelengths. Therefore, both the temporal and spatial overlapping of the pump and stokes beams are done with the user input through the GUI.
-
4.1.3
Adjust the external periscope (last two mirrors of the setup) to center the spatially overlapped two lasers onto the scanning head mirrors of the microscope.
-
4.1.4
For best forward CARS non-descanned detection make sure the condenser is Koehler-ed (meaning the condenser is centered and focused onto the diaphragm to achieve uniform illumination)
-
4.1.1
-
4.2
For immunofluorescence confocal imaging and CARS imaging, fit the CARS laser, with with both forward and epi CARS non-descanned detectors (NDDs), by incorporating a confocal microscope equipped with visible lasers for fluorescence imaging
-
4.3
Place sections in a culture dish with coverslip (for inverted microscopy), PBS to avoid the tissue drying out, and glass weight to keep tissue near coverslip.
-
4.4
Take z-stacks or single images with a 60X, 1.2NA infrared corrected water objective which serves for collection of the CARS signal in the epi direction and through a 0.55NA condenser in the forward direction for imaging brain areas such as the medial nucleus of the trazepoid body (MNTB).
-
4.4.1
Take the CARS images at approximately 600 mW pump/probe and 300 mW Stokes, by using the CARS laser GUI. These laser power values are measured internally by the system. Both lasers’ powers at the sample location are less than 25mW and safe for the tissue sample.
-
4.4.2
Overlap the pump and Stokes beams spatially and temporally. Tune the OPO to 797.2 nm. This yields a CARS wavelength of 650nm. Because of the higher energy level, the resulting return to the ground state is anti-Stokes (blue shifted) to the excitation.
-
4.4.3
Capture the CARS signal in epi or forward non-descanned detectors using bandpass filters (640–680nm) followed by sequential detection of the immunofluorescence label (in this instance fluorescently labeled Nissl).
NOTE: The Nissl neuronal soma marker is not caught in the CARS 640–680 nm bandpass filter, allowing combination of fluorescence and CARS imaging in the images presented below.
-
4.4.4
The CARS and fluorescence do not share PMTs. Use these settings for optimal lipid signal to selectively image myelination in your brain area.
CAUTION: shield the user from the laser beam
-
4.4.1
-
4.5
Save images as .oib files which can be imported into an image analysis program for further quantification.
REPRESENTATIVE RESULTS:
One of the biggest advantages of CARS microscopy over other techniques is the compatibility with fluorescent imaging23. Figure 1 shows the CARS spectra compared to Nissl tagged with immunofluorescent marker showing little/no overlap in spectra. Figure 2 illustrates the laser set up for CARS in combination with confocal microscopy. Figure 3 demonstrates two representative images, one as a single stack and one z-stack max projection from gerbil and mouse that might be obtained using CARS imaging showing both cell bodies (cyan) and myelin signal (magenta)(scale bar 20 μM).
Figure 1,
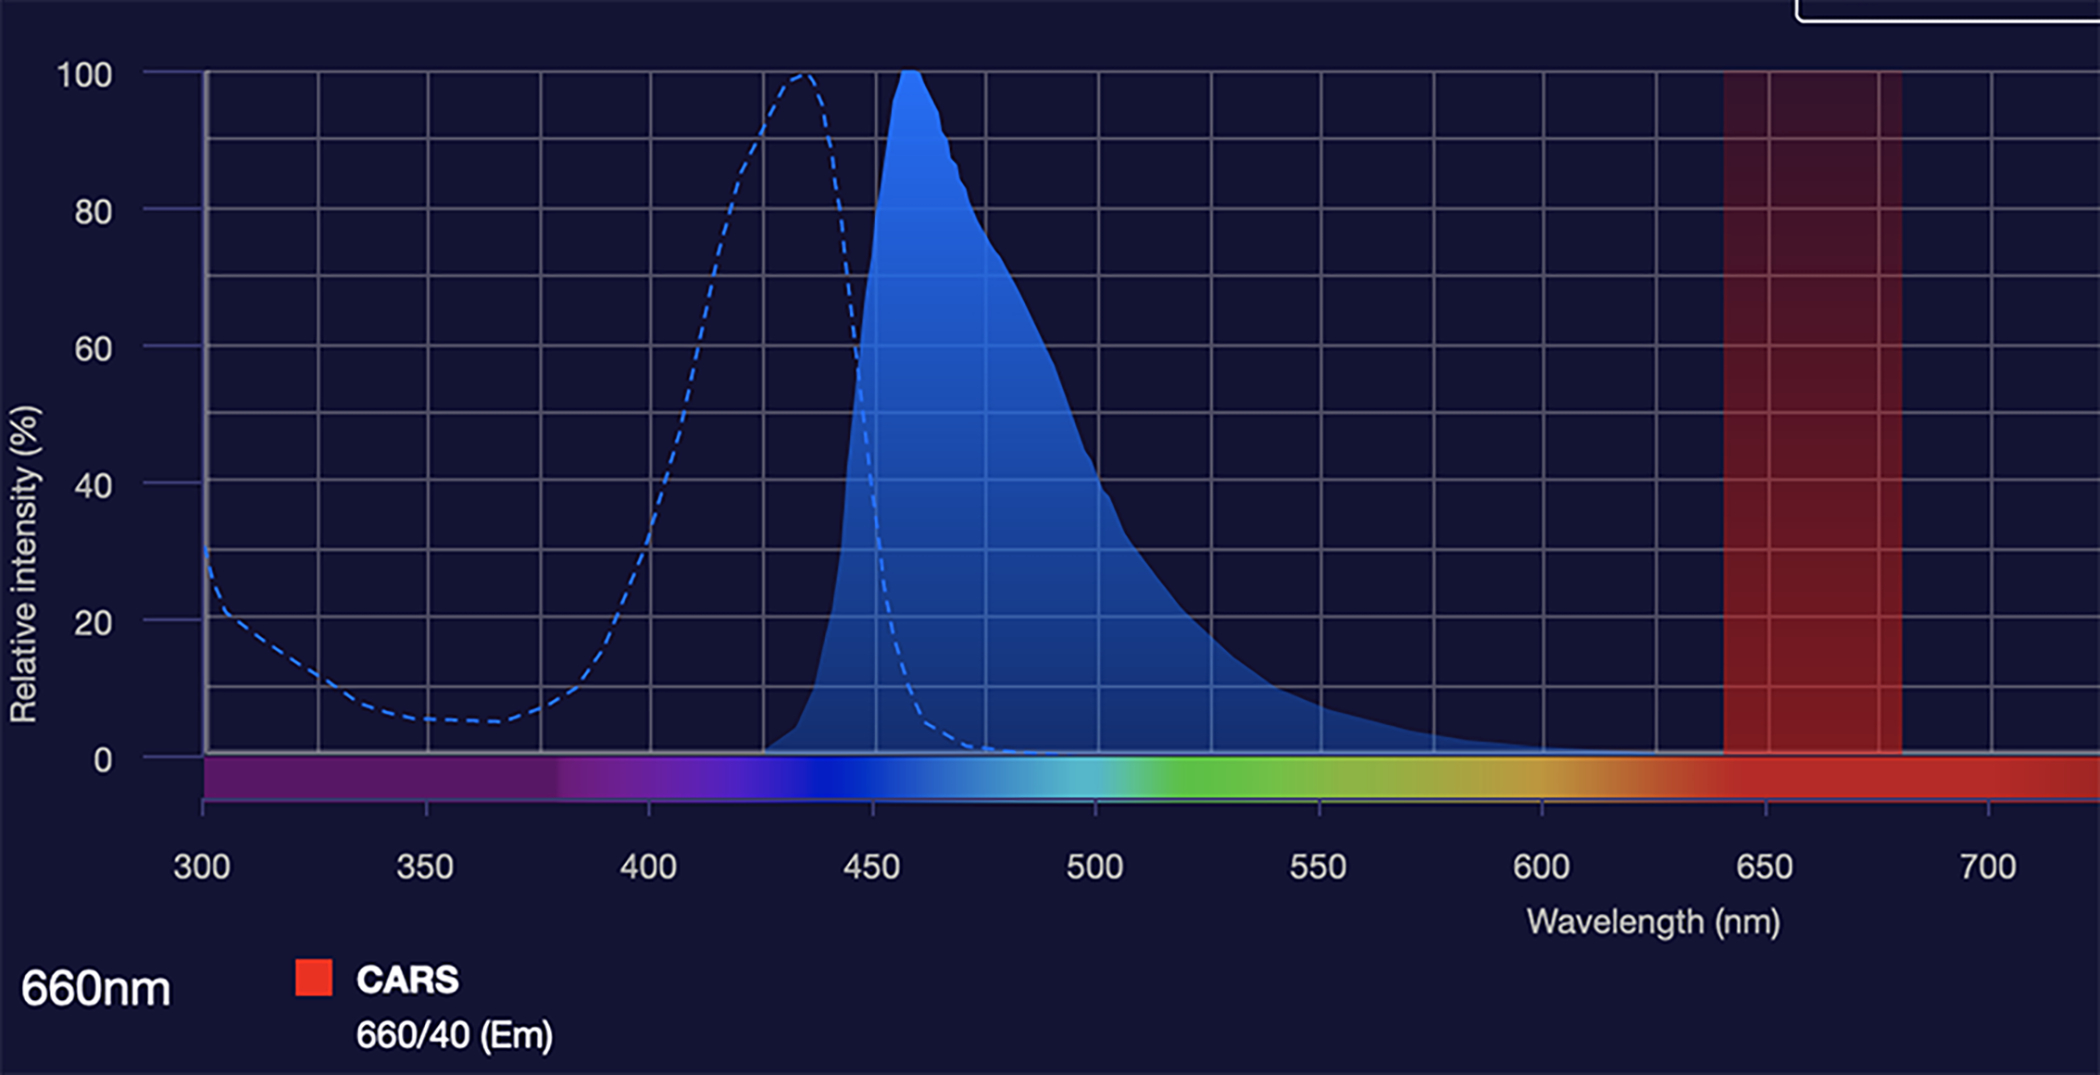
CARS imaging can be combined with immunofluorescent imaging. The graphs shows that CARS imaging occurs at 660/640 nm red signal spectrum26. This wavelength is sufficiently far removed from the green, blue, or UV range, allowing for combination of the CARS signal with immunofluorescence in these ranges. Specifically, the graph also indicates the excitation and emission for Nissl tagged with blue fluorophore, which was combined with CARS during the collection of representative results for this publication.
Figure 2,

CARS instrument diagram showing CARS lasers (red arrows) and non-descanned (NDD) epi and forward detection incorporated onto a laser scanning confocal. In forward NDD we acquire CARS for C-H bonds (dark red arrows) and SHG (second harmonic generatioin) at 515nm (orange arrow). In epi NDD we acquire CARS for C-H bonds (dark red arrows) and 2PE (two-photon emission) autofluorescence (light blue arrow). Sequentialy, fluorescence confocal images can be acquired (green arrows for visible laser, blue arrows for confocal detection).
Figure 3,

CARS can illuminate myelin (magenta) in brain tissue (brainstem) while also imaging Nissl (cyan) or fluorescent markers. The two panels show representative results from a Mongolian gerbil (single image M. unguiculatus, Fig. 3 A, C, E) and mouse (z-stack max projection M. musculus, Fig 2 B, D, F) brain, indicating that this technique can be used across species. Fig 3A and B showing Nissl in cyan, C and D show the CARS signal in magenta, E and F combine the Nissl and CARS signals with each panel for gerbil or mouse respectively. Both sets of images show a section of the medial nucleus of the trapezoid body (MNTB) in the brain stem. Neurons in the MNTB receive inputs from heavily myelinated axons which terminate in the calyx of held, a type of giant synapse27. Scale bar is 20 microns.
DISCUSSION:
A growing body of literature emphasizes the role of myelin in brain function13, 16, 21, 28. Moreover, we know that myelination thickness and myelination pattern can change in several neurological conditions such multiple sclerosis (reviewed in 29), aging (reviewed in 30), autism20, 31, and many others. It is therefore not surprising that more and more investigators need to assess myelination across brain tissues and animal models, in several medical conditions, and in a growing number of experimental situations. Traditional methods to image myelination in brain tissue include antibody labeling followed by light microscopy, and electron microscopy (EM). Both techniques are time consuming and require multi-step tissue preparation protocols which are associated with possible errors and changes to tissue composition. We demonstrated an alternative method which can yield similar results much quicker due to the ability to image myelin much faster, and which can be combined with additional fluorescence light microscopy. Importantly, this technique can be used to image lipids in brain tissue without the need for additional markers or labels. This technique does not only allow for the imaging of myelin along intact axons, but it allows for the imaging of myelin breakdown products such as plaques or liquid droplets32 which have been shown to occur, for example, in multiple sclerosis33.
The frequency to which the CARS laser was tuned was suitable to bias the image heavily in favor of lipids, resulting in overall high-quality images of myelination, since myelin is by far the most common lipid-rich substance in the brain. The principle of this technique is that a CARS laser, which can be tuned to various frequencies, is tuned to 792.2 nm, which is a frequency suitable to excite CH2 bonds. These are abundant in lipids which contain long chains of CH2 groups linked by carbon-carbon bonds with one terminal carboxylic acid group at the end. Exciting lipids with this frequency resulted in a signal which could then be imaged with standard confocal microscope detection technology. The quality of the resulting images supports quantitative analyses that can either be done by a human observer or automated algorithms34. However, this method does not exclusively label myelin since CH2 bonds are not exclusive to myelin, and therefore CARS is less specific than an antibody would be. As a result, the images show some label which is not associated with myelin. Importantly, this background label does not compromise the quality of the measurements or the ability to for quantitative analyses.
The resolution of CARS imaging is diffraction limited and similar to two photon microscopy (~250nm) and thus lower than that of EM. Therefore, investigators who aim to assess very small differences in myelination thickness as it occurs, for example, in certain medical conditions, need to be aware of this limitation. Additional EM controls in a small sample can confirm that the resolution is sufficient for their research aim.
One major advantage of CARS for imaging of myelin, besides the speed and ease, is the ability to combine the label-free lipid imaging with fluorescence confocal microscopy. Depending on the microscope that is used for CARS, two or even three additional channels can be imaged such myelin imaging can be combined with antibody labeling, Nissl stain, transgenic mouse lines expressing fluorescent proteins, or similar. Potential limitations using longer wavelength fluorophore are mostly because the CARS signal is observed through 640nm-680nm bandpass filters that can catch the emission of green and/or red fluorophores. However, the picosecond laser used for CARS excitation has a peak pulse energy of ~10 times less than standard femtosecond laser used for two-photon excitation, translated into ~100 less fluorescence. Moreover, the 797.2nm pulse picosecond laser used for CARS excitation is spectrally far from the peak of the two-photon cross-section absorption of the visible fluorophores. Therefore, the CARS picosecond laser is very inefficient for two-photon excitation of visible fluorophores, making the fluorescent signal negligible for crossing into CARS detection. However, this should be tested by imaging a negative control sample that doesn’t have any fluorescent labels compared with a sample with fluorescent markers.
In conclusion, CARS imaging is a suitable technique to image myelin in brain tissue. While the resolution is comparable to standard light microscopy and thus is lower than EM, the speed and ease of use make this technique an attractive alternative to existing methods.
ACKNOWLEDGMENTS:
Supported by NIH R01 DC 17924, R01 DC 18401 (Klug), and NIH 1R15HD105231–01, T32DC012280, and FRAXA (McCullagh). The CARS imaging was performed in the Advanced Light Microscopy Core part of the NeuroTechnology Center at the University of Colorado Anschutz Medical Campus supported in part by NIH P30 NS048154 and NIH P30 DK116073.
Footnotes
A complete version of this article that includes the video component is available at http://dx.doi.org/10.3791/64013.
DISCLOSURES:
The authors declare no conflicts of interest.
REFERENCES:
- 1.Cole K, Curtis H ELECTRIC IMPEDANCE OF THE SQUID GIANT AXON DURING ACTIVITY. The Journal of general physiology. doi: 10.1085/JGP.22.5.649 (1939). [DOI] [PMC free article] [PubMed] [Google Scholar]
- 2.Cole KS, Curtis HJ MEMBRANE POTENTIAL OF THE SQUID GIANT AXON DURING CURRENT FLOW. Journal of General Physiology. 24 (4), 551–563, doi: 10.1085/jgp.24.4.551 (1941). [DOI] [PMC free article] [PubMed] [Google Scholar]
- 3.Alcami P, El Hady A Axonal Computations. Frontiers in Cellular Neuroscience. 13, 413, doi: 10.3389/fncel.2019.00413 (2019). [DOI] [PMC free article] [PubMed] [Google Scholar]
- 4.Neumann E, Nachmansohn D Nerve Excitability—Toward an Integrating Concept. Aharon Katzir Memorial Volume. 99–166, doi: 10.1007/978-1-4684-7668-2_6 (1975). [DOI] [PubMed] [Google Scholar]
- 5.Waxman SG Integrative Properties and Design Principles of Axons. International Review of Neurobiology. 18, 1–40, doi: 10.1016/S0074-7742(08)60032-X (1975). [DOI] [PubMed] [Google Scholar]
- 6.Fitzhugh R Computation of impulse initiation and saltatory conduction in a myelinated nerve fiber. Biophysical Journal. 2, 11–21, doi: 10.1016/s0006-3495(62)86837-4 (1962). [DOI] [PMC free article] [PubMed] [Google Scholar]
- 7.Zalc B The acquisition of myelin: a success story. Novartis Foundation Symposium. 276, 15–21; discussion 21–25, 54–57, 275–281, doi: 10.1002/9780470032244.ch3 (2006). [DOI] [PubMed] [Google Scholar]
- 8.Salzer JL, Zalc B Myelination. Current biology: CB. 26 (20), R971–R975, doi: 10.1016/j.cub.2016.07.074 (2016). [DOI] [PubMed] [Google Scholar]
- 9.Boullerne AI The history of myelin. Experimental Neurology. 283 (Pt B), 431–445, doi: 10.1016/j.expneurol.2016.06.005 (2016). [DOI] [PMC free article] [PubMed] [Google Scholar]
- 10.Kuhn S, Gritti L, Crooks D, Dombrowski Y Oligodendrocytes in Development, Myelin Generation and Beyond. Cells. 8 (11), E1424, doi: 10.3390/cells8111424 (2019). [DOI] [PMC free article] [PubMed] [Google Scholar]
- 11.Saab AS, Nave K-A Myelin dynamics: protecting and shaping neuronal functions. Current Opinion in Neurobiology. 47, 104–112, doi: 10.1016/j.conb.2017.09.013 (2017). [DOI] [PubMed] [Google Scholar]
- 12.Chomiak T, Hu B What Is the Optimal Value of the g-Ratio for Myelinated Fibers in the Rat CNS? A Theoretical Approach. PLOS ONE. 4 (11), e7754, doi: 10.1371/journal.pone.0007754 (2009). [DOI] [PMC free article] [PubMed] [Google Scholar]
- 13.Ford MC et al. Tuning of Ranvier node and internode properties in myelinated axons to adjust action potential timing. Nature communications. 6, 8073, doi: 10.1038/ncomms9073 (2015). [DOI] [PMC free article] [PubMed] [Google Scholar]
- 14.Stange-Marten A et al. Input timing for spatial processing is precisely tuned via constant synaptic delays and myelination patterns in the auditory brainstem. Proceedings of the National Academy of Sciences of the United States of America. 114 (24), E4851–E4858, doi: 10.1073/pnas.1702290114 (2017). [DOI] [PMC free article] [PubMed] [Google Scholar]
- 15.Bu J, Banki A, Wu Q, Nishiyama A Increased NG2+ glial cell proliferation and oligodendrocyte generation in the hypomyelinating mutant shiverer. Glia. 48 (1), 51–63, doi: 10.1002/glia.20055 (2004). [DOI] [PubMed] [Google Scholar]
- 16.Pacey LKK et al. Delayed myelination in a mouse model of fragile X syndrome. Human Molecular Genetics. 22 (19), 3920–3930, doi: 10.1093/hmg/ddt246 (2013). [DOI] [PubMed] [Google Scholar]
- 17.Green AJ et al. Clemastine fumarate as a remyelinating therapy for multiple sclerosis (ReBUILD): a randomised, controlled, double-blind, crossover trial. Lancet (London, England). 390 (10111), 2481–2489, doi: 10.1016/S0140-6736(17)32346-2 (2017). [DOI] [PubMed] [Google Scholar]
- 18.Jeon SJ, Ryu JH, Bahn GH Altered Translational Control of Fragile X Mental Retardation Protein on Myelin Proteins in Neuropsychiatric Disorders. Biomolecules & therapeutics. 25 (3), 231–238, doi: 10.4062/biomolther.2016.042 (2017). [DOI] [PMC free article] [PubMed] [Google Scholar]
- 19.Barak B et al. Neuronal deletion of Gtf2i, associated with Williams syndrome, causes behavioral and myelin alterations rescuable by a remyelinating drug. Nature Neuroscience. 22 (5), 700–708, doi: 10.1038/s41593-019-0380-9 (2019). [DOI] [PubMed] [Google Scholar]
- 20.Phan BN et al. A myelin-related transcriptomic profile is shared by Pitt–Hopkins syndrome models and human autism spectrum disorder. Nature Neuroscience. 23 (3), 375–385, doi: 10.1038/s41593-019-0578-x (2020). [DOI] [PMC free article] [PubMed] [Google Scholar]
- 21.Lucas A, Poleg S, Klug A, McCullagh EA Myelination Deficits in the Auditory Brainstem of a Mouse Model of Fragile X Syndrome. Frontiers in Neuroscience. 15, 1536, doi: 10.3389/fnins.2021.772943 (2021). [DOI] [PMC free article] [PubMed] [Google Scholar]
- 22.Wang H, Fu Y, Zickmund P, Shi R, Cheng J-X Coherent Anti-Stokes Raman Scattering Imaging of Axonal Myelin in Live Spinal Tissues. Biophysical Journal. 89 (1), 581–591, doi: 10.1529/biophysj.105.061911 (2005). [DOI] [PMC free article] [PubMed] [Google Scholar]
- 23.Kim S-H et al. Multiplex Coherent Anti-Stokes Raman Spectroscopy Images Intact Atheromatous Lesions and Concomitantly Identifies Distinct Chemical Profiles of Atherosclerotic Lipids. Circulation Research. 106 (8), 1332–1341, doi: 10.1161/CIRCRESAHA.109.208678 (2010). [DOI] [PubMed] [Google Scholar]
- 24.Gage GJ, Kipke DR, Shain W Whole Animal Perfusion Fixation for Rodents. JoVE (Journal of Visualized Experiments). (65), e3564, doi: 10.3791/3564 (2012). [DOI] [PMC free article] [PubMed] [Google Scholar]
- 25.Tu L, Zhang N, Conde KM, Bean JC, Wang C, Xu Y Free-floating Immunostaining of Mouse Brains. JoVE (Journal of Visualized Experiments). (176), e62876, doi: 10.3791/62876 (2021). [DOI] [PMC free article] [PubMed] [Google Scholar]
- 26.Fluorescence SpectraViewer. at <https://www.thermofisher.com/order/fluorescence-spectraviewer>.
- 27.Held H Die centrale gehörleitung. Arch Anat Physiol Anat Abt. 17, 201–248 (1893). [Google Scholar]
- 28.Sherman DL, Brophy PJ Mechanisms of axon ensheathment and myelin growth. Nature Reviews Neuroscience. 6 (9), 683–690, doi: 10.1038/nrn1743 (2005). [DOI] [PubMed] [Google Scholar]
- 29.Gruchot J et al. The Molecular Basis for Remyelination Failure in Multiple Sclerosis. Cells. 8 (8), 825, doi: 10.3390/cells8080825 (2019). [DOI] [PMC free article] [PubMed] [Google Scholar]
- 30.Rivera AD, Azim K, Macchi V, Porzionato A, Butt AM, De Caro R Epidermal Growth Factor Pathway in the Age-Related Decline of Oligodendrocyte Regeneration. Frontiers in Cellular Neuroscience. 16, 838007, doi: 10.3389/fncel.2022.838007 (2022). [DOI] [PMC free article] [PubMed] [Google Scholar]
- 31.Kútna V, O’Leary VB, Hoschl C, Ovsepian SV Cerebellar demyelination and neurodegeneration associated with mTORC1 hyperactivity may contribute to the developmental onset of autism-like neurobehavioral phenotype in a rat model. Autism Research: Official Journal of the International Society for Autism Research. 15 (5), 791–805, doi: 10.1002/aur.2688 (2022). [DOI] [PubMed] [Google Scholar]
- 32.Ozsvár A et al. Quantitative analysis of lipid debris accumulation caused by cuprizone induced myelin degradation in different CNS areas. Brain Research Bulletin. 137, 277–284, doi: 10.1016/j.brainresbull.2018.01.003 (2018). [DOI] [PubMed] [Google Scholar]
- 33.Prineas JW, Graham JS Multiple sclerosis: capping of surface immunoglobulin G on macrophages engaged in myelin breakdown. Annals of Neurology. 10 (2), 149–158, doi: 10.1002/ana.410100205 (1981). [DOI] [PubMed] [Google Scholar]
- 34.Bégin S et al. Automated method for the segmentation and morphometry of nerve fibers in large-scale CARS images of spinal cord tissue. Biomedical Optics Express. 5 (12), 4145–17, doi: 10.1364/BOE.5.004145 (2014). [DOI] [PMC free article] [PubMed] [Google Scholar]