Abstract
Background and Objectives
Serum neurofilament light chain (sNfL) and optical coherence tomography (OCT)–derived retinal measures (including peripapillary retinal nerve fiber layer [pRNFL] and macular ganglion cell layer/inner plexiform layer [GCIPL] thickness) have been proposed as biomarkers of neurodegeneration in multiple sclerosis (MS). However, studies evaluating the associations between sNfL and OCT-derived retinal measures in MS are limited.
Methods
In this retrospective analysis of a longitudinal, observational, single-center cohort study, sNfL levels were measured in people with MS and healthy controls (HCs) using single molecule array. Participants with MS were followed with serial OCT for a median follow-up of 4.5 years. Eyes with optic neuritis (ON) within 6 months of baseline OCT or ON during follow-up were excluded. Age-normative cutoffs of sNfL were derived using the HC data, and MS participants with sNfL greater than the 97.5th percentile for age were classified as having elevated sNfL (sNfL-E). Analyses were performed with mixed-effects linear regression models and adjusted for age, sex, race, and history of ON.
Results
A total of 130 HCs (age: 42.4 ± 14.2 years; 62% female) and 403 people with MS (age: 43.1 ± 12.0 years; 78% female) were included. Elevated sNfL levels were present at baseline in 80 participants with MS (19.9%). At baseline, sNfL-E participants had modestly lower pRNFL (−3.03 ± 1.50 μm; p = 0.044) and GCIPL thickness (−2.74 ± 1.02 μm; p = 0.007). As compared with those with sNfL within the reference range, eyes from NfL-E participants exhibited faster longitudinal thinning of the pRNFL (45% faster; −0.74 vs −0.51 μm/y; p = 0.015) and GCIPL (25% faster; −0.35 vs −0.28 μm/y; p = 0.021). Significant differences in rates of pRNFL and GCIPL thinning between sNfL groups were found only in those with relapsing-remitting MS but not progressive MS.
Discussion
Elevated baseline sNfL is associated with accelerated rates of retinal neuroaxonal loss in relapsing-remitting MS, independent of overt ON, but may be less reflective of retinal neurodegeneration in progressive MS.
Multiple sclerosis (MS) is a disease of the CNS, with complex pathophysiologic underpinnings including adaptive and innate immune cell–driven inflammation and neurodegeneration.1 MS typically presents with an initial relapsing-remitting course, which is often followed by a progressive disease course. The former stage is considered to be driven primarily by inflammatory disease activity, whereas the latter stage seems to be related to neurodegenerative disease processes; however, these pathophysiologic processes overlap throughout the disease course, although their relative contributions to the clinical disease burden vary by stage.1,2
Serum neurofilament light chain (sNfL) has emerged as a promising early biomarker of neuroaxonal injury in MS, and elevated sNfL levels have been reported to be associated with inflammatory disease activity, as well as brain atrophy and disability progression.3,4 However, the extent to which sNfL reflects ongoing slow, diffuse neurodegenerative processes in MS remains less clear.5-7
Optical coherence tomography (OCT) allows the rapid quantification of the thickness of retinal neuroaxonal layers, and studies using OCT have demonstrated that rates of macular ganglion cell + inner plexiform layer (GCIPL) and peripapillary retinal nerve fiber layer (pRNFL) thinning are accelerated in people with MS, independently of overt episodes of inflammatory activity involving the anterior visual pathway (i.e., acute optic neuritis [ON]), and are associated with longitudinal brain atrophy.8-11 Furthermore, rates of retinal layer thinning are faster in progressive MS, as compared with relapsing-remitting MS (RRMS), with accelerated deeper retinal layer thinning (inner nuclear layer [INL] and outer nuclear layer [ONL]) appearing to be more specific features of progressive MS.10,12,13
Given the above, OCT-derived retinal measures have been proposed as a biomarker of progressive, diffuse neurodegeneration in MS and assessing associations with sNfL is clearly of significant interest. However, only a few studies have examined this issue and have produced conflicting findings. Notably, existing reports are limited because of small sample size, cross-sectional nature, and/or lack of sufficient follow-up.14-16
In this retrospective analysis of a longitudinal, observational cohort study, our main objective was to assess the association of sNfL with longitudinal rates of inner retinal layer change in a large MS cohort. We hypothesized that people with MS with abnormally elevated sNfL would exhibit increased severity of future retinal neuroaxonal loss, as evidenced by accelerated pRNFL and/or GCIPL thinning. As secondary objectives, we sought to determine whether these associations may vary in relapsing-remitting vs progressive MS and to examine associations of sNfL with deeper retinal layer thinning.
Methods
Study Design and Participants
Johns Hopkins University Institutional Review Board approval was obtained for the study protocol, and written informed consent was obtained from all participants. The data included in this study were collected between September 2008 and June 2019.
We included participants with MS based on the following inclusion criteria:
Diagnosis of MS, confirmed by the treating neurologist, according to the 2017 McDonald criteria (applied retrospectively to those recruited before 2017)17
Serum available that was collected within ±180 days of an OCT visit (baseline visit)
At least 1 additional visit with OCT scans available at >1 year after the baseline visit
Individuals with ON within 6 months of the baseline OCT, refractive errors of greater than ±6 diopters, history of ocular surgery, glaucoma, uncontrolled hypertension, diabetes, renal insufficiency, or other significant neurologic or ophthalmologic disorders were excluded from this study.18 Data from participants who developed clinical ON during the course of this study were censored at the last available OCT evaluation before the ON event. Disease subtype was classified as RRMS, primary progressive MS (PPMS), or secondary progressive MS (SPMS) by the treating neurologist.19
Healthy controls (HCs) were recruited for blood sampling from among Johns Hopkins University staff and patients' partners (self-reported to be free of any neurologic conditions with the exception of migraine and relevant comorbidities listed previously as exclusion criteria for participants with MS). Johns Hopkins University staff members live in a similar geographic area as our patient population and were recruited to have a similar range of ages (18–65 years) and sex ratio (roughly 70% female) as in a typical cohort of people with MS.
Serum Collection and sNfL Measurement
Serum was collected in tubes with clot activator and allowed to clot in an upright position for 30 minutes at room temperature and then centrifuged at 3,000 rpm for 10 minutes. Serum was divided into 500 μL aliquots and stored at −80°C. Samples were not thawed until sNfL measurement was performed.
Serum samples were shipped to Quanterix (Billerica, MA) on dry ice, and measurements were performed on a Simoa HD-1 Analyzer, using the Simoa NfL Advantage Assay Kit.20 On receipt, samples were stored at −80°C. Before analysis, samples were thawed at room temperature (approximately 30 minutes) and transferred to labeled Eppendorf tubes and centrifuged at 14,000g for 3 minutes to pellet any debris. Samples were subsequently analyzed on the Simoa HD-1 Analyzer.
Optical Coherence Tomography
Retinal imaging was performed with spectral domain OCT (Cirrus HD-OCT; Carl Zeiss Meditec, Dublin, CA), as previously described.21 Briefly, peripapillary and macular data were obtained with the Optic Disc Cube 200 × 200 protocol and Macular Cube 512 × 128 protocol, respectively. OCT scans underwent rigorous quality control, in accordance with OSCAR-IB criteria, and only scans passing the quality control process were included in the analyses.18,22
pRNFL thickness values were generated by conventional Cirrus HD-OCT software, as described in detail elsewhere.21 Automated macular segmentation was performed, as described in detail elsewhere.23 Previous studies have shown that measures derived from this OCT segmentation algorithm are highly reliable, not only cross-sectionally but also longitudinally, both in MS and HCs.24 Average thicknesses of the GCIPL, INL, outer plexiform layer (OPL), and ONL were calculated within an annulus, centered on the fovea, with an internal diameter of 1 mm and an external diameter of 5 mm. All macular cube scans and segmentations were reviewed to confirm the accuracy of the segmentation, and scans with severe segmentation errors were excluded from the analysis. OCT methods and results are reported in accordance with consensus APOSTEL recommendations.25
Statistical Methods
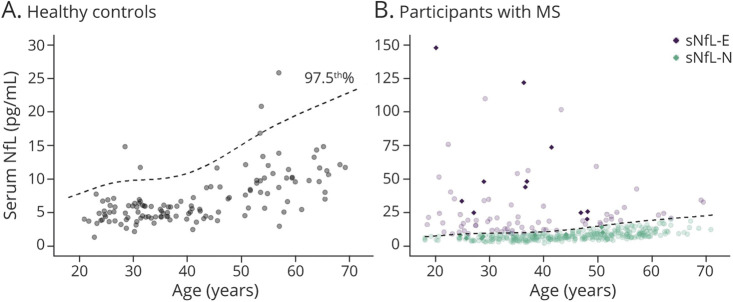
We used sNfL measurements from the HC cohort (n = 130; age [mean ± SD] 42.4 ± 14.2 years, 62% female, 74% White) to derive the age-normative 97.5th percentile using generalized additive models for location, scale, and shape (GAMLSS), and this curve was used to define elevated sNfL (sNfL-E) vs normal sNfL (sNfL-N) as shown in Figure 1.3,26,27 Furthermore, using this GAMLSS model, age-normative sNfL Z-scores were derived.
Figure 1. Scatterplot of Serum Neurofilament Light Chain vs Age in the Healthy Controls and MS Participants.
Scatterplot of sNfL by age in the healthy controls (A) and participants with MS (B). The superimposed dashed line is the age-adjusted 97.5th percentile curve that was estimated from the healthy controls and was used to determine elevated (sNfL-E) vs normal (sNfL-N) levels of sNfL. Data points from participants with recent relapse (within the 2 months preceding blood sampling) are depicted as solid diamonds. MS = multiple sclerosis; sNfL = serum neurofilament light chain.
Baseline demographics and clinical characteristics were compared using the 2-sample t test, χ2 test, and Wilcoxon rank sum test, as appropriate. Analyses of OCT measures at baseline were performed with mixed-effects linear regression models with random participant-specific intercepts and adjusted for age, sex, race, and history of ON. Longitudinal analyses were performed with mixed-effects linear regression models with random participant-specific and eye-specific random intercepts and random slopes in time, using time from baseline OCT visit (in years) as a continuous variable in both unadjusted models (including time, sNfL group, and their interaction) and models adjusted for the cross-sectional and longitudinal effects of covariates (baseline age, sex, race, and history of ON) by including these variables and their respective interactions with time. These models inherently account for correlation between repeated observations during follow-up for each eye, within-participant inter-eye correlation, and baseline retinal layer thicknesses. Analyses were also similarly performed including the age-normative sNfL Z-score as a continuous variable, using restricted cubic splines to assess for nonlinear relationships, which were formally compared with linear models using likelihood ratio tests.28,29 Restricted cubic spline models were fit with 4 knots, placed at the 5th, 35th, 65th and 95th percentiles of the Z-score distribution.28 Statistical analyses were performed with Stata 16 (StataCorp, College Station, TX) and R version 4.1.0.38 Statistical significance was defined as p < 0.05.
Data Availability
Anonymized data used for this study are available from the corresponding author on reasonable request, with the proper data sharing agreements in place.
Results
Study Population and Clinical Characteristics
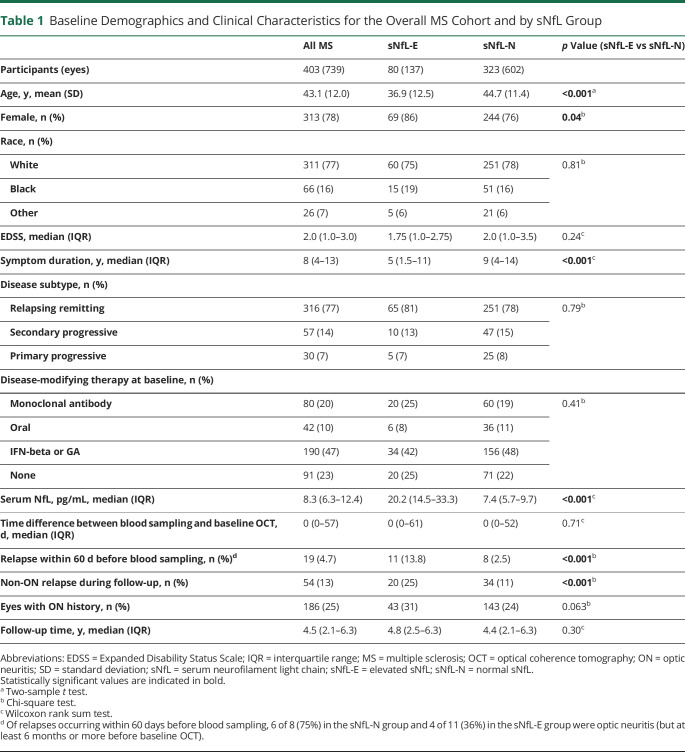
Demographics and clinical characteristics for the overall MS cohort and by sNfL groups are summarized in Table 1 and by MS disease subtype in Table 2. A total of 403 participants with MS (739 eyes) with a median follow-up of 4.5 years (interquartile range [IQR]: 2.1–6.3 years) were eligible for inclusion in this study. sNfL was also measured in 130 HCs (age: 42.4 ± 14.2 years; sex: 62% female; race: 74% White, 14% Black; 12% Other). Elevated sNfL levels above the age-normative 97.5th percentile (derived from the HCs) were present at baseline in 80 participants with MS (19.9%; Figure 1). Compared with sNfL-N participants, sNfL-E participants were younger (mean ± SD: 36.9 ± 12.5 years vs 44.7 ± 11.4 years; p < 0.001), with shorter disease duration (median [IQR]: 5 years [1.5–11] vs 9 years [4–14]; p < 0.001), more likely to be female (86% vs 76%; p = 0.04), more frequently had experienced a recent relapse (within 60 days before blood sampling; 13.8% vs 2.5%; p < 0.001), and more likely to experience a non-ON relapse during the follow-up period (25% vs 11%; p < 0.001). Other characteristics including race, Expanded Disability Status Scale (EDSS), disease subtype, baseline disease-modifying therapy (DMT) class, and history of ON did not significantly differ between groups.
Table 1.
Baseline Demographics and Clinical Characteristics for the Overall MS Cohort and by sNfL Group
Table 2.
Baseline Demographics and Clinical Characteristics by MS Disease Subtype
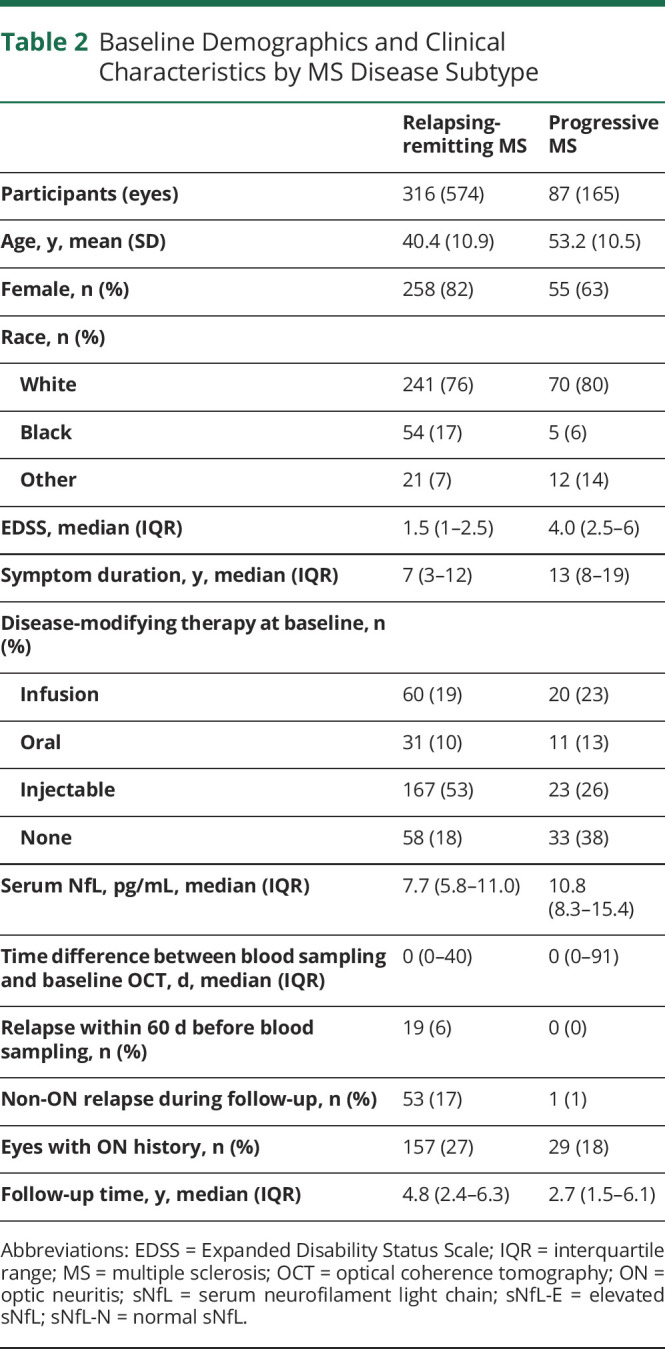
Regarding clinically evident inflammatory disease activity, the progressive MS participants (n = 87) were overall clinically inactive, with none of them experiencing a relapse within the year preceding blood sampling, and only 1 participant with SPMS experienced a non-ON clinical relapse during follow-up.
Baseline Associations of sNfL and OCT Measures
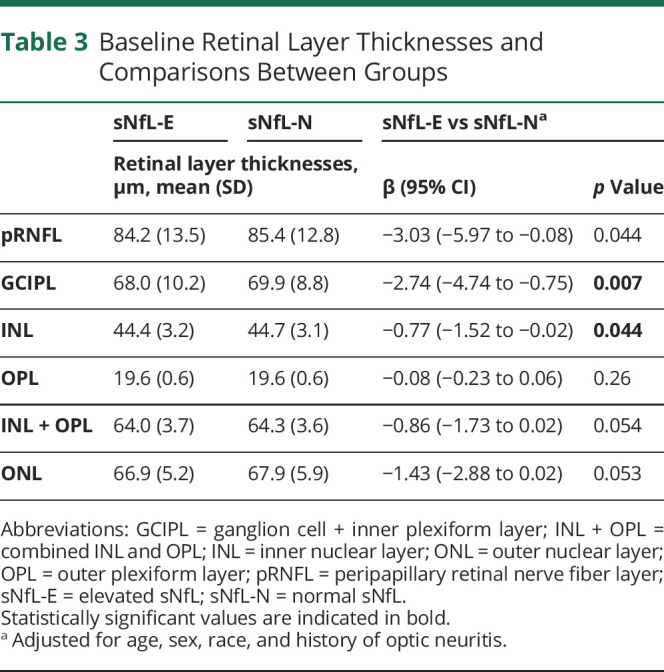
Comparisons of baseline OCT measures by the sNfL group are summarized in Table 3. At baseline, we found modestly lower pRNFL and GCIPL thicknesses in the sNfL-E vs sNfL-N groups in analyses adjusted for age, sex, race, and history of ON (pRNFL: −3.03 μm [95%CI: −5.97 to −0.08]; p = 0.044; GCIPL: −2.74 μm [95% CI: −4.74 to −0.75]; p = 0.007). Furthermore, there were slightly lower INL and ONL thicknesses in the sNfL-E group (INL: −0.77 μm [95% CI: −1.52 to −0.02]; p = 0.044; ONL: −1.43 μm [95% CI: −2.88 to 0.02]; p = 0.054), although the latter difference was not statistically significant. Analyses including the age-adjusted sNfL Z-score as a continuous variable and similarly adjusted for demographic variables and history of ON revealed an association with only GCIPL thickness (−0.59 μm per unit increase in sNfL Z-score; 95% CI: −1.03 to −0.15; p = 0.008), although a similar relationship (albeit not statistically significant) was observed for pRNFL thickness (−0.52 μm per unit increase in sNfL Z-score; 95% CI: −1.16 to 0.12; p = 0.11). Scatterplots of the baseline pRNFL, GCIPL, and INL thicknesses and the age-adjusted sNfL Z-scores are shown in eFigure 1 (links.lww.com/WNL/C80). These findings were consistent in sensitivity analyses excluding patients with relapses within 60 days before blood sampling and analyses further adjusting for EDSS and DMT class.
Table 3.
Baseline Retinal Layer Thicknesses and Comparisons Between Groups
Longitudinal Associations of sNfL With OCT Measures
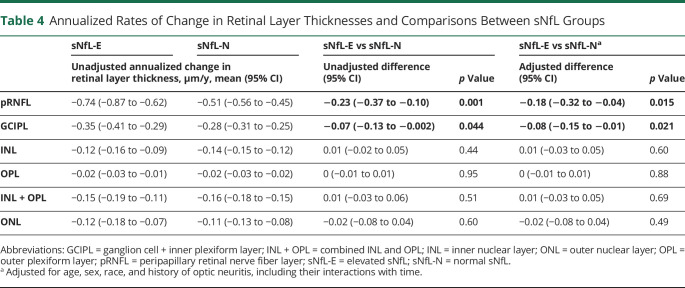
The mean rates of retinal layer thickness change during follow-up and their comparisons by sNfL group are summarized in Table 4, and trajectories of pRNFL and GCIPL thicknesses for individual eyes are shown in eFigure 2 (links.lww.com/WNL/C80). Thicknesses of all examined retinal layers decreased during follow-up in eyes from both NfL-E and NfL-N participants. Compared with NfL-N, eyes from NfL-E participants exhibited faster thinning of the pRNFL (45% faster; −0.74 vs −0.51 μm/y; adjusted difference: −0.18 μm/y [95% CI: −0.32 to −0.04]; p = 0.015) and GCIPL (25% faster; −0.35 vs −0.28 μm/y; adjusted difference: −0.08 μm/y [95% CI: −0.15 to −0.01]; p = 0.021). These findings were consistent in sensitivity analyses excluding participants with relapses within 60 days before blood sampling (adjusted differences—pRNFL: −0.16 μm/y [95% CI: −0.30 to −0.01], p = 0.035; GCIPL:: −0.08 μm/y [95% CI: −0.15 to −0.01], p = 0.033) and analyses further including baseline EDSS and DMT class as a time-varying covariate (adjusted differences—pRNFL: −0.17 μm/y [95% CI: −0.31 to −0.03], p = 0.017; GCIPL: −0.07 μm/y [95% CI: −0.14 to −0.003], p = 0.04). We did not observe any significant differences in the rates of change of any of the other retinal layers, including in sensitivity analyses as above.
Table 4.
Annualized Rates of Change in Retinal Layer Thicknesses and Comparisons Between sNfL Groups
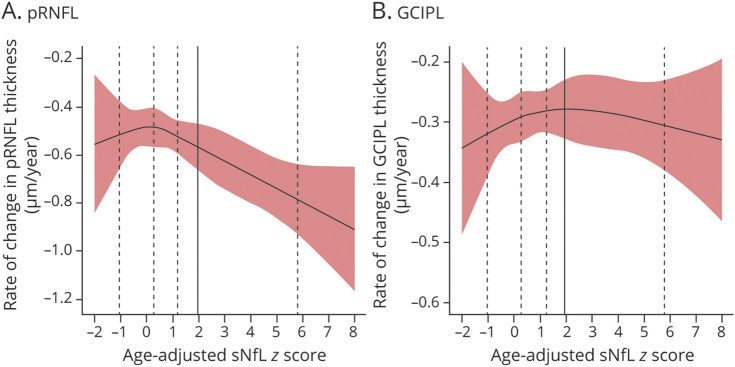
Longitudinal analyses to further evaluate the association between rates of pRNFL and GCIPL thinning with sNfL were performed, including the age-adjusted sNfL Z-score as a continuous variable, modeled linearly or using restricted cubic splines. Analyses were similarly adjusted for demographic variables and history of ON. In the linear analysis, we found that the age-adjusted sNfL Z-score was significantly associated with the annualized rate of pRNFL thinning (−0.03 μm/y per unit increase in sNfL Z-score; 95% CI: −0.06 to −0.002; p = 0.037) but not with GCIPL thinning (−0.001 μm/y per unit increase in sNfL Z-score; 95% CI: −0.015 to 0.013; p = 0.89). Although the model using restricted cubic splines did not reveal any significant deviation from linearity (p > 0.05), it did seem that estimated rates of pRNFL thinning for participants with sNfL Z-scores less than 1 were largely stable, with progressively increasing rates of thinning for those with higher sNfL Z-scores (Figure 2A), but no clear relationship was observed for the GCIPL (Figure 2B).
Figure 2. Relationship of Annualized Rate of Change in pRNFL and GCIPL Thickness With Age-Adjusted sNfL Z-Scores in MS Participants.
Relationships of the estimated annualized rates of change in pRNFL (A) and GCIPL (B) thickness with age-adjusted sNfL Z-scores in participants with MS are shown. The bounds of the shaded areas correspond to the 95% CIs of the estimated annualized rates of change. The adjusted sNfL Z-scores were derived using the healthy control data and modeled using restricted cubic splines (the vertical dashed lines correspond to the knot placement at the 5th, 35th, 65th and 95th percentiles of the sNfL Z-score distribution in the participants with MS; the vertical solid line corresponds to the 97.5th percentile cutoff [derived from the distribution in the healthy controls] for sNfL-E vs sNfL-N). GCIPL: ganglion cell + inner plexiform layer; MS = multiple sclerosis; pRNFL: peripapillary retinal nerve fiber layer; sNfL = serum neurofilament light chain; sNfL-E = elevated sNfL; sNfL-N = normal sNfL.
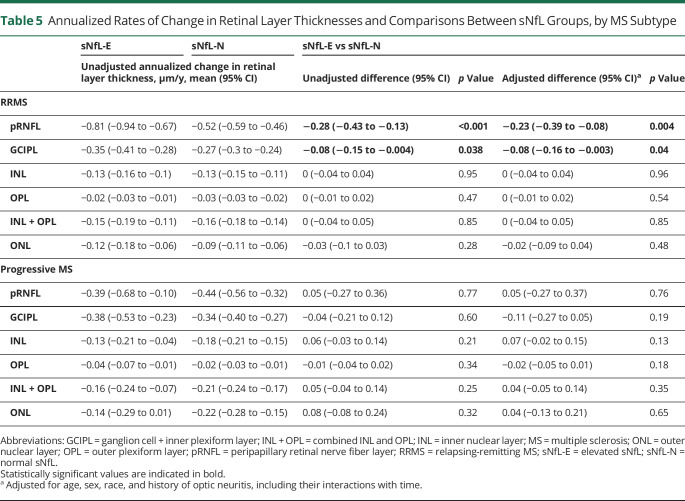
Furthermore, exploratory analyses were performed restricted to participants with RRMS or progressive MS (Table 5). Significant differences in rates of pRNFL and GCIPL thinning between sNfL-E and sNfL-N groups were found in the participants with RRMS, but not in those with progressive MS. Rates of change in other retinal layers, including the INL and ONL, did not differ between sNfL groups in either disease subtype. Further sensitivity analyses assessing a 95th percentile cutoff for sNfL-E revealed similar findings for the pRNFL (adjusted difference—RRMS: −0.16 μm/y, 95% CI: −0.30 to −0.02, p = 0.023; progressive MS: 0.12 μm/y, 95% CI: −0.19 to 0.43, p = 0.44) and the GCIPL (adjusted difference—RRMS: −0.07 μm/y, 95% CI: −0.13 to −0.01, p = 0.033; progressive MS: −0.06 μm/y, 95% CI: −0.21 to 0.09, p = 0.44). These findings also remained consistent in sensitivity analyses excluding participants with relapses within 60 days before blood sampling (notably, this was relevant only for the participants with RRMS because none of the progressive MS participants had experienced relapses within this time frame) and analyses further including baseline EDSS and DMT class as a time-varying covariate.
Table 5.
Annualized Rates of Change in Retinal Layer Thicknesses and Comparisons Between sNfL Groups, by MS Subtype
Discussion
In summary, we have found that elevated sNfL is associated with future retinal neuronal and axonal degeneration, as evidenced by faster rates of pRNFL and GCIPL atrophy in the absence of clinical episodes of acute ON. Interestingly, this finding seemed to be mainly driven by participants with MS in the relapsing-remitting stage of the disease, whereas no clear difference was observed between sNfL groups in those with progressive disease subtypes.
At baseline, we observed modestly lower pRNFL and GCIPL thicknesses in MS participants with elevated sNfL. This finding is in line with studies that have generally shown cross-sectional associations of sNfL with clinical disability (EDSS), brain volume, and T2 lesion volume. However, these associations are generally modest, consistent with the perception of sNfL as a dynamic biomarker reflecting recent and ongoing neuroaxonal injury, whereas established clinical disability in MS (outside of the context of acute relapses), brain atrophy, and chronic retinal neuroaxonal loss are more representative of the cumulative effects of preceding neuroaxonal injury.3,4,30
In longitudinal analyses, sNfL elevation at baseline was associated with faster pRNFL and GCIPL thinning during follow-up, a result that is consistent with previous studies reporting that elevated sNfL is associated with future brain and spinal cord atrophy and that longitudinal changes in OCT measures are reflective of brain atrophy.4,9 Intriguingly, this finding seemed to be more robust for the pRNFL compared with the GCIPL, as evidenced by a more marked difference between sNfL groups and by the analyses of sNfL age-adjusted Z-score as a continuous variable, which showed consistently increasing rates of pRNFL thinning with greater elevations in sNfL, whereas no clear association was observed for the GCIPL. Notably, the thicknesses of the GCIPL and pRNFL generally exhibit strong correlation in MS because their major structural components correspond to the retinal ganglion cell (RGC) neuronal cell bodies and axons, respectively. We speculate that the potential differences observed in our study between these 2 measures may potentially reflect differences in NfL content between axons vs neuronal cell bodies (given higher levels in axons) and potential dissociation between axonal and neuronal degeneration because RGCs can survive after axonal injury and degeneration, a process that may reflect differential susceptibility of RGC subtypes.16,31
Furthermore, our findings seemed to be mainly driven by the particpants with RRMS, whereas we did not observe a significant association between sNfL and pRNFL or GCIPL thinning in progressive MS, although these analyses should be interpreted with caution given the small sample size of progressive MS participants. Preliminary reports of analyses of progressive MS clinical trial cohorts assessing anti-inflammatory therapies, including EXPAND (siponimod in SPMS), INFORMS (fingolimod in PPMS), and ASCEND (natalizumab in SPMS), have reported associations of baseline sNfL with rates of brain atrophy.32,33 Importantly, in contrast to these clinical trial cohorts, our progressive MS participants were relatively inactive clinically, with none of them having experienced a relapse within the year before baseline, and only 1 participant experiencing a relapse during follow-up. Furthermore, in the SPRINT-MS trial, despite a 48% reduction in the rate of whole brain atrophy with ibudilast treatment in progressive MS, no effect was observed on serum or CSF NfL, and similarly, in the MS-STAT trial, despite a 43% reduction in the rate of whole brain atrophy with simvastatin treatment in progressive MS, no effect was observed on serum NfL.34-36 Collectively, these results suggest a potential dissociation between the focal inflammatory disease activity and the slowly progressive neurodegenerative processes that occur in progressive MS.35
Previous studies examining associations of sNfL and OCT measures in MS have been limited and have produced conflicting results. In line with our study, Bsteh et al.14 reported that sNfL was associated with pRNFL thinning over a 3-year period in a cohort of 80 people with RRMS, but macular scans were not included in the study and consequently, associations with other retinal layers could not be examined. In a study of 110 people with MS, Tavazzi et al.15 reported that sNfL was cross-sectionally associated with pRNFL and GCIPL thicknesses in the eyes of MS patients without a history of ON, but did not find an association between baseline sNfL and longitudinal changes in OCT measures over a 5-year period. Seitz et al. examined sNfL in 156 people with early MS and available OCT, with longitudinal data available for a small subset of the cohort (n = 38). sNfL was cross-sectionally associated with OPL thickness in patients with a history of ON and longitudinally with rates of OPL thinning, but no associations were found with other retinal layers, either cross-sectionally or longitudinally.16 The findings for the OPL are difficult to interpret because there is a lack of literature supporting that OPL thinning occurs in MS because it is a relatively small layer that is typically not examined in isolation, but as a composite measure with the INL. In this study, we did not find evidence for a relationship of sNfL cross-sectionally or longitudinally with OPL thickness.
Our study bears a number of limitations that warrant discussion. First, because this was a retrospective study, MRIs were not available for all participants close to blood sampling, which limited our ability to systematically investigate for the presence of subclinical inflammatory disease activity that could be associated with baseline sNfL elevations. However, we did perform analyses excluding participants with recent relapses and our findings remained consistent. In addition, we were only able to investigate the association of baseline sNfL with longitudinal changes in OCT measures, given a lack of sufficient blood sample availability during follow-up. Owing to the dynamic nature of sNfL, it would be expected that serial measurement of sNfL during follow-up could provide a more comprehensive picture of ongoing neuroaxonal injury.37 Otherwise, although the sample size of the overall cohort was large, the number of people with MS with progressive disease was relatively small, which impacts the robustness of the interpretation of our results regarding the association of sNfL with rates of retinal atrophy in this subgroup, and these results should be interpreted with caution. Furthermore, in contrast to our larger previous study examining rates of retinal layer thinning by disease subtype and age, we did not observe faster rates of inner retinal layer atrophy in progressive MS vs RRMS; however, the sample size and duration of follow-up of the progressive MS participants were smaller in the present study.10
In conclusion, our study provides evidence that elevated sNfL is associated with accelerated rates of retinal neuroaxonal loss in relapsing-remitting MS, independent of overt ON. Analyses of OCT, MRI, and sNfL data from prospective observational studies including larger numbers of people with MS in the progressive disease stage and progressive MS clinical trial cohorts will be important to further disentangle associations of sNfL with inflammatory disease activity vs neuroaxonal degeneration in MS.
Glossary
- DMT
disease modifying therapy
- EDSS
expanded disability status scale
- GCIPL
ganglion cell + inner plexiform layer
- HC
healthy control
- INL
inner nuclear layer
- IQR
interquartile range
- MS
multiple sclerosis
- OCT
optical coherence tomography
- ON
optic neuritis
- ONL
outer nuclear layer
- OPL
outer plexiform layer
- PPMS
primary progressive MS
- pRNFL
peri-papillary retinal nerve fiber layer
- RRMS
relapsing-remitting MS
- sNfL
serum neurofilament light chain
- sNfL-E
elevated sNfL
- sNfL-N
normal sNfL
- SPMS
secondary progressive MS
Appendix. Authors

Footnotes
Editorial, page 269
Study Funding
This study was funded by the NIH (1K23NS117883 to E.S.S.; 1K01MH121582 to K.C.F.; 5R01NS082347 to P.A.C.), National MS Society (FP-1607-24999 and TA-1904-33834 to E.S.S.; TA-1805-31136 to K.C.F.; RG-1606-08768 and RG-1907-34405 to S.S; RG 1904–33800 to P.A.C.), and Biogen (SRA US-MSG-18-11312 to P.A.C.).
Disclosure
E.S. Sotirchos has received speaker honoraria from Viela Bio, Biogen and Alexion, and consulting fees from Horizon Therapeutics, Viela Bio, Alexion and Genentech. E.S. Vasileiou, A.G. Filippatou, K.C. Fitzgerald, M.D. Smith, H.-N. Lord, G. Kalaitzidis, J. Lambe, and A. Duval report no disclosures. J.L. Prince is a founder of Sonovex, Inc. and serves on its Board of Directors; he has been a paid consultant for JuneBrain, Inc. within the last 2 years and had research funded by Biogen, Inc. and 12Sigma Technologies within the past 2 years; and he has active funding from JuneBrain, LLC and is a co-investigator on a grant from Genentech. E.M. Mowry has grants from Biogen, Genzyme and Genentech, is site PI for studies sponsored by Biogen and Genentech; and has received free medication for a clinical trial from Teva and receives royalties for editorial duties from UpToDate. S. Saidha has received consulting fees from Medical Logix for the development of CME programs in neurology and has served on scientific advisory boards for Biogen, Genzyme, Genentech Corporation, & Bristol Myers Squibb; he has consulted for Carl Zeiss Meditec; he is the PI of investigator-initiated studies funded by Genentech Corporation and Biogen Idec, and received support from the Race to Erase MS foundation; and he has received equity compensation for consulting from JuneBrain LLC, a retinal imaging device developer. P.A. Calabresi has received consulting fees from Biogen, Nervgen, Avidea, and Disarm Therapeutics and is PI on grants from Principia, and Genentech. Go to Neurology.org/N for full disclosures.
References
- 1.Reich DS, Lucchinetti CF, Calabresi PA. Multiple sclerosis. N Engl J Med. 2018;378(2):169-180. [DOI] [PMC free article] [PubMed] [Google Scholar]
- 2.Mahad DH, Trapp BD, Lassmann H. Pathological mechanisms in progressive multiple sclerosis. Lancet Neurol. 2015;14(2):183-193. [DOI] [PubMed] [Google Scholar]
- 3.Disanto G, Adiutori R, Dobson R, et al. Serum neurofilament light chain levels are increased in patients with a clinically isolated syndrome. J Neurol Neurosurg Psychiatry. 2016;87(2):126-129. [DOI] [PubMed] [Google Scholar]
- 4.Barro C, Benkert P, Disanto G, et al. Serum neurofilament as a predictor of disease worsening and brain and spinal cord atrophy in multiple sclerosis. Brain. 2018;141(8):2382-2391. [DOI] [PubMed] [Google Scholar]
- 5.Kapoor R, Smith KE, Allegretta M, et al. Serum neurofilament light as a biomarker in progressive multiple sclerosis. Neurology. 2020;95(10):436-444. [DOI] [PMC free article] [PubMed] [Google Scholar]
- 6.Bittner S, Oh J, Havrdová EK, Tintoré M, Zipp F. The potential of serum neurofilament as biomarker for multiple sclerosis. Brain. 2021;144(10):2954-2963. doi: 10.1093/brain/awab241. [DOI] [PMC free article] [PubMed] [Google Scholar]
- 7.Williams T, Zetterberg H, Chataway J. Neurofilaments in progressive multiple sclerosis: a systematic review. J Neurol. 2021;268(9):3212-3222. [DOI] [PMC free article] [PubMed] [Google Scholar]
- 8.Ratchford JN, Saidha S, Sotirchos ES, et al. Active MS is associated with accelerated retinal ganglion cell/inner plexiform layer thinning. Neurology. 2013;80(1):47-54. [DOI] [PMC free article] [PubMed] [Google Scholar]
- 9.Saidha S, Al-Louzi O, Ratchford JN, et al. Optical coherence tomography reflects brain atrophy in multiple sclerosis: a four-year study. Ann Neurol. 2015;78(5):801-813. [DOI] [PMC free article] [PubMed] [Google Scholar]
- 10.Sotirchos ES, Gonzalez Caldito N, Filippatou A, et al. Progressive multiple sclerosis is associated with faster and specific retinal layer atrophy. Ann Neurol. 2020;87(6):885-896. [DOI] [PMC free article] [PubMed] [Google Scholar]
- 11.Paul F, Calabresi PA, Barkhof F, et al. Optical coherence tomography in multiple sclerosis: a 3-year prospective multicenter study. Ann Clin Transl Neurol. 2021;8(12):2235-2251. [DOI] [PMC free article] [PubMed] [Google Scholar]
- 12.Green AJ, McQuaid S, Hauser SL, Allen IV, Lyness R. Ocular pathology in multiple sclerosis: retinal atrophy and inflammation irrespective of disease duration. Brain. 2010;133(pt 6):1591-1601. [DOI] [PMC free article] [PubMed] [Google Scholar]
- 13.Saidha S, Syc SB, Ibrahim MA, et al. Primary retinal pathology in multiple sclerosis as detected by optical coherence tomography. Brain. 2011;134(pt 2):518-533. [DOI] [PubMed] [Google Scholar]
- 14.Bsteh G, Berek K, Hegen H, et al. Serum neurofilament levels correlate with retinal nerve fiber layer thinning in multiple sclerosis. Mult Scler. 2020;26(13):1682-1690. [DOI] [PubMed] [Google Scholar]
- 15.Tavazzi E, Jakimovski D, Kuhle J, et al. Serum neurofilament light chain and optical coherence tomography measures in MS: a longitudinal study. Neurol Neuroimmunol Neuroinflamm. 2020;7(4):e737. [DOI] [PMC free article] [PubMed] [Google Scholar]
- 16.Seitz CB, Steffen F, Muthuraman M, et al. Serum neurofilament levels reflect outer retinal layer changes in multiple sclerosis. Ther Adv Neurol Disord. 2021;14:17562864211003478. [DOI] [PMC free article] [PubMed] [Google Scholar]
- 17.Thompson AJ, Banwell BL, Barkhof F, et al. Diagnosis of multiple sclerosis: 2017 revisions of the McDonald criteria. Lancet Neurol. 2018;17(2):162-173. [DOI] [PubMed] [Google Scholar]
- 18.Tewarie P, Balk L, Costello F, et al. The OSCAR-IB consensus criteria for retinal OCT quality assessment. PLoS One. 2012;7(4):e34823. [DOI] [PMC free article] [PubMed] [Google Scholar]
- 19.Lublin FD, Reingold SC. Defining the clinical course of multiple sclerosis: results of an international survey. National Multiple Sclerosis Society (USA) Advisory Committee on Clinical Trials of New Agents in Multiple Sclerosis. Neurology. 1996;46(4):907-911. [DOI] [PubMed] [Google Scholar]
- 20.Wilson DH, Rissin DM, Kan CW, et al. The Simoa HD-1 analyzer: a novel fully automated digital immunoassay analyzer with single-molecule sensitivity and multiplexing. J Lab Autom. 2016;21(4):533-547. [DOI] [PubMed] [Google Scholar]
- 21.Syc SB, Warner CV, Hiremath GS, et al. Reproducibility of high-resolution optical coherence tomography in multiple sclerosis. Mult Scler. 2010;16:829-839. [DOI] [PubMed] [Google Scholar]
- 22.Schippling S, Balk LJ, Costello F, et al. Quality control for retinal OCT in multiple sclerosis: validation of the OSCAR-IB criteria. Mult Scler. 2015;21(2):163-170. [DOI] [PubMed] [Google Scholar]
- 23.Lang A, Carass A, Hauser M, et al. Retinal layer segmentation of macular OCT images using boundary classification. Biomed Opt Express. 2013;4(7):1133-1152. [DOI] [PMC free article] [PubMed] [Google Scholar]
- 24.Bhargava P, Lang A, Al-Louzi O, et al. Applying an open-source segmentation algorithm to different OCT devices in multiple sclerosis patients and healthy controls: implications for clinical trials. Mult Scler Int. 2015;2015:136295. [DOI] [PMC free article] [PubMed] [Google Scholar]
- 25.Aytulun A, Cruz-Herranz A, Aktas O, et al. APOSTEL 2.0 recommendations for reporting quantitative optical coherence tomography studies. Neurology. 2021;97(2):68-79. [DOI] [PMC free article] [PubMed] [Google Scholar]
- 26.Rigby RA, Stasinopoulos DM. Generalized additive models for location, scale and shape. J R Stat Soc Ser C Appl Stat. 2005;54:507-554. [Google Scholar]
- 27.Stasinopoulos MD, Rigby RA, Heller GZ, Voudouris V, Bastiani FD. Flexible Regression and Smoothing: Using GAMLSS in R. Chapman and Hall/CRC; 2017. [Google Scholar]
- 28.Harrell FE. General aspects of fitting regression models. In: Harrell FE Jr, editor. Regression Modeling Strategies: With Applications to Linear Models, Logistic and Ordinal Regression, and Survival Analysis. Springer International Publishing; 2015:13-44. doi: 10.1007/978-3-319-19425-7_2. [DOI] [Google Scholar]
- 29.Gauthier J, Wu QV, Gooley TA. Cubic splines to model relationships between continuous variables and outcomes: a guide for clinicians. Bone Marrow Transplant. 2020;55(4):675-680. [DOI] [PubMed] [Google Scholar]
- 30.Sotirchos E, Vasileiou ES, Filippatou AG, et al. Associations of serum neurofilament light chain with clinical and radiological measures in a large real world MS population. Mult Scler J. 2021;27:2. [Google Scholar]
- 31.VanderWall KB, Lu B, Alfaro JS, et al. Differential susceptibility of retinal ganglion cell subtypes in acute and chronic models of injury and disease. Sci Rep. 2020;10(1):17359. [DOI] [PMC free article] [PubMed] [Google Scholar]
- 32.Kuhle J, Kropshofer H, Haering DA, et al. Neurofilament light levels in the blood of patients with secondary progressive MS are higher than in primary progressive MS and may predict brain atrophy in both MS subtypes. Mult Scler J. 2018;24:111. [Google Scholar]
- 33.Kapoor R, Sellebjerg F, Hartung HP, et al. Natalizumab reduces serum concentrations of neurofilament light chain in secondary progressive multiple sclerosis patients from the phase 3 ASCEND study (S12.008). Neurology. 2019;92(15 suppl):S12.008. [Google Scholar]
- 34.Fox RJ, Coffey CS, Conwit R, et al. Phase 2 trial of ibudilast in progressive multiple sclerosis. N Engl J Med. 2018;379(9):846-855. [DOI] [PMC free article] [PubMed] [Google Scholar]
- 35.Fox RJ, Raska P, Barro C, et al. Neurofilament light chain in a phase 2 clinical trial of ibudilast in progressive multiple sclerosis. Mult Scler. 2021;27(13):2014-2022. doi: 10.1177/1352458520986956. [DOI] [PMC free article] [PubMed] [Google Scholar]
- 36.Williams TE, Holdsworth KP, Nicholas JM, et al. Assessing neurofilaments as biomarkers of neuroprotection in progressive multiple sclerosis: from the MS-STAT randomized controlled trial. Neurol Neuroimmunol Neuroinflamm. 2022;9(2):e1130. [DOI] [PMC free article] [PubMed] [Google Scholar]
- 37.Chitnis T, Gonzalez C, Healy BC, et al. Neurofilament light chain serum levels correlate with 10-year MRI outcomes in multiple sclerosis. Ann Clin Transl Neurol. 2018;5(12):1478-1491. [DOI] [PMC free article] [PubMed] [Google Scholar]
- 38.r-project.org/.
Associated Data
This section collects any data citations, data availability statements, or supplementary materials included in this article.
Data Availability Statement
Anonymized data used for this study are available from the corresponding author on reasonable request, with the proper data sharing agreements in place.


