

Abstract
The gut fermentation product butyrate displays anti-cancer properties in the human proximal colon, including the ability to inhibit proliferation and induce apoptosis in colorectal cancer (CRC) cells. A natural histone deacetylase inhibitor (HDACi), butyrate can alter histone acetylation patterns in CRC cells, and thereby regulate global gene expression, including the non-coding transcriptome and microRNAs (miRNAs). Dysregulated miRNA expression affects CRC development and progression; however, the interplay between miRNA activity and butyrate response remains to be elucidated. A high-throughput functional screen was employed to identify miRNAs that can act as enhancers of the anti-cancer properties of butyrate. Validation studies confirmed that several miRNAs, including miR-125b, miR-181a, miR-593, and miR-1227, enhanced apoptosis, decreased proliferation, and promoted cell-cycle arrest in the presence of butyrate. Pathway analyses of predicted miRNA target genes highlighted their likely involvement in critical cancer-related growth pathways, including WNT and PI3K signaling. Several cancer-associated miRNA targets, including TRIM29, COX2, PIK3R3, CCND1, MET, EEF2K, DVL3, and NUP62 were synergistically regulated by the combination of cognate miRNAs and butyrate. Overall, this study has exposed the potential of miRNAs to act as enhancers of the anti-cancer effects of HDAC inhibition and identifies specific miRNAs that might be exploited for therapeutic benefit.
Keywords: MT: non-coding RNAs, microRNAs, colorectal cancer, butyrate, histone acetylation, high-throughput screen
Graphical abstract
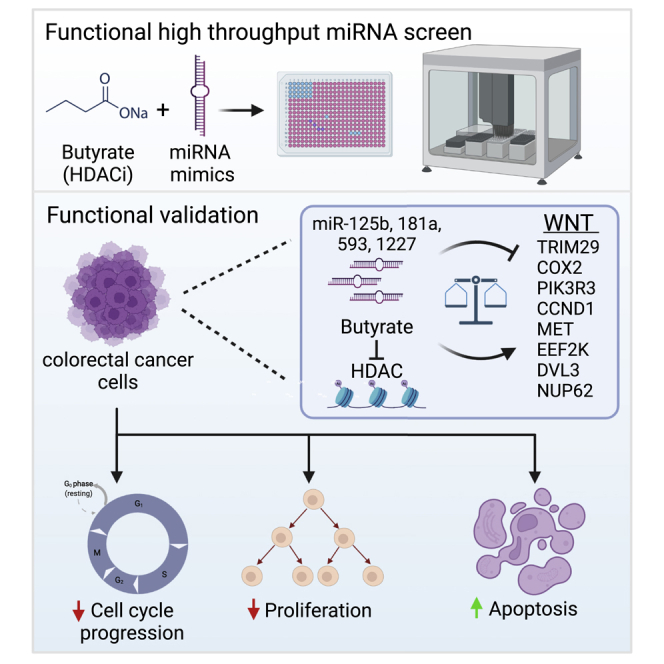
Using a functional genomics approach, this study identifies microRNAs that combine with butyrate to slow colon cancer progression. It highlights microRNAs with therapeutic potential and other drug targets whose inhibition may be useful either as a monotherapy or in conjunction with chromatin-modifying drugs.
Introduction
Colorectal cancer (CRC) is the second most common cause of cancer-related deaths worldwide.1 A small number of CRC cases are attributed to genetic factors; however, most cases develop sporadically and are associated with environmental factors such as diet.2 Epigenetic changes, including altered DNA methylation patterns, histone modifications, and aberrant expression of non-coding RNAs, such as microRNAs (miRNAs), play a crucial role in CRC development and progression.3, 4, 5
The consumption of dietary fiber, particularly resistant starch, has been shown to be beneficial in the gut, in part due to its role in the microbial production of the chemopreventive molecule butyrate. Butyrate accumulates in the colon at concentrations exceeding 20 mM,6 where it serves as a primary energy source for normal colonocytes and is a histone deacetylase inhibitor (HDACi) with the ability to maintain healthy colonic epithelial cells by regulating cell growth and differentiation.7 Paradoxically, butyrate has also been shown to eliminate CRC cells through the inhibition of cell proliferation and promotion of apoptosis and differentiation.8,9 Butyrate exerts these anti-cancer properties by altering histone acetylation patterns and inducing changes in cell-cycle-related protein-coding and non-coding gene expression, including miRNA expression.10, 11, 12
miRNAs have been shown to play a vital role in the initiation, progression, and metastasis of many cancers,13,14 and there is growing interest in the role that miRNAs play in the butyrate-mediated inhibition of CRC cells. miRNAs are endogenous, short non-coding RNAs with the ability to post-transcriptionally regulate gene expression through gene silencing. Butyrate and miRNAs can regulate similar cell growth and death signaling pathways, suggesting that butyrate may mediate its anti-cancer effects partly through miRNA regulation or in collaboration with miRNAs.
miRNA profiling demonstrated that butyrate can modulate the expression of many miRNAs and specific oncogenic miRNA clusters, including the miR-17-92 cluster.15 The well-known oncogenic cluster, miR-17-92, has a key role in the regulation of proliferation, angiogenesis, differentiation, and apoptosis in CRC, and dysregulation of this cluster can contribute to CRC development and progression.16,17 Exposure of CRC cells to butyrate reduced expression of miR-17-92 cluster members, including miR-17, miR-18a, miR-19a, miR-20a, miR-19b-1, and miR-92a-1, thereby resulting in increased expression of key tumor-suppressor target genes PTEN, BCL2L11, and CDKN1A.15,18 Furthermore, miR-18a was shown to enhance the anti-proliferative and pro-apoptotic properties of butyrate when overexpressed in CRC cells, acting counter to other cluster members.19 Recently, a systems biology approach uncovered a novel butyrate-regulated RNA-interaction network and several miRNAs with the ability to enhance the anti-cancer properties of butyrate in CRC cells.20
Previous research indicates an important role for miRNAs in the butyrate response; however, comprehensive understanding of the butyrate-sensitizing capabilities of miRNAs is still lacking. In this study, a high-throughput functional screen was employed to reveal miRNA-mediated enhancement of the anti-cancer properties of butyrate. Validation experiments revealed that several key miRNA:mRNA pairs were involved in the butyrate sensitization of CRC cells through the regulation of crucial cell growth signaling pathways. These data highlight the value of high-throughput approaches in revealing novel molecular interactions involved in the growth and survival of CRC cells. Understanding these interactions may also identify novel therapeutic targets.
Results
Systematic identification of butyrate-sensitizing miRNAs in CRC cells
To systematically identify miRNAs with the ability to enhance the anti-cancer properties of butyrate in CRC cells, a high-throughput functional miRNA screen was performed at the Victorian Centre for Functional Genomics (Figure 1). HCT116 cells were transfected with a library of 1,280 miRNA mimics and then cell viability and apoptosis were determined in the presence and absence of butyrate. They were treated with a 2.5 mM sublethal dose of butyrate, which reduces cell proliferation by only 20% over 72 h. This concentration was selected to enable the exploration of miRNAs that enhanced the anti-proliferative properties of butyrate. Reproducibility between screen replicates was good with Pearson correlation coefficients r = 0.66, 0.68, 0.86, and 0.76 for untreated and butyrate-treated viability and apoptosis data, respectively (Figure S1). Fifty-seven miRNA mimics provided a synergistic response with butyrate, as defined by enhancing the butyrate-mediated reduction in proliferation by >25% with a Z score >2 (see section “materials and methods”). Of the 57 miRNA mimics that reduced proliferation, 13 (∼1% hit rate) also had the ability to enhance the pro-apoptotic effects of butyrate and were hence selected for further validation (Table S1).
Figure 1.

Unbiased high-throughput functional screen in CRC cells
(A) Functional miRNA screen experimental workflow. Library plates containing 1,280 miRNA mimics were distributed to A plates. An individual A plate was used to transfer miRNA mimics, DharmaFECT 2 lipid and Opti-MEM to corresponding B, C, and D plates during reverse transfection at 0 h. A medium change was performed at 24 h, followed by 2.5 mM butyrate treatment at 48 h to plates C and D. The Apolive-Glo Multiplex assay for proliferation and apoptosis was performed at 72 h post transfection. A summary of the screen results in HCT116 cells. (B) Flow chart of screen hit selection criteria. (C) The y axis indicates cell titer fluor (CTF) values normalized to the NC (OTP-NT) and the x axis indicates NCs (mock, ON-TARGETplus [OTP-NT]), positive mimic control (miR-18a), and positive death controls (siPLK1, siTOX). (D) The y axis indicates caspase activity normalized to OTP-NT and the x axis indicates individual mimics, either Z score or positive fold change.
miRNAs enhance the anti-proliferative effects of butyrate in HCT116 CRC cells
The ability of the 13 selected miRNA mimics to enhance the effect of butyrate on CRC cell proliferation was validated using an xCelligence real-time cell analysis system (Figure 2). Butyrate treatment alone reduced HCT116 cell proliferation by approximately 2-fold compared with untreated cells in the negative control (NC) transfection condition. A subset of miRNA mimics including miR-29b, -125b, -181a, -509, -593, -1227, -1265, -3151, and -4252 significantly reduced cell proliferation alone, i.e., in the absence of butyrate (Figures 2A–2F, 2I, 2J, and 2M). In contrast, miR-1231, -1256, -3179, and -3654 had no significant effect on cell proliferation in the absence of butyrate (Figures 2G, 2H, 2K, and 2L). All 13 miRNA mimics significantly decreased proliferation in combination with butyrate, consistent with screen results. Based on the coefficient of drug interaction (CDI) values (Table S2), nine out of 13 miRNAs displayed significantly synergistic behavior when combined with butyrate; these were miR-29b, -125b, -181a, -509, -1227, -1256, -1265, -3179, and -3654. The remaining four miRNAs (miR-593, -1231, -3151, and -4252) also had an apparent synergistic effect, but their CDI values were not statistically significant. Of these miRNAs, none had an additive or antagonistic effect when combined with butyrate.
Figure 2.

miRNAs enhance the anti-proliferative effects of butyrate in CRC cells
Left: (A–M) real-time cell index measurements using the xCELLigence RTCA platform, in HCT116 cells transfected with butyrate-sensitizing miRNAs treated with 0 mM or 2.5 mM butyrate at 48 h. Cells were analyzed at 72 h post transfection. Right: (A–M) Statistical results from unpaired t tests comparing NC (0 mM) versus miRNA mimic (0 mM) and NC (2.5 mM) versus miRNA mimic (2.5 mM) at 72 h post transfection. The mean ± SEM of n = 4 is shown. Significant results are indicated by ∗p < 0.05, ∗∗p < 0.01, ∗∗∗p < 0.001, ∗∗∗∗p < 0.0001. NC, NC mimic.
miRNAs induce apoptosis in combination with butyrate
The ability of the 13 selected miRNA mimics to enhance the effect of butyrate on CRC cell apoptosis was validated using a live-cell imaging system (Incucyte FLR) to detect changes in caspase activity (Figure 3). Butyrate alone increased the proportion of apoptotic cells by over 2-fold compared with untreated NC transfected controls. Of the 13 miRNAs mimics individually transfected into HCT116 cells, seven significantly induced apoptosis alone; i.e., in the absence of butyrate. These were miR-125b, -593, -1227, -1231, -1265, -3179, and -4252 (Figures 3B, 3E–3G, 3I, 3K, and 3M). The remaining six mimics had little effect alone. Eleven individual miRNA mimics promoted apoptosis in combination with butyrate; these were miR-29b, -125b, -181a, -509, -593, -1227, -1231, -1256, -1265, -3179, and -4252 (Figures 3A–3I, 3K, and 3M). There was no significant combinatorial effect for miR-3151 or -3654.
Figure 3.

miRNAs enhance the pro-apoptotic effects of butyrate in CRC cells
Normalized caspase activity, using the Incucyte FLR platform, representing apoptosis in HCT116 cells transfected with butyrate-sensitizing miRNAs treated with 0 mM or 2.5 mM butyrate and CellPlayer 96-well caspase 3/7 reagent at 48 h post transfection (A–M). Statistical analysis including unpaired t tests comparing NC versus miRNA mimic (untreated) and NC versus miRNA mimic (both 2.5 mM). The mean ± SEM of n = 4 is shown. Significant results are indicated by ∗p < 0.05, ∗∗p < 0.01, ∗∗∗p < 0.001, ∗∗∗∗p < 0.0001. NC, NC mimic.
Selecting miRNA mimics for validation
The CDI values for miRNA-butyrate combinations in proliferation assays were used to refine the hit list for further validation. miR-1227 had the lowest CDI value at 0.19, followed by miR-125b at 0.40 and miR-181a at 0.43 (Table S2). Accordingly, these miRNAs were prioritized for further analysis. The three miRNAs are expressed in the colorectum in both normal and adenocarcinoma tissues (Figure S3). Although miR-593 was not considered synergistic with butyrate, nor was it identified in the TCGA RNA-seq dataset; alone it had the most potent ability to decrease growth when comparing miRNA transfected cells to NC transfected controls (Figure 2E). Based on this potent anti-proliferative effect, miR-593 was also selected for further characterization.
Butyrate-sensitizing miRNAs regulate cell viability and death in CRC cells
To further explore the ability of miRNAs and butyrate to regulate cell viability and programmed cell death, these changes were examined using flow cytometry. In the absence of butyrate, the miRNA mimics showed no significant effect on the percentage of viable cells (Figure 4A), in contrast to observations from the real-time cell analyses. However, when comparing miRNA with NC transfection conditions in combination with butyrate treatment, miR-125b, miR-593, and miR-1227 were found to significantly enhance the ability of butyrate to reduce the fraction of viable cells (Figures 4A and S2). When examining apoptosis at early and late stages, only miR-593 induced apoptosis alone (in the absence of butyrate), but this was only significant at the early apoptosis stage. Both miR-593 and miR-1227 significantly enhanced the pro-apoptotic activity of butyrate when assessed at both the early and late stages. miR-125b also enhanced the pro-apoptotic effect of butyrate when assessed at the late stage. Overall, these data are broadly consistent with data generated using the real-time cell analysis platforms, and further support the synergistic effects of selected miRNAs with butyrate.
Figure 4.

Butyrate-sensitizing miRNAs regulate programmed cell death and the cell cycle
(A and B) Flow cytometry analysis of apoptosis and cell cycle in miRNA transfected HCT116 cells after 24 h of butyrate treatment. Bar charts showing (A) viability and apoptosis or (B) cell-cycle analysis of HCT116 cells reverse transfected with miRNA mimics miR-125b, miR-181a, miR-593, and miR-1227 for 48 h, followed by 24 h of treatment with 0 mM or 2.5 mM butyrate. Cells were analyzed at 72 h post transfection. The mean ± SEM of three replicate wells is shown. Significant results are indicated by ∗p < 0.05, ∗∗p < 0.01, ∗∗∗p < 0.001, ∗∗∗∗p < 0.0001. NC, NC mimic.
CRC cell lines display considerable functional heterogeneity in part due to different driver mutations, thus it was important to test the activities of butyrate-sensitizing miRNAs in a second cell line with a different mutational status. HCT116 cells harbor wild-type (WT) TP53 and BRAF genes, and mutant CTNNB1, PIK3CA, and KRAS.21 Alternatively, LIM1215 cells contain WT PIK3CA, KRAS, BRAF, and TP53 and mutant CTNNB1.22 A normal human foreskin fibroblast cell line (HFF) was used to assess the effects of miRNAs and butyrate on survival of noncancerous cells.
Butyrate alone reduced LIM1215 cell viability by approximately 20% and induced an approximately 2-fold increase in the number of apoptotic cells (Figures S4A and S4B). All miRNAs, except miR-125b, were able to reduce cell viability independently of butyrate, with miR-181a showing the greatest effect. All miRNAs also induced apoptosis in the absence of butyrate. All miRNAs, except miR-125b, enhanced the ability of butyrate to reduce cell viability. miR-1227 had the greatest ability to sensitize CRC cells to butyrate. Overall, these effects are generally consistent with those observed in HCT116 cells.
HFF cell viability was not significantly reduced by any miRNA mimic or by butyrate, alone or in combination. Unexpectedly, the combination of miR-1227 and butyrate slightly but significantly increased viable HFF cells (Figure S4C). All miRNAs alone significantly increased HFF apoptosis, but butyrate had little or no modulatory effect on this response (Figure S4D).
Butyrate-sensitizing miRNAs modulate the cell cycle in CRC cells
miRNAs were further investigated for their effects on the cell cycle, alone and in combination with butyrate, using flow cytometry (Figures 4B and S5). Both miR-593 and miR-1227 alone significantly increased the percentage of cells in the G0/G1 phase. In the presence of butyrate, miR-1227 significantly reduced the percentage of cells in the G0/G1 phase, while, conversely, miR-593 increased cells in this phase. miR-181a alone slightly, but significantly, increased the percentage of cells in the S phase; however, the combination of butyrate and miR-181a resulted in ∼85% reduction in this phase compared with the butyrate-treated control. Furthermore, miR-593 and butyrate combination treatment significantly reduced the percentage of cells in the S phase by over 90%, while miR-1227 doubled the percentage of cells in S phase in the presence of butyrate. Notably, the combination of butyrate and miR-181a or miR-593 significantly increased the percentage of cells in G2/M. These data suggest that cell-cycle regulation does play a role in miRNA-mediated butyrate sensitization of CRC cells, partly through blocking of cells in S and G2/M phases, and may contribute to the observed proliferative changes.
WNT and PI3K signaling are key growth pathways involving predicted miRNA target genes
To identify cell growth or death signaling pathways involved in the miRNA-mediated butyrate sensitization of CRC cells, likely mRNA targets of miR-125b, miR-181a, miR-593, and miR-1227 were identified using the miRWalk target prediction platform to collate data from several programs (Figure 5A). To refine target gene lists, only those with hits in four or more programs were selected. Kyoto Encyclopedia of Genes and Genomes (KEGG) functional pathway analysis revealed enrichment in the “pathways in cancer” and “microRNAs in cancer” terms within the set of predicted targets for the butyrate-sensitizing miRNAs (Figure 5B). More specifically, the target gene sets were highly enriched for components of the WNT and PI3K signaling pathways within the term “pathways in cancer.” As many targets were predicted, literature review was used to further refine the list by identifying genes previously reported to be involved in promoting cell proliferation and inhibiting apoptosis in CRC and other cancers. This resulted in a list of 11 predicted target genes that were considered relevant to the chemoprotective effects of miR-125b, miR-181a, miR-593, and miR-1227. To validate these genes as miRNA targets, their expression was measured by RT-PCR in HCT116 cells after transfection with the cognate miRNA mimic, with or without butyrate treatment (Figure 5C).
Figure 5.

miRNA target gene identification
(A–C) (A) Flow chart describing miRNA target gene selection. (B) Functional enrichment analysis. Bar plot depicts the top 10 enriched biological pathways using KEGG, as identified after performing ShinyGO enrichment analysis with miR-125b, miR-181a, miR-593, and miR-1227 predicted target genes. The y axis represents the pathway term, and the x axis represents the enrichment significance (−log10 p value), respectively. (C) Real-time RT-PCR analysis of miRNA predicted target gene mRNA levels in HCT116 cells after 24 h of butyrate treatment. miR-125b, TRIM29 and ZEB1; miR-181a, COX2, FZD4, LRP6, and PIK3R3; miR-593, CCND1, EEF2K, ERBB2, MET, and PAK2; miR-1227, DVL3, NUP62 and PIK3R3 in HCT116 cells treated with 0 mM or 2.5 mM butyrate for 24 h, over a 72-h post-transfection period. The mean mRNA levels ± SEM of five replicates is represented and their expression is normalized to the geometric mean of three reference genes, ACTB, B2M, and GAPDH. Significant values are indicated by ∗p <.05, ∗∗p <.01, ∗∗∗p <.001, ∗∗∗∗p <.0001. NC, NC mimic.
Two predicted targets of miR-125b, TRIM29 and ZEB1, were examined. miR-125b mimics significantly reduced levels of TRIM29 by ∼2-fold in the absence of butyrate. In contrast, butyrate alone significantly increased TRIM29 transcripts, and miR-125b mimics were not repressive under butyrate conditions. ZEB1 was not inhibited by the miR-125b mimics, but it was induced by butyrate. Four predicted targets of miR-181a were examined: COX2, FZD4, LRP6, and PIK3R3. miR-181a mimics significantly decreased mRNA levels of COX2 (∼2-fold), FZD4 (∼1.3-fold), and PIK3R3 (∼1.3-fold), whereas they slightly but significantly increased LRP6 transcript levels (∼1.2-fold). Butyrate alone induced the expression of all four genes, and miR-181b mimics were not repressive under butyrate conditions, except marginally for FZD4. Interestingly, the combination of miR-181a mimics and butyrate increased transcript levels of three of the four genes (COX2, LRP6, and PIK3R3) more than butyrate alone.
Five predicted targets of miR-593 were examined: CCND1, EEF2K, ERBB2, MET, and PAK2. miR-593 mimics significantly decreased the transcript levels of CCND1 (∼3-fold), EEF2K (∼1.7-fold), and MET (∼1.5-fold). Butyrate alone was strongly repressive of all five of these target genes. The combination of miR-593 mimics with butyrate did not greatly alter the butyrate response, although, for EEF2K, the combination was slightly more repressive than butyrate alone. Three predicted targets of miR-1227 were examined: DVL3, NUP62, and PIK3R3. miR-1227 mimics significantly decreased expression of DVL3 (∼1.2-fold) and NUP62 (∼1.8-fold), but not PIK3R3. Butyrate alone moderately repressed DVL3 and more strongly repressed NUP62; however, it induced PIK3R3 expression. The combination of miR-1227 mimics and butyrate did not alter butyrate response of DVL3 and NUP62, but the mimics did significantly inhibit the butyrate-mediated induction of PIK3R3 transcript levels. Overall, these data identified several genes that may be targets of the miRNAs under study, including TRIM29 (miR-125b); COX2 and PIK3R3 (miR-181a); CCND1, MET, and EEF2K (miR-593); and DVL3 and NUP62 (miR-1227).
Protein expression of predicted target genes is reduced by miRNA and butyrate in combination
To further validate the potential miRNA targets identified through mRNA expression analysis (Figure 5C), their protein levels were examined by immunoblotting after transfection of HCT116 cells with miRNA mimics, alone and in combination with butyrate (Figure 6). Data showing normalization of protein levels are provided in Figure S5. TRIM29 is a proposed target of miR-125b. Neither miR-125b mimics nor butyrate alone altered TRIM29 protein levels; however, the combination of miR-125b and butyrate significantly reduced TRIM29 protein. This result differs from the effects of these epigenetic regulators on TRIM29 mRNA levels, where butyrate alone and in combination with the mimic increased expression. COX2 and PIK3R3 are proposed targets of miR-181a. Transfection of miR-181a mimics alone significantly reduced protein levels of PIK3R3, but not COX2. Notably, COX2 had relatively low protein levels in HCT116 cells. Butyrate alone did not alter PIK3R3 protein levels, and the combination of butyrate and miR-181a resulted in no further reduction in PIK3R3 protein levels compared with miRNA alone. Butyrate alone decreased COX2 protein levels, and the combination of butyrate and miR-181a did not significantly alter the PIK3R3 protein levels relative to butyrate alone. CCND1, EEF2K, and MET are proposed targets of miR-593. All three proteins showed reduced levels after transfection of miR-593 mimics alone. Levels of all three proteins were also reduced by butyrate alone. Moreover, for both EEF2K and MET, the combination of miR-593 and butyrate significantly decreased protein levels to a greater extent than either miR-593 or butyrate alone. These data are broadly consistent with mRNA level data and confirm all three genes are miR-593 targets that are also repressed by butyrate. DVL3 and NUP62 are proposed targets of miR-1227. Transfection of miR-1227 mimics alone significantly reduced NUP62 protein levels, while DVL3 appeared slightly reduced but the response was not significant. Butyrate alone significantly reduced protein levels of DVL3; moreover, the combination of miR-1227 and butyrate significantly decreased protein levels to a greater extent than either miR-1227 or butyrate alone. In contrast, there was no cooperative effect of miR-1227 and butyrate in regulation of NUP62 protein levels. Again, these data are broadly consistent with the mRNA level data shown in Figure 5 and support DVL3 and NUP62 being miR-1227 targets.
Figure 6.

Protein expression changes of miRNA predicted targets
(A and B) (A) Western blots of HCT116 cells transfected with miR-125b, miR-181a, miR-593, miR-1227 or NC mimics for 48 h, followed by 24 h of treatment with 0 mM or 2.5 mM butyrate. Cells were analyzed at 72 h post transfection. (B) The protein fold change (intensity) of bands ± SEM of the triplicates is represented for relative protein quantification, and the levels normalized to total protein loaded (Figure S5). All significant results are indicated by ∗p < 0.05, ∗∗p < 0.01, ∗∗∗p < 0.001, ∗∗∗∗p < 0.0001. NC, NC mimic.
RNA interference of DVL3 and PIK3R3 mimics upstream miRNA activities
DVL3 and PIK3R3 are known to be involved in important pro-proliferative pathways. To determine whether these genes may be involved in the inhibitory effects of miRNAs and butyrate on CRC cell proliferation, HCT116 cells were transfected with DVL3, PIK3R3, or control (NC) small interfering RNAs (siRNAs), and treated with or without butyrate. The knockdown efficiency for DVL3 was determined to be ∼80% and PIK3R3 ∼73% (Figure 7A). DVL3 knockdown alone did not have a significant effect on proliferation. Butyrate alone reduced cell proliferation by ∼2-fold as expected. The combination of butyrate and DVL3 knockdown was slightly but significantly more inhibitory than butyrate alone, with the CDI calculation indicating a weakly synergistic effect at 0.91 (Figures 7B and 7C, top panels). PIK3R3 knockdown alone significantly reduced cell proliferation by almost 2-fold. Moreover, PIK3R3 knockdown greatly enhanced the inhibitory effect of butyrate, leading to ∼6-fold reduction in proliferation relative to control conditions, with CDI calculation indicating a robustly synergistic effect at 0.44 (Figures 7B and 7C, bottom panels). Overall, these effects were broadly similar to the effects of overexpressing the proposed upstream miRNA regulators of these genes (miR-1227 and miR-181a).
Figure 7.

siRNA targeting of DVL3 and PIK3R3 predicted target genes
(A–C) mRNA levels of DVL3 or PIK3R3 in CRC cells (A) HCT116 cells transfected with NC, DVL3, and PIK3R3 siRNAs for 72 h. The mean mRNA levels ±SEM (n = 3) are represented, and their expression is normalized to the geometric mean of three reference genes, ACTB, B2M, and GAPDH. Real-time cell index measurements using the xCELLigence RTCA platform, in (B) HCT116 cells transfected with NC, DVL3, and PIK3R3 siRNAs for 48 h, followed by 24 h of treatment with 0 mM or 2.5 mM butyrate. Cells were analyzed at 72 h post transfection. (C) The mean ± SEM (n = 4) is shown at 72 h post transfection with DVL3 or PIK3R3 siRNA. Significant results are indicated by ∗p < 0.05, ∗∗∗p < 0.001, ∗∗∗∗p < 0.0001. NC, NC mimic.
WNT signaling is hyperactivated by miRNAs
Several miRNAs that were found to alter CRC proliferation and survival in this study had predicted mRNA targets known to be involved in the WNT signaling pathway (e.g., DVL3, FZD4, LRP6, CCND1). Many of these WNT-associated targets were also butyrate responsive. The WNT pathway is known to play a critical role in initiation and progression of CRC.23 HCT116 cells have high WNT activity as they express a constitutively active mutant CTNNB1 (β-catenin) allele. They also carry the WT APC allele.24 RKO cells are classified as low WNT activity cells, as they have WT CTNNB1 and APC alleles as well as a mutant form of CDX2, which is involved in APC and AXIN2 activation.25 Four butyrate-sensitizing miRNAs, miR-125b, miR-181a, miR-593, and miR-1227, were examined for their capacity to alter WNT/β-catenin signaling using a TCF/LEF reporter TOPFlash assay in HCT116 and RKO cells. All assays were performed in the presence and absence of miRNA mimics, butyrate, and WNT3A. In HCT116 cells, WNT3A alone increased TOPFlash reporter activity by ∼4-fold, while butyrate alone greatly increased TOPFlash activity by ∼200-fold (Figure 8A). Of the four miRNAs transfected, only miR-181a alone (i.e., in the absence of WNT3A or butyrate) significantly increased TOPFlash activity by ∼2-fold. When mimics were transfected in the presence of WNT3A, both miR-125b and miR-181a significantly increased activation of TOPFlash relative to that induced by ligand alone, while miR-1227 slightly reduced activation. In general, the miRNAs did not alter the ability of butyrate to activate TOPFlash, although miR-593 very slightly reduced the response. When WNT3A and butyrate were both applied to cells, miR-181 was the only mimic that could significantly increase TOPFlash activity above the level produced by the combination of both drugs. Overall, these data suggest that miR-181a and miR-125b can potentiate WNT responses in HCT116 cells. Relative to HCT116 cells, RKO cells showed much greater activation of TOPFlash by WNT3A alone (∼50-fold), and the reporter was robustly repressed by butyrate alone (∼10-fold). Interestingly, butyrate was not repressive in the presence of WNT3A, and instead potentiated activation of TOPFlash by the ligand. Of the four miRNAs tested, only miR-1227 and miR-181a alone (i.e., in the absence of WNT3A or butyrate) significantly induced TOPFlash activity (Figure 8B). The miRNAs were not able to potentiate the response of TOPFlash to WNT3A, nor did they increase the response to the combination of WNT3A and butyrate; in fact, miR-125b and miR-1227 slightly reduced activation in the latter condition. All miRNAs also induced a small reduction in TOPFlash activity in cells treated with butyrate but no ligand. Overall, these data further support the idea that miR-181a can potentiate WNT responses in CRC and suggest miRNA activities may depend on cell-type specific variables that define the threshold for WNT target activation.
Figure 8.

Butyrate-responsive miRNAs and butyrate alter WNT-reporter activity in HCT116 and RKO cells
(A and B) WNT-reporter activity in (A) HCT116 or (B) RKO cells reverse transfected with TOPFlash vectors and butyrate-sensitizing miRNAs miR-125b, miR-181a, miR-593, or miR-1227, for 48 h, followed by 24 h of treatment with 0 mM or 2.5 mM butyrate. Cells were analyzed at 72 h post transfection. The mean ± SEM of four replicates is shown. Significant results are indicated by ∗p < 0.05, ∗∗p < 0.01, ∗∗∗p < 0.001, ∗∗∗∗p < 0.0001. NC, NC mimic.
Discussion
Butyrate is a naturally occurring HDACi with the ability to inhibit proliferation, promote apoptosis, and regulate the cell cycle in CRC cells by altering the expression of genes, including those for non-coding RNAs such as miRNAs. The anti-cancer effects of butyrate may be mediated in part through suppression of specific oncogenic miRNAs. In addition, miRNAs could function cooperatively with other tumor-suppressing epigenomic changes induced by butyrate. The overarching goal of this project was to identify cooperative activity between miRNAs and butyrate that may ultimately inform the development of novel therapeutic approaches to CRC that combine small RNAs with butyrate or other HDAC inhibitors. An unbiased high-throughput functional screen identified 13 miRNAs that synergized with butyrate to reduce cell proliferation and promote apoptosis in CRC cells. From this list of putatively butyrate-sensitizing miRNAs, miR-125b, miR-181a, miR-593, and miR-1227 were empirically selected for further analysis. While the three miRNAs with lowest CDI values were studied in detail, others that showed a synergistic response with butyrate, such as miR-29b-2-5p, miR-509-5p, miR-1256, miR-1265, miR-3179, and miR-3654, may also identify useful drug targets and could be examined in future studies.
miR-125b, miR-593, and miR-1227 were all confirmed to enhance the pro-apoptotic activity of butyrate. The pro-apoptotic effects of miR-1227 in both HCT116 and LIM1215 cancer cells are a novel finding in this study. While both cell lines display dysregulated WNT signaling, their genotypes otherwise differ, suggesting a consistent CRC response to the miRNAs. Previous studies have shown that miR-593 can induce apoptosis and inhibit cell proliferation in lung cancer and hepatocellular carcinoma cells.26,27 Conversely, miR-593 was shown to have oncogenic properties in prostate cancer cells,28 suggesting cell-type-specific responses. In contrast to a previous report,29 miR-181a was not found to induce apoptosis of HCT116 cells in the absence of butyrate. This discrepancy may relate to differences in methodology, or heterogeneity between cell lines maintained in different laboratories.30 However our finding that miR-181a reduces HCT116 cell proliferation was consistent with a previous report.31 All four miRNAs examined increased caspase activity in noncancerous HFF, highlighting the need to mitigate any potential toxicity to normal cells when considering RNA-based cancer therapeutics.32,33
Dysregulation of the cell cycle is critical in promoting uncontrolled cell division and contributing to the development of cancer. The anti-cancer properties of butyrate are partly attributed to cell-cycle regulation through induction of cell-cycle inhibitors such as CDKN1A and GADD45A, and inhibition of cell-cycle progression genes CCND1, CCNA2, and CDK6.10,34,35 This study demonstrated that butyrate inhibits cell proliferation by causing accumulation of CRC cells in the G2/M phase. Previous studies support this observation, with 5 mM butyrate demonstrated to induce G2/M phase cell-cycle arrest in HCT116, RKO, and SW480 CRC cells.36,37 Interestingly, studies have shown that butyrate can also induce G0/G1 cell-cycle arrest in other CRC cell lines, including Caco-2 and HT29.35,38 These different responses may relate to differences in the mutational status of these CRC models. We found that miR-181a and miR-593 enhanced the ability of butyrate to induce G2/M phase blockade and reduce the number of cells in S phase. While these miRNAs are poorly characterized in CRC cells, there is evidence that miR-181a is involved in cell-cycle regulation in other contexts. For example, miR-181a induced G1 arrest in prostate cancer cells,39 but conversely promoted cell-cycle progression and proliferation in gastric cancer.40 Overall, these data suggest that the effects of miR-181a on the cell cycle are context specific. Although miR-1227 enhanced the ability of butyrate to reduce cell proliferation, miR-1227 mimics did not enhance the ability of butyrate to induce G2/M arrest, and instead increased the fraction of cells in S phase. Mechanisms that induce S-phase arrest in HCT116 cells (e.g., in response to cytotoxic drugs) include inhibition of DNA synthesis proteins such as topoisomerase41,42; whether such mechanisms are involved in miR-1227-mediated S-phase accumulation requires further investigation. Although miR-125b was previously shown to induce G2/M phase arrest in HCT-8 CRC cells,43 this miRNA had no effect on the cell cycle in the current study, suggesting that it may regulate proliferation through alternative mechanisms in HCT116 cells.
The ability of specific miRNAs to modulate cell proliferation, cell cycle, and apoptosis is generally due to modulation of specific downstream target mRNAs. Pathway enrichment analysis of predicted miRNA target genes revealed significant overrepresentation of genes in cancer-related growth pathways, including WNT and PI3K signaling under the Gene Ontology (GO) term “pathways in cancer.” WNT-related target genes were common among all miRNAs and included TRIM29 (miR-125b); COX2, FZD4, LRP6 (miR-181a); CCND1 (miR-593); and NUP62 and DVL3 (miR-1227). All miRNA mimics were able to reduce the transcript levels of their predicted target genes, although further work is required to determine whether this involves direct miRNA:mRNA binding. These target genes showed diverse responses to butyrate treatment. Notably, all the miR-125b and miR-181a target genes examined were induced by butyrate, while most of the miR-593 and miR-1227 target genes were repressed by butyrate. The induction of mRNA targets of miR-125b and miR-181a may be due to the global effect of HDACi on increasing chromatin accessibility and hence transcriptional activation. In contrast, the repression of miR-593 and miR-1227 target genes may be mediated by induction of repressors that control these genes at transcriptional or post-transcriptional levels, including the miRNAs themselves.
Four of six miRNA targets that were reduced at the mRNA level by their cognate miRNA mimics also showed reduction at the protein level. A lack of correlation in miRNA-mediated changes in mRNA and protein expression levels is not uncommon44, 45, 46 and likely reflects the multiple modes of regulation involved, including transcription, translation, and RNA and protein turnover.47,48 In addition, miRNAs can regulate protein synthesis by destabilizing their target mRNAs in order to decrease mRNA abundance or by inducing translational inhibition that does not affect mRNA levels.49
To assess whether specific downstream target genes were responsible for the butyrate-sensitizing effects of miRNAs, selected targets (PIK3R3, DVL3) were knocked down by RNA interference, and proliferation was examined. PIK3R3 knockdown had the most potent effect on HCT116 growth alone and in combination with butyrate, echoing the effects of miR-181a mimics. In contrast, DVL3 knockdown had only a modest effect on proliferation, in contrast to the potent anti-proliferative effect of miR-1227. The effects of miR-1227 may be primarily mediated through other targets that are yet to be identified. PIK3R3 encodes the regulatory subunit of the PI3K signaling complex. PIK3R3 is mutated, or overexpressed, in many solid tumors and it has been associated with epithelial to mesenchymal transition in CRC.50 A previous study demonstrated that the combination of PI3K catalytic subunit inhibitors (Wortmannin or LY294002) and 5 mM butyrate was pro-apoptotic and anti-proliferative in KM20 cells.51 This highlights the importance of phosphoinositide 3-kinase (PI3K) signaling in the butyrate response, as a potent anti-cancer effect can be induced by inhibiting either the catalytic subunit51 or the PIK3R3 regulatory subunit, as shown in the current study. Future work could be directed at examining the therapeutic benefits of combined HDACi and PIK3 pathway inhibition in CRC.
Many miRNA targets that were investigated in this study, including TRIM29, COX2, PIK3R3, CCND1, EEF2K, and DVL3, have been shown to be overexpressed in CRC and involved in promoting cell proliferation, migration, invasion, and metastasis.52, 53, 54, 55, 56, 57, 58, 59, 60 In addition, some of these targets, including COX2 and CCND1, are known to be reduced after butyrate treatment of CRC cells.10 Of particular interest was the enrichment of genes involved in WNT signaling within the predicted targetome of the butyrate-sensitizing miRNAs. WNT is a critically dysregulated growth pathway in CRC.61 Moreover, butyrate is a well-known modulator of WNT signaling with the ability to regulate >1,000 genes in a WNT-specific manner in CRC cells.62 HCT116 cells express a constitutively active β-catenin allele and display high basal WNT signaling. Butyrate-induced WNT hyperactivity may also create the synthetic lethal context for inducing apoptosis that was exploited in this functional screen. All the butyrate-sensitizing miRNAs examined in this study had at least one predicted target gene that can be functionally linked to WNT signaling. DVL3 is a hub phosphoprotein that negatively regulates the destruction complex and stabilizes β-catenin to promote gene expression.63 TRIM29 is involved in promoting WNT signaling through the regulation of β-catenin stabilization, localization, and expression.52 Knockdown of TRIM29 in CRC resulted in reduction of β-catenin expression and nuclear accumulation.52,64 Evidence also supports the association of the nuclear pore protein, NUP62, with β-catenin nuclear import; however, the extent to which it regulates WNT signals remains undefined.65 Some other genes, such as COX2 (proinflammatory protein) and CCND1 (cell-cycle regulator), are direct targets of the β-catenin/TCF/LEF transcriptional complex.66,67
To explore the role of the butyrate-sensitizing miRNAs in canonical WNT signaling, a WNT/β-catenin reporter assay was used in cell lines with differing basal WNT activity. RKO cells showed robust induction of WNT-reporter activity by WNT3A, while HCT116 cells showed minimal response. This can be attributed to the differential expression of ligand-dependent WT β-catenin versus constitutively active mutant β-catenin in these cell lines. Indeed, previous reports show that WNT3A induces a dose-dependent increase in WT β-catenin levels in RKO cells, but does not alter mutant β-catenin levels in HCT116 cells.68 Butyrate alone dramatically induced WNT-reporter activity in HCT-116 cells. The WNT pathway is considered pro-proliferative in CRC; hence, it was somewhat surprising that anti-proliferative butyrate induced WNT activity. However, activity of the TOPFlash reporter, which has multimeric TCF-binding sites, may not be reflective of the native pro-proliferative WNT targetome. Indeed, known pro-proliferative WNT targets such as CCND1 have a single TCF/β-catenin-binding site in their promoter, whereas targets such as AXIN2 that provide negative feedback to the WNT pathway have multiple binding sites.69 Such different promoter configurations can confer different regulatory mechanisms and outcomes. RKO cells showed reduced WNT-reporter activity after 24 h of butyrate exposure. This was in contrast to a previous study that found weak induction of WNT activity in RKO cells after 48-h exposure to 5 mM butyrate.70 Given that WNT signaling is under tight temporal control via the AXIN-mediated feedback loop, the discrepancy between our findings and this previous report could relate to differences in timing. To better understand the role of WNT pathway modulation in the anti-cancer effects of butyrate, future work could examine the temporal effect of butyrate on the global WNT targetome in a variety of CRC cells with different WNT pathway mutations. As WNT signaling also regulates the stem cell characteristics of enterocytes, it may be inferred that the stemness of cultured CRC cells is modulated by the treatments described in this study. Also, this may induce heterogeneity within cultures that could explain phenomena such as the aforementioned discordance between mRNA and protein levels for miRNA targets. However, HCT116 cells are thought to consist mainly of stem-like cells with considerable plasticity rather than being a hierarchical model with clear clonal progression,71 making this explanation less likely.
Although none of the miRNAs investigated in this study synergized with WNT3A or butyrate in the regulation of WNT-reporter activity, miR-181a and miR-1227 both significantly increased activity in the absence of WNT ligand in RKO cells. The very high level of reporter activity in the presence of WNT3A may have provided little capacity for miRNAs to further induce activity in this model (i.e., a ceiling effect). Interestingly, miR-181a also increased β-catenin activity in both the presence and absence of WNT ligand in HCT116 cells. This result contrasts with a previous report that miR-181a can inhibit WNT signaling in HCT116 cells, and targets both β-catenin and TCF4.31,72 However, miR-181a is also known to inhibit the WNT signaling inhibitor WIF1 in CRC cells,73 suggesting that miR-181a has multifactorial roles in WNT signaling, and its effects may depend on the balance of other WNT pathway factors present in cells.
Conclusion
Overall, this study identified several miRNAs and potential target genes that could enhance the ability of butyrate to reduce CRC cell proliferation and induce apoptosis. Butyrate-sensitizing miRNAs were found to promote the inhibition of cell-cycle progression, while predicted miRNA targets were involved in key cancer-related growth pathways, including WNT and PI3K signaling. Further analysis of the potent anti-cancer effects of PIK3R3 inhibition in combination with butyrate is warranted, particularly in 3D culture and in vivo models. Moreover, further study of both butyrate-sensitizing miRNAs and miRNAs that inhibit the butyrate response could help to unravel mechanisms by which butyrate exerts anti-cancer activity. Ultimately, such studies could provide a basis for developing miRNAs as potential therapeutics for CRC.
Materials and methods
Cell culture
Human HCT116 and LIM1215 colorectal carcinoma cells were acquired from American Type Culture Collection (ATCC). Cells were maintained at 37°C and 5% CO2 in McCoy’s 5A (modified) medium or Dulbecco’s modified Eagle’s medium (DMEM) (Invitrogen) containing 10% fetal bovine serum (Bovogen Biologicals) respectively. Cells were grown to <85% confluence and maintained mycoplasma free.
Functional high-throughput screen
Reverse transfection of HCT116 cells was performed in poly-L-lysine-coated 384-well plates in duplicate with a miRNA mimic library (1,280 mature miRNAs, Human miRIDIAN miRNA Mimic Library V16, Dharmacon) or siRNA controls. siRNA controls on each plate included “positive death” control siRNAs siPLK1 and siTOX (Dharmacon RNAi Technologies), positive miRNA mimic control miR-18a, NC siRNA (GenePharma) ON-TARGETplus Non-targeting Control siRNA (OTP-NT) (Dharmacon), and mock transfection control (lipid only). In brief, HCT116 cells (1,400 cells/well in 25 μL of McCoy’s 5A [modified] medium) were seeded into each well containing 12.5 μL of transfection mix (0.06 μL of DharmaFECT 2 in 10.565 μL of Opti-MEM and 1.875 μL of miRNA mimic [stock concentration 0.5 μM] to give a final concentration of 25 nM or 0.06 μL of DharmaFECT 2 in 10.94 μL of Opti-MEM and 1.5 μL of siRNA [stock concentration 1 μM] to give a final concentration of 40 nM). Plates were incubated at room temperature for 20 min and then incubated at 37°C for 24 h. Medium was changed on all assay plates 24 h post transfection with 50 μL of pre-warmed medium added to each well. Plates were incubated for a further 24 h before being treated with no butyrate or a sublethal dose of 2.5 mM butyrate (non-treatment or treatment plates) as part of another full medium change. At the 72-h endpoint, cells were subjected to an ApoLive-Glo Multiplex assay (Promega). Liquid handling steps were performed using a BioTek EL406 (BioTek, Burlington, VT) and SciClone ALH3000 Automated Liquid Handler (PerkinElmer, Hopkinton, MA).
The ApoLive-Glo Multiplex assay (CellTitre-Fluor (CTF) followed by Caspase-Glo 3/7 in the same wells) was performed at 72 h post transfection as per manufacturer’s instructions. Each well was incubated with 5 μL of CTF at 37°C in a humidified incubator for 1 h 30 min. Fluorescent changes were quantified using a Synergy H4 plate reader (BioTek). Each well was then incubated with 12 μL of Caspase-Glo 3/7 at room temperature for 30 min and luminescence was measured using the same plate reader.
Hit selection
Quality control analysis was performed to determine the quality and reliability of the screen data, including the dynamic range between the positive controls and NCs using the Z′ factor and Pearson correlation.74 Raw values for individual replicates were normalized to the average of the raw values for the OTP-NT NC for the same plate. An average of normalized values for duplicates was calculated to obtain the final normalized value per treatment. Cell viability (CV) results were categorized as Hi:> 1.15 fold change relative to NC (increase), CV1: between 0.8 and 1.15 (no change), CV2: between 0.8 and 0.5 (decrease), lethal cell viability (LC): < 0.5 (lethal effect). Caspase data were analyzed using Z score distribution,75 with a robust Z score >2 indicating significant caspase activity and an average fold change ratio, a positive ratio (>1) indicated increased apoptosis when the miRNA was effective with butyrate treatment compared with the NC. For viability, hits were classified into distinct subgroups: hit 1 was defined as vehicle CV1 and drug CV2, hit 2 was defined as vehicle CV1/CV2 and drug LC, hit 3 was defined as vehicle CV1/Hi and drug CV2/CV1, and hit 4 was defined as vehicle Hi and drug CV1. For caspase activity, Z score distribution and positive fold change values were used, with a robust Z score >2 and positive fold change ratio >1 indicating significant caspase activity. These values were ranked as Hi and then sorted on vehicle versus drug.
Cell proliferation and apoptosis assays
Reverse transfections were performed using HCT116 or LIM1215 cells seeded in 16-well E-plates (xCELLigence proliferation assays; ACEA Biosciences), 96-well plates (apoptosis), or 24-well plates (RNA and protein extractions). miRNA mimics or NC scramble mimics were reverse transfected into cells at a final concentration of 20 nM using Lipofectamine 2000 (Invitrogen) lipid reagent. After 48 h post transfection, cells were treated with 2.5 mM butyrate for a further 24 h and results collected at the 72-h endpoint.
Proliferation changes were detected using the xCELLigence RTCA DP platform (ACEA Biosciences) and measured as cell index (electrical impedance in the cell medium). Proliferation changes were measured every 30 min over a 72-h incubation period. The coefficient of drug interaction was calculated for proliferation data using the calculation CDI = AB/(A × B), whereby A is miRNA mimic/inhibitor/siRNA to NC ratio, B is 2.5 mM butyrate treatment to NC, and AB is a combination of miRNA mimic/inhibitor/siRNA and 2.5 mM butyrate treatment to NC ratio.76 CDI < 1, = 1, or >1 indicates that the drugs are synergistic, additive, or antagonistic, respectively, and a CDI <0.7 indicates that the drug is significantly synergistic.
Apoptosis was measured at 72 h post transfection using CellPlayer 96-well Caspase 3/7 reagent (Essen BioScience) as per the manufacturer’s instructions. The Incucyte FLR (Essen BioScience) was used to image fluorescence changes in cells. Cell images were used to calculate the fluorescent cell count, using the IncuCyte Object Counting v2.0 Analysis software (Essen BioScience).
miRNA target prediction and pathway analysis
miRWalk77 was used to collate information about predicted miRNA target genes using eight prediction programs: DIANA-microT-CDS,78 miRanda,79,80 miRDB,81 miRWalk,77 PicTar2,82 PITA,83 RNA22,84 and TargetScan.85 Predicted target genes were labeled as hits if four or more prediction programs identified those genes as possible miRNA targets (specifically if miRNAs had 3′ UTR binding sites for those genes). Gene lists were compiled and transferred into ShinyGO86 online graphical gene-set enrichment tool for KEGG pathway enrichment analysis.87
Real-time RT-PCR
Total RNA was extracted using TRIzol reagent (Thermo Fisher Scientific) according to the manufacturer’s protocol. For mRNA expression analysis, RNA was DNAse I treated, and cDNA synthesized using 25-μL reactions of M-MLV Reverse Transcriptase (Promega), RNase H minus (Promega), random hexamer primers (NEB), and 1 μg of total RNA. Real-time qPCR was performed using Power SYBR Green Mastermix (Applied Biosystems) in 20-μL reactions including 18 μL of Mastermix and 2 μL of cDNA product (1:5 dilution). Primers were designed using Primer-Blast (NCBI) and purchased from GeneWorks or Sigma-Aldrich (sequences are listed in Table S3). Raw data were normalized against the geometric mean of the reference genes GAPDH, B2M, and B-actin.
Immunoblots
Whole cell protein was extracted using radioimmunoprecipitation assay (RIPA) buffer and quantified using EZQ protein quantification kit (Invitrogen). SDS-PAGE was performed using 25–35 μg of protein extracts in pre-cast Mini-PROTEAN TGX Stain-Free Gels (Bio-Rad), and proteins were transferred to polyvinylidene difluoride (PVDF) membranes using the Trans-Blot Turbo transfer system (Bio-Rad). Membranes were blocked with 5% BSA or skim milk powder for 1 h in TBS-T prior to overnight incubation with Cyclin D1 (92G2) Rabbit Monoclonal Antibody (mAb) #2978, COX2 Antibody #4842, Dvl3 Antibody #3218, eEF2k Antibody #3692, Met (D1C2) XP Rabbit mAb #8198, PI3 Kinase p55 (D2B3) Rabbit mAb #11889 (Cell Signaling Technology), NUP62 Antibody ab140651 (Abcam), TRIM29 Antibody GTX115749 (Genetex, CA, United States). Membranes were exposed to secondary horseradish peroxidase-conjugated donkey anti-rabbit immunoglobulin G (IgG) (Immunopure) in 5% skim milk powder for 1 h. Enhanced chemiluminescence (ECL) detection (SuperSignal West Pico) was used to visualize protein bands using the ChemiDoc MP Imaging system (Bio-Rad). Total protein normalization was used to analyze the data.
WNT signaling activity
TOPFlash and FOPflash (NC) WNT/β-catenin activity assay plasmids were purchased from Merk Millipore. HCT116 cells were seeded at 7,500 per well in 96-well clear Greiner plates and incubated at 37°C for 24 h. Cells were then transfected with 50 ng per well TOP/FOP flash vector (Firefly luciferase), 5 ng per pRL Null vector (Renilla luciferase), and 20 nM miRNA mimics, using Lipofectamine 2000 and Opti-MEM. Cells were incubated for a further 24 h at 37°C. Cells were exposed to medium from L cells with and without WNT3a and treated 2.5 mM butyrate in selected wells. Control wells did not have butyrate added to conditioned medium. Cells were incubated for a further 24 h at 37°C. At 72 h, Dual-Luciferase Reporter Assays were performed (Promega) as per manufacturer’s instructions and luminescence detected using an EnSight plate reader (PerkinElmer).
Statistical analysis
Data were graphically presented using GraphPad Prism (GraphPad Software) and statistically analyzed using unpaired t tests, with a p value <0.05 indicating statistical significance. Graphs display the mean of at least n = 3 ± standard error of the mean (SEM).
Data availability statement
Raw data, relating to the hits described, are available upon request.
Acknowledgments
The authors thank Darling Rojas-Canales for providing valuable experimental advice and Shashikanth Marri for bioinformatics support. We thank members of the Victorian Centre for Functional Genomics at Peter MacCallum Cancer Centre for screen support. This project was generously supported by grants from Flinders Foundation and Tour de Cure, Australia. It was also undertaken with the financial support of Cancer Council’s Beat Cancer Project on behalf of its donors and the South Australian State Government through the Department of Health. The Victorian Centre for Functional Genomics (K.J.S.) is funded by the Australian Cancer Research Foundation (ACRF), Phenomics Australia (PA) through funding from the Australian Government’s National Collaborative Research Infrastructure Strategy (NCRIS) program, the Peter MacCallum Cancer Centre Foundation, and the University of Melbourne Research Collaborative Infrastructure Program (MCRIP). The funding agencies had no role in the design of the study; in the collection, analyses, or interpretation of data; in the writing of the manuscript; or in the decision to publish the results.
Author contributions
Concept, S.R.A., K.J.H., R.M., and M.Z.M.; methodology, S.R.A., K.J.H., R.M., K.J.S., and M.Z.M.; software, S.R.A., validation, S.R.A.; formal analysis, S.R.A. and K.J.H.; investigation, S.R.A. and K.J.H.; resources, M.Z.M. and R.A.M.; writing – original draft preparation, S.R.A.; writing – review & editing, R.M., M.Z.M., K.J.S., K.J.H., and R.A.M.; visualization, S.R.A.; supervision, M.Z.M., R.M., and R.A.M.; project administration, S.R.A. and M.Z.M.; funding acquisition, M.Z.M. and R.A.M. All authors have read and agreed to the published version of the manuscript.
Declaration of interests
The authors declare no competing interests.
Footnotes
Supplemental information can be found online at https://doi.org/10.1016/j.omtn.2022.08.037.
Supplemental information
References
- 1.Bray F., Ferlay J., Soerjomataram I., Siegel R.L., Torre L.A., Jemal A. Global cancer statistics 2018: GLOBOCAN estimates of incidence and mortality worldwide for 36 cancers in 185 countries. CA Cancer J Clin. 2018;68:394–424. doi: 10.3322/caac.21492. [DOI] [PubMed] [Google Scholar]
- 2.Haggar F.A., Boushey R.P. Colorectal cancer epidemiology: incidence, mortality, survival, and risk factors. Clin. Colon Rectal Surg. 2009;22:191–197. doi: 10.1055/s-0029-1242458. [DOI] [PMC free article] [PubMed] [Google Scholar]
- 3.Danese E., Montagnana M. Epigenetics of colorectal cancer: emerging circulating diagnostic and prognostic biomarkers. Ann. Transl. Med. 2017;5:279. doi: 10.21037/atm.2017.04.45. [DOI] [PMC free article] [PubMed] [Google Scholar]
- 4.Lao V.V., Grady W.M. Epigenetics and colorectal cancer. Nat. Rev. Gastroenterol. Hepatol. 2011;8:686–700. doi: 10.1038/nrgastro.2011.173. [DOI] [PMC free article] [PubMed] [Google Scholar]
- 5.Tse J.W.T., Jenkins L.J., Chionh F., Mariadason J.M. Aberrant DNA methylation in colorectal cancer: what should we target? Trends Cancer. 2017;3:698–712. doi: 10.1016/j.trecan.2017.08.003. [DOI] [PubMed] [Google Scholar]
- 6.Cummings J.H., Pomare E.W., Branch W.J., Naylor C.P., Macfarlane G.T. Short chain fatty acids in human large intestine, portal, hepatic and venous blood. Gut. 1987;28:1221–1227. doi: 10.1136/gut.28.10.1221. [DOI] [PMC free article] [PubMed] [Google Scholar]
- 7.Davie J.R. Inhibition of histone deacetylase activity by butyrate. J. Nutr. 2003;133:2485S–2493S. doi: 10.1093/jn/133.7.2485S. [DOI] [PubMed] [Google Scholar]
- 8.Donohoe D.R., Collins L.B., Wali A., Bigler R., Sun W., Bultman S.J. The warburg effect dictates the mechanism of butyrate mediated histone acetylation and cell proliferation. Mol. Cell. 2012;48:612–626. doi: 10.1016/j.molcel.2012.08.033. [DOI] [PMC free article] [PubMed] [Google Scholar]
- 9.Fung K.Y., Cosgrove L., Lockett T., Head R., Topping D.L. A review of the potential mechanisms for the lowering of colorectal oncogenesis by butyrate. Br. J. Nutr. 2012;108:820–831. doi: 10.1017/S0007114512001948. [DOI] [PubMed] [Google Scholar]
- 10.Daly K., Shirazi-Beechey S.P. Microarray analysis of butyrate regulated genes in colonic epithelial cells. DNA Cell Biol. 2006;25:49–62. doi: 10.1089/dna.2006.25.49. [DOI] [PubMed] [Google Scholar]
- 11.Mariadason J.M. HDACs and HDAC inhibitors in colon cancer. Epigenetics. 2008;3:28–37. doi: 10.4161/epi.3.1.5736. [DOI] [PubMed] [Google Scholar]
- 12.Cummins J.M., He Y., Leary R.J., Pagliarini R., Diaz L.A., Jr., Sjoblom T., Barad O., Bentwich Z., Szafranska A.E., Labourier E., et al. The colorectal microRNAome. Proc. Natl. Acad. Sci. USA. 2006;103:3687–3692. doi: 10.1073/pnas.0511155103. [DOI] [PMC free article] [PubMed] [Google Scholar]
- 13.Lee Y.S., Dutta A. MicroRNAs in cancer. Annu. Rev. Pathol. 2009;4:199–227. doi: 10.1146/annurev.pathol.4.110807.092222. [DOI] [PMC free article] [PubMed] [Google Scholar]
- 14.Peng Y., Croce C.M. The role of MicroRNAs in human cancer. Signal Transduct. Target Ther. 2016;1:15004. doi: 10.1038/sigtrans.2015.4. [DOI] [PMC free article] [PubMed] [Google Scholar]
- 15.Hu S., Dong T.S., Dalal S.R., Wu F., Bissonnette M., Kwon J.H., Chang E.B. The microbe-derived short chain fatty acid butyrate targets miRNA-dependent p21 gene expression in human colon cancer. PLoS One. 2011;6:e16221. doi: 10.1371/journal.pone.0016221. [DOI] [PMC free article] [PubMed] [Google Scholar]
- 16.Concepcion C.P., Bonetti C., Ventura A. The microRNA-17-92 family of microRNA clusters in development and disease. Cancer J. 2012;18:262–267. doi: 10.1097/PPO.0b013e318258b60a. [DOI] [PMC free article] [PubMed] [Google Scholar]
- 17.Diosdado B., van de Wiel M.A., Terhaar Sive Droste J.S., Mongera S., Postma C., Meijerink W.J., Carvalho B., Meijer G.A. MiR-17-92 cluster is associated with 13q gain and c-myc expression during colorectal adenoma to adenocarcinoma progression. Br. J. Cancer. 2009;101:707–714. doi: 10.1038/sj.bjc.6605037. [DOI] [PMC free article] [PubMed] [Google Scholar]
- 18.Humphreys K.J., Cobiac L., Le Leu R.K., Van der Hoek M.B., Michael M.Z. Histone deacetylase inhibition in colorectal cancer cells reveals competing roles for members of the oncogenic miR-17-92 cluster. Mol. Carcinog. 2013;52:459–474. doi: 10.1002/mc.21879. [DOI] [PubMed] [Google Scholar]
- 19.Humphreys K.J., McKinnon R.A., Michael M.Z. miR-18a inhibits CDC42 and plays a tumour suppressor role in colorectal cancer cells. PLoS One. 2014;9:e112288. doi: 10.1371/journal.pone.0112288. [DOI] [PMC free article] [PubMed] [Google Scholar]
- 20.Ali S.R., Orang A., Marri S., McKinnon R.A., Meech R., Michael M.Z. Integrative transcriptomic network analysis of butyrate treated colorectal cancer cells. Cancers. 2021;13 doi: 10.3390/cancers13040636. [DOI] [PMC free article] [PubMed] [Google Scholar]
- 21.Ahmed D., Eide P.W., Eilertsen I.A., Danielsen S.A., Eknaes M., Hektoen M., Lind G.E., Lothe R.A. Epigenetic and genetic features of 24 colon cancer cell lines. Oncogenesis. 2013;2:e71. doi: 10.1038/oncsis.2013.35. [DOI] [PMC free article] [PubMed] [Google Scholar]
- 22.Whitehead R.H., Macrae F.A., St John D.J., Ma J. A colon cancer cell line (LIM1215) derived from a patient with inherited nonpolyposis colorectal cancer. J. Natl. Cancer Inst. 1985;74:759–765. [PubMed] [Google Scholar]
- 23.Polakis P. Wnt signaling and cancer. Genes Dev. 2000;14:1837–1851. doi: 10.1101/gad.14.15.1837. [DOI] [PubMed] [Google Scholar]
- 24.Ilyas M., Tomlinson I.P., Rowan A., Pignatelli M., Bodmer W.F. Beta-catenin mutations in cell lines established from human colorectal cancers. Proc. Natl. Acad. Sci. USA. 1997;94:10330–10334. doi: 10.1073/pnas.94.19.10330. [DOI] [PMC free article] [PubMed] [Google Scholar]
- 25.Dang D.T., Mahatan C.S., Dang L.H., Agboola I.A., Yang V.W. Expression of the gut-enriched Kruppel-like factor (Kruppel-like factor 4) gene in the human colon cancer cell line RKO is dependent on CDX2. Oncogene. 2001;20:4884–4890. doi: 10.1038/sj.onc.1204645. [DOI] [PMC free article] [PubMed] [Google Scholar]
- 26.Gong X.Y., Huang A.L. Regulatory roles of miR-593 in the proliferation and invasion of human hepatic carcinoma. Eur. Rev. Med. Pharmacol. Sci. 2020;24:6657–6664. doi: 10.26355/eurrev_202006_21652. [DOI] [PubMed] [Google Scholar]
- 27.Wei F., Wang M., Li Z., Wang Y., Zhou Y. miR-593 inhibits proliferation and invasion and promotes apoptosis in non-small cell lung cancer cells by targeting SLUG-associated signaling pathways. Mol. Med. Rep. 2019;20:5172–5182. doi: 10.3892/mmr.2019.10776. [DOI] [PMC free article] [PubMed] [Google Scholar]
- 28.Huang Q., Peng L., Sun Y., Huang J., Han T., Li Y., Peng H. miR-593-3p promotes proliferation and invasion in prostate cancer cells by targeting ADIPOR1. OncoTargets Ther. 2021;14:3729–3737. doi: 10.2147/OTT.S310198. [DOI] [PMC free article] [PubMed] [Google Scholar]
- 29.Chi J., Liu S., Wu Z., Shi Y., Shi C., Zhang T., Xiong B., Zeng Y., Dong X. circNSUN2 promotes the malignant biological behavior of colorectal cancer cells via the miR-181a-5p/ROCK2 axis. Oncol. Rep. 2021;46 doi: 10.3892/or.2021.8093. [DOI] [PMC free article] [PubMed] [Google Scholar] [Retracted]
- 30.Ben-David U., Siranosian B., Ha G., Tang H., Oren Y., Hinohara K., Strathdee C.A., Dempster J., Lyons N.J., Burns R., et al. Genetic and transcriptional evolution alters cancer cell line drug response. Nature. 2018;560:325–330. doi: 10.1038/s41586-018-0409-3. [DOI] [PMC free article] [PubMed] [Google Scholar]
- 31.Han P., Li J.-w., Zhang B.-m., Lv J.-c., Li Y.-m., Gu X.-y., Yu Z.-w., Jia Y.-h., Bai X.-f., Li L., et al. The lncRNA CRNDE promotes colorectal cancer cell proliferation and chemoresistance via miR-181a-5p-mediated regulation of Wnt/β-catenin signaling. Mol. Cancer. 2017;16:9. doi: 10.1186/s12943-017-0583-1. [DOI] [PMC free article] [PubMed] [Google Scholar]
- 32.Hosseinahli N., Aghapour M., Duijf P.H.G., Baradaran B. Treating cancer with microRNA replacement therapy: a literature review. J. Cell. Physiol. 2018;233:5574–5588. doi: 10.1002/jcp.26514. [DOI] [PubMed] [Google Scholar]
- 33.van Zandwijk N., Pavlakis N., Kao S.C., Linton A., Boyer M.J., Clarke S., Huynh Y., Chrzanowska A., Fulham M.J., Bailey D.L., et al. Safety and activity of microRNA-loaded minicells in patients with recurrent malignant pleural mesothelioma: a first-in-man, phase 1, open-label, dose-escalation study. Lancet Oncol. 2017;18:1386–1396. doi: 10.1016/s1470-2045(17)30621-6. [DOI] [PubMed] [Google Scholar]
- 34.Iacomino G., Tecce M.F., Grimaldi C., Tosto M., Russo G.L. Transcriptional response of a human colon adenocarcinoma cell line to sodium butyrate. Biochem. Biophys. Res. Commun. 2001;285:1280–1289. doi: 10.1006/bbrc.2001.5323. [DOI] [PubMed] [Google Scholar]
- 35.Mariadason J.M., Corner G.A., Augenlicht L.H. Genetic reprogramming in pathways of colonic cell maturation induced by short chain fatty acids: comparison with trichostatin A, sulindac, and curcumin and implications for chemoprevention of colon cancer. Cancer Res. 2000;60:4561–4572. [PubMed] [Google Scholar]
- 36.Tailor D., Hahm E.-R., Kale R.K., Singh S.V., Singh R.P. Sodium butyrate induces DRP1-mediated mitochondrial fusion and apoptosis in human colorectal cancer cells. Mitochondrion. 2014;16:55–64. doi: 10.1016/j.mito.2013.10.004. [DOI] [PMC free article] [PubMed] [Google Scholar]
- 37.Saldanha S.N., Kala R., Tollefsbol T.O. Molecular mechanisms for inhibition of colon cancer cells by combined epigenetic-modulating epigallocatechin gallate and sodium butyrate. Exp. Cell Res. 2014;324:40–53. doi: 10.1016/j.yexcr.2014.01.024. [DOI] [PMC free article] [PubMed] [Google Scholar]
- 38.Siavoshian S., Segain J.P., Kornprobst M., Bonnet C., Cherbut C., Galmiche J.P., Blottiere H.M. Butyrate and trichostatin A effects on the proliferation/differentiation of human intestinal epithelial cells: induction of cyclin D3 and p21 expression. Gut. 2000;46:507–514. doi: 10.1136/gut.46.4.507. [DOI] [PMC free article] [PubMed] [Google Scholar]
- 39.Shen H., Weng X.-D., Liu X.-H., Yang D., Wang L., Guo J., Wang M., Wang X., Diao C.-H. miR-181a-5p is downregulated and inhibits proliferation and the cell cycle in prostate cancer. Int. J. Clin. Exp. Pathol. 2018;11:3969–3976. [PMC free article] [PubMed] [Google Scholar]
- 40.Yu J., Qi J., Sun X., Wang W., Wei G., Wu Y., Gao Q., Zheng J. MicroRNA181a promotes cell proliferation and inhibits apoptosis in gastric cancer by targeting RASSF1A. Oncol. Rep. 2018;40:1959–1970. doi: 10.3892/or.2018.6632. [DOI] [PMC free article] [PubMed] [Google Scholar]
- 41.Chimploy K., Díaz G.D., Li Q., Carter O., Dashwood W.-M., Mathews C.K., Williams D.E., Bailey G.S., Dashwood R.H. E2F4 and ribonucleotide reductase mediate S-phase arrest in colon cancer cells treated with chlorophyllin. Int. J. Cancer. 2009;125:2086–2094. doi: 10.1002/ijc.24559. [DOI] [PMC free article] [PubMed] [Google Scholar]
- 42.Kang K., Oh S.H., Yun J.H., Jho E.H., Kang J.H., Batsuren D., Tunsag J., Park K.H., Kim M., Nho C.W. A novel topoisomerase inhibitor, daurinol, suppresses growth of HCT116 cells with low hematological toxicity compared to etoposide. Neoplasia. 2011;13:1043–1057. doi: 10.1593/neo.11972. [DOI] [PMC free article] [PubMed] [Google Scholar]
- 43.Zhang X., Ma X., An H., Xu C., Cao W., Yuan W., Ma J. Upregulation of microRNA-125b by G-CSF promotes metastasis in colorectal cancer. Oncotarget. 2017;8:50642–50654. doi: 10.18632/oncotarget.16892. [DOI] [PMC free article] [PubMed] [Google Scholar]
- 44.Liu Y., Beyer A., Aebersold R. On the dependency of cellular protein levels on mRNA abundance. Cell. 2016;165:535–550. doi: 10.1016/j.cell.2016.03.014. [DOI] [PubMed] [Google Scholar]
- 45.Payne S.H. The utility of protein and mRNA correlation. Trends Biochem. Sci. 2015;40:1–3. doi: 10.1016/j.tibs.2014.10.010. [DOI] [PMC free article] [PubMed] [Google Scholar]
- 46.Vogel C., Marcotte E.M. Insights into the regulation of protein abundance from proteomic and transcriptomic analyses. Nat. Rev. Genet. 2012;13:227–232. doi: 10.1038/nrg3185. [DOI] [PMC free article] [PubMed] [Google Scholar]
- 47.Schwanhausser B., Busse D., Li N., Dittmar G., Schuchhardt J., Wolf J., Chen W., Selbach M. Global quantification of mammalian gene expression control. Nature. 2011;473:337–342. doi: 10.1038/nature10098. [DOI] [PubMed] [Google Scholar]
- 48.Vogel C., Abreu Rde S., Ko D., Le S.Y., Shapiro B.A., Burns S.C., Sandhu D., Boutz D.R., Marcotte E.M., Penalva L.O. Sequence signatures and mRNA concentration can explain two-thirds of protein abundance variation in a human cell line. Mol. Syst. Biol. 2010;6:400. doi: 10.1038/msb.2010.59. [DOI] [PMC free article] [PubMed] [Google Scholar]
- 49.Baek D., Villén J., Shin C., Camargo F.D., Gygi S.P., Bartel D.P. The impact of microRNAs on protein output. Nature. 2008;455:64–71. doi: 10.1038/nature07242. http://www.nature.com/nature/journal/v455/n7209/suppinfo/nature07242_S1.html [DOI] [PMC free article] [PubMed] [Google Scholar]
- 50.Wang G., Yang X., Li C., Cao X., Luo X., Hu J. PIK3R3 induces epithelial-to-mesenchymal transition and promotes metastasis in colorectal cancer. Mol. Cancer Therapeut. 2014;13:1837–1847. doi: 10.1158/1535-7163.MCT-14-0049. [DOI] [PubMed] [Google Scholar]
- 51.Wang Q., Li N., Wang X., Kim M.M., Evers B.M. Augmentation of sodium butyrate-induced apoptosis by phosphatidylinositol 3'-kinase inhibition in the KM20 human colon cancer cell line. Clin. Cancer Res. 2002;8:1940–1947. [PubMed] [Google Scholar]
- 52.Sun J., Zhang T., Cheng M., Hong L., Zhang C., Xie M., Sun P., Fan R., Wang Z., Wang L., Zhong J. TRIM29 facilitates the epithelial-to-mesenchymal transition and the progression of colorectal cancer via the activation of the Wnt/beta-catenin signaling pathway. J. Exp. Clin. Cancer Res. 2019;38:104. doi: 10.1186/s13046-019-1098-y. [DOI] [PMC free article] [PubMed] [Google Scholar] [Retracted]
- 53.Zhou X.-M., Sun R., Luo D.-H., Sun J., Zhang M.-Y., Wang M.-H., Yang Y., Wang H.-Y., Mai S.-J. Upregulated TRIM29 promotes proliferation and metastasis of nasopharyngeal carcinoma via PTEN/AKT/mTOR signal pathway. Oncotarget. 2016;7:13634–13650. doi: 10.18632/oncotarget.7215. [DOI] [PMC free article] [PubMed] [Google Scholar]
- 54.Dannenberg A.J., Altorki N.K., Boyle J.O., Dang C., Howe L.R., Weksler B.B., Subbaramaiah K. Cyclo-oxygenase 2: a pharmacological target for the prevention of cancer. Lancet Oncol. 2001;2:544–551. doi: 10.1016/s1470-2045(01)00488-0. [DOI] [PubMed] [Google Scholar]
- 55.Ferrandez A., Prescott S., Burt R.W. COX-2 and colorectal cancer. Curr. Pharm. Des. 2003;9:2229–2251. doi: 10.2174/1381612033454036. [DOI] [PubMed] [Google Scholar]
- 56.Balcerczak E., Pasz-Walczak G., Kumor P., Panczyk M., Kordek R., Wierzbicki R., Mirowski M. Cyclin D1 protein and CCND1 gene expression in colorectal cancer. Eur. J. Surg. Oncol. 2005;31:721–726. doi: 10.1016/j.ejso.2005.04.005. [DOI] [PubMed] [Google Scholar]
- 57.Rhodes D.R., Yu J., Shanker K., Deshpande N., Varambally R., Ghosh D., Barrette T., Pandey A., Chinnaiyan A.M. ONCOMINE: a cancer microarray database and integrated data-mining platform. Neoplasia. 2004;6:1–6. doi: 10.1016/s1476-5586(04)80047-2. [DOI] [PMC free article] [PubMed] [Google Scholar]
- 58.Hong Y., Ho K.S., Eu K.W., Cheah P.Y. A susceptibility gene set for early onset colorectal cancer that integrates diverse signaling pathways: implication for tumorigenesis. Clin. Cancer Res. 2007;13:1107–1114. doi: 10.1158/1078-0432.Ccr-06-1633. [DOI] [PubMed] [Google Scholar]
- 59.Hazawa M., Lin D.C., Kobayashi A., Jiang Y.Y., Xu L., Dewi F.R.P., Mohamed M.S., Hartono, Nakada M., Meguro-Horike M., Horike S.I., et al. ROCK-dependent phosphorylation of NUP62 regulates p63 nuclear transport and squamous cell carcinoma proliferation. EMBO Rep. 2018;19:73–88. doi: 10.15252/embr.201744523. [DOI] [PMC free article] [PubMed] [Google Scholar]
- 60.Bayraktar R., Pichler M., Kanlikilicer P., Ivan C., Bayraktar E., Kahraman N., Aslan B., Oguztuzun S., Ulasli M., Arslan A., et al. MicroRNA 603 acts as a tumor suppressor and inhibits triple-negative breast cancer tumorigenesis by targeting elongation factor 2 kinase. Oncotarget. 2017;8:11641–11658. doi: 10.18632/oncotarget.14264. [DOI] [PMC free article] [PubMed] [Google Scholar]
- 61.Fodde R. The APC gene in colorectal cancer. Eur. J. Cancer. 2002;38:867–871. doi: 10.1016/S0959-8049(02)00040-0. [DOI] [PubMed] [Google Scholar]
- 62.Lazarova D.L., Chiaro C., Bordonaro M. Butyrate induced changes in Wnt-signaling specific gene expression in colorectal cancer cells. BMC Res. Notes. 2014;7:226. doi: 10.1186/1756-0500-7-226. [DOI] [PMC free article] [PubMed] [Google Scholar]
- 63.Gao C., Chen Y.G. Dishevelled: the hub of Wnt signaling. Cell. Signal. 2010;22:717–727. doi: 10.1016/j.cellsig.2009.11.021. [DOI] [PubMed] [Google Scholar]
- 64.Xu W., Xu B., Yao Y., Yu X., Cao H., Zhang J., Liu J., Sheng H. RNA interference against TRIM29 inhibits migration and invasion of colorectal cancer cells. Oncol. Rep. 2016;36:1411–1418. doi: 10.3892/or.2016.4941. [DOI] [PubMed] [Google Scholar]
- 65.Yang X., Gu Q., Lin L., Li S., Zhong S., Li Q., Cui Z. Nucleoporin 62-like protein activates canonical Wnt signaling through facilitating the nuclear import of β-catenin in zebrafish. Mol. Cell. Biol. 2015;35:1110–1124. doi: 10.1128/MCB.01181-14. [DOI] [PMC free article] [PubMed] [Google Scholar]
- 66.Nunez F., Bravo S., Cruzat F., Montecino M., De Ferrari G.V. Wnt/beta-catenin signaling enhances cyclooxygenase-2 (COX2) transcriptional activity in gastric cancer cells. PLoS One. 2011;6:e18562. doi: 10.1371/journal.pone.0018562. [DOI] [PMC free article] [PubMed] [Google Scholar]
- 67.Tetsu O., McCormick F. Beta-catenin regulates expression of cyclin D1 in colon carcinoma cells. Nature. 1999;398:422–426. doi: 10.1038/18884. [DOI] [PubMed] [Google Scholar]
- 68.Song J., Wang Z., Ewing R.M. Integrated analysis of the Wnt responsive proteome in human cells reveals diverse and cell-type specific networks. Mol. Biosyst. 2014;10:45–53. doi: 10.1039/c3mb70417c. [DOI] [PMC free article] [PubMed] [Google Scholar]
- 69.Hulin J.A., Nguyen T.D., Cui S., Marri S., Yu R.T., Downes M., Evans R.M., Makarenkova H., Meech R. Barx2 and Pax7 regulate Axin2 expression in myoblasts by interaction with β-catenin and chromatin remodelling. Stem Cell. 2016;34:2169–2182. doi: 10.1002/stem.2396. [DOI] [PMC free article] [PubMed] [Google Scholar]
- 70.Lazarova D.L., Bordonaro M., Carbone R., Sartorelli A.C. Linear relationship between Wnt activity levels and apoptosis in colorectal carcinoma cells exposed to butyrate. Int. J. Cancer. 2004;110:523–531. doi: 10.1002/ijc.20152. [DOI] [PubMed] [Google Scholar]
- 71.Zhou J.-Y., Chen M., Ma L., Wang X., Chen Y.-G., Liu S.-L. Role of CD44high/CD133high HCT-116 cells in the tumorigenesis of colon cancer. Oncotarget. 2016;7:7657. doi: 10.18632/oncotarget.7084. [DOI] [PMC free article] [PubMed] [Google Scholar]
- 72.Lv S.Y., Shan T.D., Pan X.T., Tian Z.B., Liu X.S., Liu F.G., Sun X.G., Xue H.G., Li X.H., Han Y., et al. The lncRNA ZEB1-AS1 sponges miR-181a-5p to promote colorectal cancer cell proliferation by regulating Wnt/beta-catenin signaling. Cell Cycle. 2018;17:1245–1254. doi: 10.1080/15384101.2018.1471317. [DOI] [PMC free article] [PubMed] [Google Scholar]
- 73.Ji D., Chen Z., Li M., Zhan T., Yao Y., Zhang Z., Xi J., Yan L., Gu J. MicroRNA-181a promotes tumor growth and liver metastasis in colorectal cancer by targeting the tumor suppressor WIF-1. Mol. Cancer. 2014;13:86. doi: 10.1186/1476-4598-13-86. [DOI] [PMC free article] [PubMed] [Google Scholar]
- 74.Birmingham A., Selfors L.M., Forster T., Wrobel D., Kennedy C.J., Shanks E., Santoyo-Lopez J., Dunican D.J., Long A., Kelleher D., et al. Statistical methods for analysis of high-throughput RNA interference screens. Nat. Methods. 2009;6:569–575. doi: 10.1038/nmeth.1351. [DOI] [PMC free article] [PubMed] [Google Scholar]
- 75.Malo N., Hanley J.A., Cerquozzi S., Pelletier J., Nadon R. Statistical practice in high-throughput screening data analysis. Nat. Biotechnol. 2006;24:167–175. doi: 10.1038/nbt1186. [DOI] [PubMed] [Google Scholar]
- 76.Cao S.S., Zhen Y.S. Potentiation of antimetabolite antitumor activity in vivo by dipyridamole and amphotericin B. Cancer Chemother. Pharmacol. 1989;24:181–186. doi: 10.1007/BF00300240. [DOI] [PubMed] [Google Scholar]
- 77.Dweep H., Sticht C., Pandey P., Gretz N. miRWalk--database: prediction of possible miRNA binding sites by "walking" the genes of three genomes. J. Biomed. Inf. 2011;44:839–847. doi: 10.1016/j.jbi.2011.05.002. [DOI] [PubMed] [Google Scholar]
- 78.Maragkakis M., Reczko M., Simossis V.A., Alexiou P., Papadopoulos G.L., Dalamagas T., Giannopoulos G., Goumas G., Koukis E., Kourtis K., et al. DIANA-microT web server: elucidating microRNA functions through target prediction. Nucleic Acids Res. 2009;37:W273–W276. doi: 10.1093/nar/gkp292. [DOI] [PMC free article] [PubMed] [Google Scholar]
- 79.Enright A., John B., Gaul U., Tuschl T., Sander C., Marks D. MicroRNA targets in Drosophila. Genome Biol. 2003;5:R1. doi: 10.1186/gb-2003-5-1-r1. [DOI] [PMC free article] [PubMed] [Google Scholar]
- 80.John B., Enright A.J., Aravin A., Tuschl T., Sander C., Marks D.S. Human MicroRNA targets. PLoS Biol. 2004;2:e363. doi: 10.1371/journal.pbio.0020363. [DOI] [PMC free article] [PubMed] [Google Scholar]
- 81.Wang X. miRDB: a microRNA target prediction and functional annotation database with a wiki interface. Rna. 2008;14:1012–1017. doi: 10.1261/rna.965408. [DOI] [PMC free article] [PubMed] [Google Scholar]
- 82.Krek A., Grun D., Poy M.N., Wolf R., Rosenberg L., Epstein E.J., MacMenamin P., da Piedade I., Gunsalus K.C., Stoffel M., Rajewsky N. Combinatorial microRNA target predictions. Nat. Genet. 2005;37:495–500. doi: 10.1038/ng1536. [DOI] [PubMed] [Google Scholar]
- 83.Kertesz M., Iovino N., Unnerstall U., Gaul U., Segal E. The role of site accessibility in microRNA target recognition. Nat. Genet. 2007;39:1278–1284. doi: 10.1038/ng2135. http://www.nature.com/ng/journal/v39/n10/suppinfo/ng2135_S1.html [DOI] [PubMed] [Google Scholar]
- 84.Miranda K.C., Huynh T., Tay Y., Ang Y.S., Tam W.L., Thomson A.M., Lim B., Rigoutsos I. A pattern-based method for the identification of MicroRNA binding sites and their corresponding heteroduplexes. Cell. 2006;126:1203–1217. doi: 10.1016/j.cell.2006.07.031. [DOI] [PubMed] [Google Scholar]
- 85.Lewis B.P., Burge C.B., Bartel D.P. Conserved seed pairing, often flanked by adenosines, indicates that thousands of human genes are microRNA targets. Cell. 2005;120:15–20. doi: 10.1016/j.cell.2004.12.035. [DOI] [PubMed] [Google Scholar]
- 86.Ge S.X., Jung D., Yao R. ShinyGO: a graphical gene-set enrichment tool for animals and plants. Bioinformatics. 2020;36:2628–2629. doi: 10.1093/bioinformatics/btz931. [DOI] [PMC free article] [PubMed] [Google Scholar]
- 87.Kanehisa M., Furumichi M., Tanabe M., Sato Y., Morishima K. KEGG: new perspectives on genomes, pathways, diseases and drugs. Nucleic Acids Res. 2017;45 doi: 10.1093/nar/gkw1092. D353-d361. [DOI] [PMC free article] [PubMed] [Google Scholar]
Associated Data
This section collects any data citations, data availability statements, or supplementary materials included in this article.
Supplementary Materials
Data Availability Statement
Raw data, relating to the hits described, are available upon request.