

Abstract
Ultrasound (US) imaging has been recognized and widely used as a screening and diagnostic imaging modality for cervical cancer all over the world. However, few studies have investigated the U-net-based automatic segmentation models for cervical cancer on US images and investigated the effects of automatic segmentations on radiomics features. A total of 1102 transvaginal US images from 796 cervical cancer patients were collected and randomly divided into training (800), validation (100) and test sets (202), respectively, in this study. Four U-net models (U-net, U-net with ResNet, context encoder network (CE-net), and Attention U-net) were adapted to segment the target of cervical cancer automatically on these US images. Radiomics features were extracted and evaluated from both manually and automatically segmented area. The mean Dice similarity coefficient (DSC) of U-net, Attention U-net, CE-net, and U-net with ResNet were 0.88, 0.89, 0.88, and 0.90, respectively. The average Pearson coefficients for the evaluation of the reliability of US image–based radiomics were 0.94, 0.96, 0.94, and 0.95 for U-net, U-net with ResNet, Attention U-net, and CE-net, respectively, in their comparison with manual segmentation. The reproducibility of the radiomics parameters evaluated by intraclass correlation coefficients (ICC) showed robustness of automatic segmentation with an average ICC coefficient of 0.99. In conclusion, high accuracy of U-net-based automatic segmentations was achieved in delineating the target area of cervical cancer US images. It is feasible and reliable for further radiomics studies with features extracted from automatic segmented target areas.
Supplementary Information
The online version contains supplementary material available at 10.1007/s10278-022-00620-z.
Keywords: Automatic segmentation, U-net, Radiomics, Ultrasound images
Introduction
Although the incidence of cervical cancer in the developed countries has decreased, it remains the fourth leading cause of cancer-related death in women worldwide [1]. Cervical cancer is still a great burden for the developing countries with 85% of new cases occurring in those countries, where screening is less prevalent or nonexistent [2]. Due to the advantages of cost-effectiveness, non-ionizing radiation, portability, and accessibility, ultrasound (US) imaging has been recognized and widely used as a screening and diagnostic imaging modality for cervical cancer all over the world [3, 4]. Recently, the emergence of radiomics further expands the application of US and improves the importance of US images for cervical cancer by decoding radiographic images into quantitative features and associating them with clinical characteristics [5].
However, despite its wide application, low imaging quality caused by speckle noise and artifacts and high inter- and intra-observer variabilities resulting from different levels of experience of radiologists render unique challenges for the accurate segmentation of target and different structures in US images [6]. Segmentation of target is a prerequisite and critical step for qualitative and quantitative analyses in clinical practice and radiomics studies [7]. Currently, no gold standard of segmentation has been established. Manual segmentation is a typical practice, which is not only tedious and time-consuming but also suffers from great individual variability [8, 9].Therefore, more advanced automatic segmentation methods are urgently needed to solve these problems for radiomics studies based on US images.
Over the past few years, both traditional machine learning techniques and more advanced deep learning algorithms had been applied in the US segmentation problems [10, 11]. As a well-known deep learning algorithm for biomedical imaging segmentation, U-net architecture has been successfully adapted to segment US images of breast [12], arterial walls [13], and gynecological images [14]. U-net is built upon fully convolutional network and has multiple variants according to different encoder-decoder architectures [11, 15]. Studies demonstrated that the reproducibility and reliability of radiomics features could be deeply affected by the segmentation methods for computed tomography (CT) [16], magnetic resonance (MR) [17], and positron emission tomography (PET) images [18]. However, few studies have investigated the U-net-based automatic segmentation models for cervical cancer on US images and investigated the reproducibility and stability of radiomics features. The purpose of this study is to investigate the accuracy of multiple U-net-based automatic segmentation models and their effects on the reproducibility and reliability of radiomics features on US images for patients with cervical cancer.
Materials and Methods
Patients and Images
Patients with cervical cancer treated in Wenzhou Medical University First Affiliated Hospital and underwent transvaginal US diagnosis from October 2010 to October 2017 were retrospectively reviewed in this study. Different US machines were applied in our hospital to acquire transvaginal US images, such as Voluson-E8 (GE Healthcare, Wilmington, USA) at 5–9 MHz, Philips (ATL HDI 5000, Netherland) at 4–8 MHz, Esaote (MyLab classC) at 3–9 MHz, or Hitachi (HI Vison Preirus) (Hitachi Ltd, Tokyo, Japan) at 4–8 MHz. Picture archiving and communication systems (PACS) was used to store the images in DICOM forms. The Ethics Committee in Clinical Research (ECCR) of Wenzhou Medical University First Affiliated Hospital approved this retrospective study (ECCR#2,019,059) in accordance with the Declaration of Helsinki, and waived the need for written informed consent with the confirmation of patient data confidentiality for its retrospective nature. The flowchart for the study is shown in Fig. 1.
Fig. 1.

Flowchart for the study with image preprocessing, segmentation, accuracy evaluation, and radiomics feature evaluation
Imaging Preprocessing and Segmentation
In order to meet the size requirement of automatic segmentation algorithm, image clipping was performed on each image set, and the center of clipping box was shifted randomly in all directions to make the training model robust [19]. The clipping box should be within the boundary of image and covers the tumor. A typical image preprocessing is shown in Fig. 2.
Fig. 2.
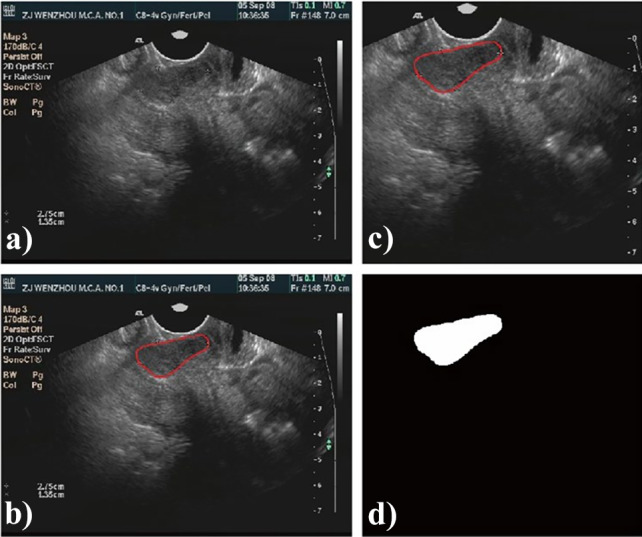
A typical preprocessing for automatic segmentation modeling with ultrasound images: a original ultrasound image; b manually contoured target area; c image after clipping; d the mask of cervical cancer target
Automatic segmentation was performed with the U-net scheme and its multiple variations. There were four U-net models adapted in this study, including classical U-net [11], U-net with ResNet [20], context encoder network (CE-net) [21], and Attention U-net [22]. Detailed modification performed and differences among these four U-net models are described in Appendix 1. Manual segmentations on US images were conducted and confirmed by two senior radiologists with several years of experience in gynecological imaging with pixel Annotation Tool (Amaury Br, Pixel Annotation Tool, https://github.com/abreheret/PixelAnnotationTool) based on ultrasonic echoes and the blood supply. Manual segmentations were regarded as the ground truth for automatic segmentation models’ training and verification.
In the training phase, Adam algorithm was used as the optimizer with its learning rate setting to 2e-4 because of its straightforward implementation and computationally efficiency. The input image was 4 batch size and the number of epoch was 120. The loss function is
| 1 |
where BCE is the binary cross entropy, DSC is the Dice similarity coefficient, and λ was set to 0.8 in this study.
Radiomics Feature Extraction
Before radiomics feature extraction, intensity normalization was performed in US images to transform arbitrary gray intensity values into a standardized intensity range. A python 3.7.0 and package Pyradiomics 2.2.0 were used to extract radiomics features from the manually and automatically segmented target volumes. Based on different matrices that capture the spatial intensity distributions at four different scales, 18 first-order histogram statistics and 79 texture features were derived from gray-level co-occurrence matrix (GLCM), gray-level dependence matrix (GLDM), gray-level run length matrix (GLRLM), and gray-level size zone matrix (GLSZM), and all those featured class definitions were described by Imaging Biomarker Standardization Initiative (IBSI) [38].
Evaluation and Statistical Analysis
The building of automatic segmentation models based on U-net were trained, validated, and tested with randomly divided training, validation, and test sets. The performance of these automatic segmentation models was evaluated by Dice similarity coefficient (DSC), Jaccard similarity coefficient (JSC), and average surface distance (ASD) when comparing them with manual segmentations with the test data sets.
The reliability of radiomics features from different automatic segmentation models was evaluated with Pearson coefficient by comparing them with manual segmentation. The reproducibility of radiomics features was evaluated by intraclass correlation coefficients (ICC) (two-way random effects, absolute agreement, single rater/measurement) [23] between two repeated automatic segmentations of the same dataset with different clipping boxes. Different clipping boxes (the center of tumor was randomly distributed in two different corners of the images) were used during preprocessing steps. The methods for Pearson coefficient and ICC calculation are described in Appendix 2. General statistical analyses were performed in SPSS Statistics (version 20.0.0). A p < 0.05 was considered as statically significant.
Results
Patients and Imaging Characteristics
A total of 796 patients with their cancer stages determined by the International Federation of Gynecology and Obstetrics (FIGO, 2009) classification system were enrolled in this study with a median age of 53 years old (range 23 to 79 years). And their histological types were classified according to WHO histological classification of tumors of the uterine cervix. A total of 1102 intravaginal US images were analyzed and randomly divided into three groups: training sets (800 images), validation sets (100 images), and test sets (202 images) for the building of automatic segmentation models. Table 1 presents the detail characteristics of the enrolled patients and images. There were no significant differences between the training, validation, testing sets in terms of age, histological types, and clinical stages.
Table 1.
Clinical characteristics of enrolled patients and images
| Category | Patients | Image Characteristics | ||||
|---|---|---|---|---|---|---|
| Training sets | Validation sets | Testing sets | p | |||
| Total number | 796 | 800 | 100 | 202 | ||
| Age (years) | 0.58 | |||||
| Mean | 53.5 | 54.0 | 53.1 | 53.3 | ||
| Median | 53 | 54 | 53 | 53 | ||
| Range | 23 ~ 79 | 23 ~ 79 | 23 ~ 79 | 27 ~ 78 | ||
| SD | 10.88 | 0.38 | 1.12 | 0.77 | ||
| Histological types | 0.32 | |||||
| Squamous cell carcinoma | 695 | 701 | 84 | 179 | ||
| Adenocarcinoma | 52 | 47 | 9 | 14 | ||
| Adenosquamous carcinoma | 28 | 30 | 5 | 4 | ||
| Others | 14 | 22 | 2 | 5 | ||
| Clinical stages | 0.30 | |||||
| I | 369 | 349 | 48 | 99 | ||
| II | 422 | 447 | 52 | 101 | ||
| Unknown | 5 | 4 | 0 | 2 | ||
The p value is calculated from the univariate association test between sub-groups; one-factor ANOVA for age, Pearson chi-square for clinical stages, Fisher’s exact test for histological type
Accuracy of Automatic Segmentation Models
Figure 3 presents typical target area contours achieved by U-net, Attention U-net, CE-net, and U-net with ResNet automatic segmentation models and their comparison with manual contours on US images for cervical cancer, respectively. The training and validation loss, as well as the performance of different models for training and validation cohorts, are shown in Fig. 4.
Fig. 3.

Typical target area delineated by U-net, Attention U-net, CE-net, and U-net with ResNet automatic segmentation models and their comparison with manual contours on ultrasound images for cervical cancer
Fig. 4.

a and b The performance of different U-net models in the training and validation cohorts; c paired T test results for the comparison of dice similarity coefficients among different U-net automatic segmentation models.
The differences among different U-net models according to DSC were also analyzed and presented in Fig. 4c by paired T test, in which the numbers were average DSC values resulting from row models minus the column ones with p value shown in different colors. The backbone of U-net is replaced by ResNet consisting U-net with ResNet. CE-net added context extractor block into U-net with ResNet. Attention U-net have Attention block. Compared with U-net, ResNet backbone had a significant improvement in DSC, while CE block and Attention block had no statistically significant improvement, as shown in Fig. 4c. Detailed evaluation of the segmentation performance for different automatic segmentation models is presented in Table 2. The mean DSC of U-net, Attention U-net, CE-net, and U-net with ResNet were 0.88, 0.89, 0.88, and 0.90, respectively.
Table 2.
Automatic segmentation accuracy metrics for U-net related models
| Evaluation metrics | ||||||
|---|---|---|---|---|---|---|
| Models | JSC (95%CI) | DSC (95%CI) | ASD (95%CI) | |||
| U-net | 0.80 | 0.78 ~ 0.81 | 0.88 | 0.87 ~ 0.89 | 5.85 | 5.20 ~ 6.49 |
| CE-net | 0.82 | 0.80 ~ 0.83 | 0.89 | 0.88 ~ 0.91 | 5.36 | 4.70 ~ 6.02 |
| Attention U-net | 0.80 | 0.79 ~ 0.82 | 0.88 | 0.87 ~ 0.90 | 5.71 | 5.05 ~ 6.37 |
| U-net with ResNet | 0.82 | 0.80 ~ 0.84 | 0.90 | 0.88 ~ 0.91 | 5.98 | 4.50 ~ 7.45 |
JSC, Jaccard similarity coefficient; DSC, Dice similarity coefficient; ASD, average surface distance
Effects on Radiomics Features
Most of the features demonstrated a high correlation among different U-net models, except for some shape features according to Pearson correlation, as shown in Fig. 5a. The average Pearson coefficients for the evaluation of the reliability of US image–based radiomics were 0.94 (95% confidential interval (CI), 0.93–0.96), 0.96 (95% CI, 0.96–0.97), 0.94 (95% CI, 0.93–0.95), and 0.95 (95% CI, 0.93–0.96) for U-net, U-net with ResNet, Attention U-net, and CE-net, respectively, in their comparison with manual segmentation. Further analysis on the shape features is shown in Fig. 6. Sphericity in U-net, Attention U-net, and CE-net models showed weak correlation between automatic and manual segmentations. Detailed results of Pearson correlation for all the 97 features are presented in supplementary Table S1.
Fig. 5.

Hotmaps of Pearson coefficients and intraclass correlation coefficients for the evaluation of reliability and reproducibility of radiomics features extracted from target volumes segmented by multiple U-net-based automatic segmentation models. Color showed the Pearson and ICC correlation values; the more red, the higher the correlation
Fig. 6.

The Pearson coefficients and intraclass correlation coefficients for the evaluation of reliability and reproducibility of shape features, respectively. Horizontal line and points on it represent 95% confidence intervals and correlation values, respectively
The reproducibility of the radiomics parameters evaluated by ICC showed the robustness of automatic segmentations except for some shape features, as shown in Fig. 5b. An average ICC coefficient of 0.99 was achieved for all the radiomics features extracted from automatic segmentations. Further analysis on the ICC of shape features demonstrated that ICC values of MaximumDiameter and MajorAxisLength in the U-net model, MajorAxisLength in the U-net with ResNet models, and MaximumDiameter and Sphericity in the Attention U-net models were less than 0.9, respectively, as shown in Fig. 6. Detailed results of ICC for all the 97 features are presented in supplementary Table S2.
Discussion
Multiple U-net-based models were adapted to segment automatically the target area of cervical cancer patients on US images. The accuracy of these automatic segmentation models and their effects on radiomics features were evaluated in this study. U-net with ResNet and CE-net models achieved a relatively higher accuracy on target delineations. Except for some shape features, most features extracted with automatic segmentation algorithms achieved high reliability and high reproducibility.
The increased application of US in diagnosis, image-guided interventions, and therapy, as well as the emerging radiomics analysis, has rendered one of the oldest imaging processing tasks, image segmentation, more interest and important [10]. With the recent development and wide application of deep learning, US images were also significantly investigated with deep learning–based automatic segmentation [24]. Yang et al. used a fine-grained recurrent neural network to automatically segment prostate US images and achieved a high DSC around 0.92 [25]. Ghavami et al. proposed convolutional neural networks (CNNs) to automatically segment transrectal US images of prostate and got a mean DSC of 0.91 ± 0.12 [26]. Hu et al. used dilated fully convolutional network (DFCN) with a phase-based active contour (PBAC) model and achieved a DSC of 88.97 ± 0.01%, a Hausdorff distance (HD) of 35.54 ± 29.70 pixels, and a mean absolute deviation (MAD) of 7.67 ± 6.67 for breast US images [27]. Similarly, a mean DSC of 0.88 to 0.90, a mean JSC of 0.80 to 0.82, and a mean ASD of 5.36 to 5.98 were achieved with multiple U-net-based automatic segmentation models on US images for cervical cancer in this study.
The well-known encoder-decoder U-net architecture had been intensively investigated for automatic segmentation and proposed for US images due to its advantages of several convolutional, max-pooling, and up-sampling layers [28]. Behboodi and Rivaz achieved a DSC of 0.85 ± 0.16 and 0.26 ± 0.1 for simulated data and real tissue-mimicking phantom data, respectively, with B-mode images using U-net [29]. Amiri et al. fine-tuned the U-Net on breast US images and got a mean DSC of 0.80 ± 0.03 [30]. By replacing some original blocks, many variations of U-net architecture have been developed and demonstrated excellent performance [31, 32]. Marques et al. explored the effects of different hyperparameters of U-net architecture for the automatic segmentation of ovary and ovarian follicles and demonstrated a DSC around 0.7 to 0.75 for B model images [14]. To the best of our knowledge, this is the first study using U-net and its three variants: CE-net, Attention U-net, and U-net with ResNet for the automatic segmentation of cervical cancer on US images. U-net with ResNet achieved a highest DSC of 0.90, a JSC of 0.82, and an ASD of 5.98, respectively.
US-derived quantitative features have been proved to be strongly correlated with breast biologic characteristics [33], gestational age [34], and neonatal respiratory morbidity [35]. Radiomics features extracted from US images had also been demonstrated to be valuable in the prediction of lymph node status for patients with early-stage cervical cancer [5]. However, the reproducibility and reliability of radiomics features were highly impacted by the segmentation methods [16–18]. An average Pearson coefficient from 0.94 to 0.96 and an average ICC from 0.94 to 1.00 were achieved in this study in the evaluation of the reliability and reproducibility of the US radiomics features extracted from target volumes generated by automatic segmentations. Similarly, Tobias et al. achieved an ICC of 0.99 with a semiautomatic segmentation on dynamic contrast material-enhanced MR images [17]. Lin et al. achieved an ICC of 0.70–0.99 on first-order apparent diffusion coefficient MR using U-net automatic segmentation for cervical cancer [36]. Because of the translation invariant nature of convolution, the U-net and its variants have a natural advantage that translation will not affect segmentation, which results in a high ICC in this study [37]. The results of this study also indicated that the performance of radiomics reliability of automatic segmentation is consistent with its own segmentation performance result. With a higher DSC, it resulted in a higher radiomics reliability.
One limitation of the U-net-based models for US automatic segmentation is that there may be some artifacts resulting from less optimal algorithms as shown in Fig. 3, which will further result in the worse reliability and reproducibility of some shape features, as shown in Fig. 6. The network models used in this paper were probably not good at delineating the cervical tumor boundary, which results in the low reliability and high reproducibility of shape features. Manual corrections may be warranted during clinical practice with these U-net-based automatic segmentations. Another limitation of this study is the only B-model images were investigated. Further studies on radiofrequency and envelope-detected signals of US may be helpful to further verify the accuracy of these automatic segmentations.
Conclusions
High accuracy of U-net-based automatic segmentations was achieved in delineating the target area of cervical cancer US images. It is feasible and reliable for further radiomics studies with features extracted from automatic segmented target areas.
Electronic Supplementary Material
Below is the link to the electronic supplementary material.
Appendix 1. Multiple U-net Models
Generally, the U-net is a symmetrical U-shaped model consisting of an encoder-decoder architecture. The left-side encoder is a down-sampling used to get feature map, similar to a compression operation, while the right-side decoder is an up-sampling used to restore the encoded features to the original image size and to output the results. Skip-connection was added to encoder-decoder networks in order to concatenate the features of high- and low-level together.
Attention U-net has added attention gate compared with U-net.Attention gates (AGs) filter the features propagated through the skip connections. Feature selectivity in AGs is achieved by use of contextual information (gating) extracted in coarser scales, as shown in Figs. 7 and 8.
Fig. 7.

The architecture of U-net and Attention U-net; Attention U-net has added attention gate compared with U-net
Fig. 8.

U-net with ResNet: the backbone of U-net is replaced by ResNet; CE-net added context extractor consisted of DAC and RMP block into U-net with ResNet
U-net with ResNet is a net when ResNet is used as a fixed feature backbone encoder to deepen the layers of the network (U-net with ResNet) and solve the vanishing gradient. ResNet34 was preferred in this study. Context encoder network (CE-Net) adds the context extractor consisted of dense atrous convolution (DAC) block and residual multi-kernel pooling (RMP) block into U-net with ResNet, as shown in Fig. 8.
Appendix 2. Definition of Pearson Coefficient and Intraclass Correlation Coefficient
Radiomics feature is N*Nf matrix, where Nf is the number of features, equals to 97, N is the number of test images.
The definition of Pearson coefficient is
where Xi is the column of radiomics features matrix, represents one of the automatically segmented radiomics features. Yi represents one of the ground truth radiomics features.
The definition of intraclass correlation coefficients (ICC) is
The input matrix of ICC, is N*2 matrix. There are 2 different segmentations from different clipping boxes accordingly to the same test images. N equals to the number of test images, the certain radiomics features such as firstorder_energy in 97 features extracted from those 2 different segmentations. For given input matrix, mean square for rows; mean square for error; mean square for columns; k = number of raters/measurements; here, k equals to 2.
Funding
This work was supported in part by Wenzhou Municipal Science and Technology Bureau (Y20190183), Zhejiang Engineering Research Center of Intelligent Medicine (2016E10011), and National Natural Science Foundation of China (No.11675122).
Availability of Data and Material
Tables 1 and 2; Supplementary Tables S1 and S2; Figs. 1, 2, 3, 4, 5, and 6.
Declarations
Ethics Approval
The Ethics Committee in Clinical Research (ECCR) of Wenzhou Medical University First Affiliated Hospital approved this study (ECCR#2019059).
Consent to Participate
Due to the retrospective nature of the study, informed consent was waived.
Consent for Publication
Not applicable.
Competing Interests
The authors declare no competing interests.
Footnotes
Publisher's Note
Springer Nature remains neutral with regard to jurisdictional claims in published maps and institutional affiliations.
Contributor Information
Congying Xie, Email: wzxiecongying@163.com.
Xiance Jin, Email: jinxc1979@hotmail.com.
References
- 1.Ferlay J, Soerjomataram I, Dikshit R, Eser S, Mathers C, Rebelo M, Parkin DM, Forman D, Bray F. Cancer incidence and mortality worldwide: sources, methods and major patterns in GLOBOCAN 2012. Int J Cancer. 2015;136:E359–E386. doi: 10.1002/ijc.29210. [DOI] [PubMed] [Google Scholar]
- 2.Kamangar F, Dores GM, Anderson WF. Patterns of cancer incidence, mortality, and prevalence across five continents: defining priorities to reduce cancer disparities in different geographic regions of the world. J Clin Oncol. 2006;24:2137–2150. doi: 10.1200/JCO.2005.05.2308. [DOI] [PubMed] [Google Scholar]
- 3.Saleh M, Virarkar M, Javadi S, Elsherif SB, de Castro Faria S, Bhosale P. Cervical Cancer: 2018 Revised International Federation of Gynecology and Obstetrics Staging System and the Role of Imaging. AJR Am J Roentgenol. 2020;214(5):1182–1195. doi: 10.2214/AJR.19.21819. [DOI] [PubMed] [Google Scholar]
- 4.Alcázar JL, Arribas S, Mínguez JA, Jurado M. The role of ultrasound in the assessment of uterine cervical cancer. J Obstet Gynaecol India. 2014;64:311–316. doi: 10.1007/s13224-014-0622-4. [DOI] [PMC free article] [PubMed] [Google Scholar]
- 5.Jin X, Ai Y, Zhang J, Zhu H, Jin J, Teng Y, Chen B, Xie C. Noninvasive prediction of lymph node status for patients with early-stage cervical cancer based on radiomics features from ultrasound images. Eur Radiol. 2020;30:4117–4124. doi: 10.1007/s00330-020-06692-1. [DOI] [PubMed] [Google Scholar]
- 6.Noble JA, Boukerroui D. Ultrasound image segmentation: a survey. IEEE Trans Med Imaging. 2006;25:987–1010. doi: 10.1109/TMI.2006.877092. [DOI] [PubMed] [Google Scholar]
- 7.Gillies RJ, Kinahan PE. Hricak H:Radiomics: Images Are More than Pictures. They Are Data. Radiology. 2016;278:563–577. doi: 10.1148/radiol.2015151169. [DOI] [PMC free article] [PubMed] [Google Scholar]
- 8.Hong TS, Tomé WA, Harari PM. Heterogeneity in head and neck IMRT target design and clinical practice. Radiother Oncol. 2012;103:92–98. doi: 10.1016/j.radonc.2012.02.010. [DOI] [PMC free article] [PubMed] [Google Scholar]
- 9.Li XA, Tai A, Arthur DW, Buchholz TA, Macdonald S, Marks LB, Moran JM, Pierce LJ, Rabinovitch R, Taghian A, Vicini F, Woodward W, White JR: Radiation Therapy Oncology Group Multi-Institutional and Multiobserver Study. Variability of target and normal structure delineation for breast cancer radiotherapy: an RTOG Multi-Institutional and Multiobserver Study. Int J Radiat Oncol Biol Phys 73:944–51,2009. [DOI] [PMC free article] [PubMed]
- 10.Jin J, Zhu H, Zhang J, Ai Y, Zhang J, Teng Y, Xie C, Jin X: Multiple U-Net-Based Automatic Segmentations and Radiomics Feature Stability on Ultrasound Images for Patients With Ovarian Cancer. Front Oncol 10:614201,2021. [DOI] [PMC free article] [PubMed]
- 11.Ronneberger O, Fischer P, Brox T:U-net: Convolutional networks for biomedical image segmentation. MICCAI. 10.1007/978-3-319-24574-4_28,2015
- 12.Yap MH, Goyal M, Osman FM, Martí R, Denton E, Juette A, Zwiggelaar R: Breast ultrasound lesions recognition: end-to-end deep learning approaches. J Med Imaging 6:011007,2019. [DOI] [PMC free article] [PubMed]
- 13.Yang J, Faraji M, Basu A: Robust segmentation of arterial walls in intravascular ultrasound images using Dual Path U-Net. Ultrasonics 96:24–33, 2019. [DOI] [PubMed]
- 14.Marques S, Carvalho C, Peixoto C, Pignatelli D, Beires J, Silva J, et al. Segmentation of gynaecological ultrasound images using different U-Net based approaches. IEEE Int. Ultrason. Symp. IUS. 2019 doi: 10.1109/ULTSYM.2019.8925948. [DOI] [Google Scholar]
- 15.Shelhamer E, Long J, Darrell T: Fully Convolutional Networks for Semantic Segmentation. IEEE Trans Pattern Anal Mach Intell Apr;39:640–651,2017. [DOI] [PubMed]
- 16.Armato SG, 3rd, McLennan G, Bidaut L, McNitt-Gray MF, Meyer CR, Reeves AP, Zhao B, Aberle DR, Henschke CI, Hoffman EA, Kazerooni EA, MacMahon H, Van Beeke EJ, Yankelevitz D, Biancardi AM, Bland PH, Brown MS, Engelmann RM, Laderach GE, Max D, Pais RC, Qing DP, Roberts RY, Smith AR, Starkey A, Batrah P, Caligiuri P, Farooqi A, Gladish GW, Jude CM, Munden RF, Petkovska I, Quint LE, Schwartz LH, Sundaram B, Dodd LE, Fenimore C, Gur D, Petrick N, Freymann J, Kirby J, Hughes B, Casteele AV, Gupte S, Sallamm M, Heath MD, Kuhn MH, Dharaiya E, Burns R, Fryd DS, Salganicoff M, Anand V, Shreter U, Vastagh S, Croft BY. The Lung Image Database Consortium (LIDC) and Image Database Resource Initiative (IDRI): a completed reference database of lung nodules on CT scans. Med Phys. 2011;38:915–931. doi: 10.1118/1.3528204. [DOI] [PMC free article] [PubMed] [Google Scholar]
- 17.Heye T, Merkle EM, Reiner CS, Davenport MS, Horvath JJ, Feuerlein S, Breault SR, Gall P, Bashir MR, Dale BM, Kiraly AP, Boll DT: Reproducibility of dynamic contrast-enhanced MR imaging. Part II. Comparison of intra- and interobserver variability with manual region of interest placement versus semiautomatic lesion segmentation and histogram analysis. Radiology 266:812–21,2013. [DOI] [PubMed]
- 18.Hatt M, Lee JA, Schmidtlein CR, Naqa IE, Caldwell C, De Bernardi E, Lu W, Das S, Geets X, Gregoire V, Jeraj R, MacManus MP, Mawlawi OR, Nestle U, Pugachev AB, Schöder H, Shepherd T, Spezi E, Visvikis D, Zaidi H, Kirov AS: Classification and evaluation strategies of auto-segmentation approaches for PET: Report of AAPM task group No. 211. Med Phys 44:e1-e42.,2017. [DOI] [PMC free article] [PubMed]
- 19.Aithal PS. Two Dimensional Clipping Based Segmentation Algorithm for Grayscale Fingerprint Images. International Journal of Applied Engineering and Management Letters (IJAEML) 2017;1:51–65. [Google Scholar]
- 20.He K, Zhang X, Ren S, Sun J: Deep residual learning for image recognition. Proc. IEEE Comput. Soc. Conf. Comput. Vis. Pattern Recognit 10.1109/CVPR.2016.90,2016
- 21.Gu Z, Cheng J, Fu H, Zhou K, Hao H, Zhao Y, Zhang T, Gao S. Liu J:CE-Net: Context Encoder Network for 2D Medical Image Segmentation. IEEE Trans Med Imaging. 2019;38:2281–2292. doi: 10.1109/TMI.2019.2903562. [DOI] [PubMed] [Google Scholar]
- 22.Oktay O, Schlemper J, Le Folgoc L, Lee M, Heinrich M, Misawa K, et al.: Attention U-Net: Learning where to look for the pancreas. ArXiv,2018.
- 23.Koo TK, Li MY. A Guideline of Selecting and Reporting Intraclass Correlation Coefficients for Reliability Research. J Chiropr Med. 2016;15:155–163. doi: 10.1016/j.jcm.2016.02.012. [DOI] [PMC free article] [PubMed] [Google Scholar]
- 24.Yang X, Yu L, Li S, Wen H, Luo D, Bian C, Qin J, Ni D, Heng PA. Towards Automated Semantic Segmentation in Prenatal Volumetric Ultrasound. IEEE Trans Med Imaging. 2019;38:180–193. doi: 10.1109/TMI.2018.2858779. [DOI] [PubMed] [Google Scholar]
- 25.Yang X, Yu L, Wu L, Wang Y, Ni D, Qin J, et al.: Fine-grained recurrent neural networks for automatic prostate segmentation in ultrasound images. 31st AAAI Conf. Artif. Intell. AAAI 31 2017.
- 26.Ghavami N, Hu Y, Bonmati E, Rodell R, Gibson E, Moore C, Barratt D: Integration of spatial information in convolutional neural networks for automatic segmentation of intraoperative transrectal ultrasound images. J Med Imaging (Bellingham) 6:011003,2019. [DOI] [PMC free article] [PubMed]
- 27.Hu Y, Guo Y, Wang Y, Yu J, Li J, Zhou S, Chang C. Automatic tumor segmentation in breast ultrasound images using a dilated fully convolutional network combined with an active contour model. Med Phys. 2019;46:215–228. doi: 10.1002/mp.13268. [DOI] [PubMed] [Google Scholar]
- 28.Nair A A, Tran T D, Reiter A: A deep learning based alternative to beamforming ultrasound images. 2018 IEEE International conference on acoustics, speech and signal processing (ICASSP) IEEE 3359–3363,2018.
- 29.Behboodi B, Rivaz H. Ultrasound segmentation using U-Net: learning from simulated data and testing on real data. Annu Int Conf IEEE Eng Med Biol Soc. 2019;6628–6631:2019. doi: 10.1109/EMBC.2019.8857218. [DOI] [PubMed] [Google Scholar]
- 30.Amiri M, Brooks R, Rivaz H. Fine-Tuning U-Net for Ultrasound Image Segmentation: Different Layers, Different Outcomes. IEEE Trans Ultrason Ferroelectr Freq Control. 2020;67:2510–2518. doi: 10.1109/TUFFC.2020.3015081. [DOI] [PubMed] [Google Scholar]
- 31.Gordienko Y, Gang P, Hui J: Deep learning with lung segmentation and bone shadow exclusion techniques for chest X-ray analysis of lung cancer. International Conference on Computer Science, Engineering and Education Applications. Springer, Cham, 2018:638–647.
- 32.Zeng G, Yang X, Li J: 3D U-net with multi-level deep supervision: fully automatic segmentation of proximal femur in 3D MR images. International workshop on machine learning in medical imaging. Springer, Cham, 2017:274–282,2017.
- 33.Guo Y, Hu Y, Qiao M, Wang Y, Yu J, Li J, Chang C. Radiomics Analysis on Ultrasound for Prediction of Biologic Behavior in Breast Invasive Ductal Carcinoma. Clin Breast Cancer. 2018;18:e335–e344. doi: 10.1016/j.clbc.2017.08.002. [DOI] [PubMed] [Google Scholar]
- 34.Cobo T, Bonet-Carne E, Martínez-Terrón M, Perez-Moreno A, Elías N, Luque J, Amat-Roldan I, Palacio M. Feasibility and reproducibility of fetal lung texture analysis by Automatic Quantitative Ultrasound Analysis and correlation with gestational age. Fetal Diagn Ther. 2012;31:230–236. doi: 10.1159/000335349. [DOI] [PubMed] [Google Scholar]
- 35.Bonet-Carne E, Palacio M, Cobo T, Perez-Moreno A, Lopez M, Piraquive JP, Ramirez JC, Botet F, Marques F, Gratacos E. Quantitative ultrasound texture analysis of fetal lungs to predict neonatal respiratory morbidity. Ultrasound Obstet Gynecol. 2015;45:427–433. doi: 10.1002/uog.13441. [DOI] [PubMed] [Google Scholar]
- 36.Lin YC, Lin CH, Lu HY, Chiang HJ, Wang HK, Huang YT, Ng SH, Hong JH, Yen TC, Lai CH, Lin G. Deep learning for fully automated tumor segmentation and extraction of magnetic resonance radiomics features in cervical cancer. Eur Radiol. 2020;30:1297–1305. doi: 10.1007/s00330-019-06467-3. [DOI] [PubMed] [Google Scholar]
- 37.Li Y, Qi H, Dai J: Fully convolutional instance-aware semantic segmentation. Proceedings of the IEEE conference on computer vision and pattern recognition 2017: 2359–2367,2017.
- 38.Zwanenburg A, Vallières M, Abdalah MA, Aerts HJWL, Andrearczyk V, Apte A, Ashrafinia S, Bakas S, Beukinga RJ, Boellaard R, Bogowicz M, Boldrini L, Buvat I, Cook GJR, Davatzikos C, Depeursinge A, Desseroit MC, Dinapoli N, Dinh CV, Echegaray S, El Naqa I, Fedorov AY, Gatta R, Gillies RJ, Goh V, Götz M, Guckenberger M, Ha SM, Hatt M, Isensee F, Lambin P, Leger S, Leijenaar RTH, Lenkowicz J, Lippert F, Losnegård A, Maier-Hein KH, Morin O, Müller H, Napel S, Nioche C, Orlhac F, Pati S, Pfaehler EAG, Rahmim A, Rao AUK, Scherer J, Siddique MM, Sijtsema NM, Socarras Fernandez J, Spezi E, Steenbakkers RJHM, Tanadini-Lang S, Thorwarth D, Troost EGC, Upadhaya T, Valentini V, van Dijk LV, van Griethuysen J, van Velden FHP, Whybra P, Richter C, Löck S. The Image Biomarker Standardization Initiative: Standardized Quantitative Radiomics for High-Throughput Image-based Phenotyping. Radiology. 2020;295:328–338. doi: 10.1148/radiol.2020191145. [DOI] [PMC free article] [PubMed] [Google Scholar]
Associated Data
This section collects any data citations, data availability statements, or supplementary materials included in this article.
Supplementary Materials
Data Availability Statement
Tables 1 and 2; Supplementary Tables S1 and S2; Figs. 1, 2, 3, 4, 5, and 6.