Abstract
Parametric imaging obtained from kinetic modeling analysis of dynamic positron emission tomography (PET) data is a useful tool for quantifying tracer kinetics. However, pixel-wise time-activity curves have high noise levels which lead to poor quality of parametric images. To solve this limitation, we proposed a new image denoising method based on deep image prior (DIP). Like the original DIP method, the proposed DIP method is an unsupervised method, in which no training dataset is required. However, the difference is that our method can simultaneously denoise all dynamic PET images. Moreover, we propose a modified version of the DIP method called double DIP (DDIP), which has two DIP architectures. The additional DIP model is used to generate high-quality input data for the second DIP model. Computer simulations were performed to evaluate the performance of the proposed DIP-based methods. Our simulation results showed that the DDIP method outperformed the single DIP method. In addition, the DDIP method combined with data augmentation could generate PET parametric images with superior image quality compared to the spatiotemporal-based non-local means filtering and high constrained backprojection. Our preliminary results show that our proposed DDIP method is a novel and effective unsupervised method for simultaneously denoising dynamic PET images.
Keywords: Deep image prior, Dynamic PET, Parametric imaging
Introduction
Kinetic modeling has been used for quantitative analysis of time-varying imaging data such as dynamic positron emission tomography (PET) [1, 2], dynamic computed tomography [3, 4], and dynamic contrast-enhanced magnetic resonance imaging [5, 6]. In particular, the quantitative analysis of dynamic PET data can provide various types of physiological information such as glucose metabolism, tissue perfusion, and receptor density [1, 2]. Traditionally, a time-activity curve (TAC) measured from a region of interest (ROI) is used to estimate model parameters. Because the TAC is obtained by averaging over multiple pixels, the ROI-based parameter estimation method is less affected by noise. However, it cannot provide the spatial distribution of the tracer kinetics. To reveal the spatial distribution of tracer kinetics, a pixel-by-pixel parameter estimation can be used. When the parameter estimation is performed at the pixel level, the so-called parametric images are generated. However, due to the presence of high noise in the pixel-wise TAC, reliable estimation of parametric images from dynamic PET data is still a challenge.
To improve the quality of PET parametric images, different approaches such as image reconstruction [7–9], image denoising [10–13], and curve fitting [14–16] can be used. Moreover, one can directly reconstruct the kinetic parameters from the raw PET projection data [17–19]. The direct reconstruction of parametric images from dynamic PET projection data was shown to outperform the indirect method (i.e., post-reconstruction pixel-wise fitting of kinetic model to TACs) [17–19]. However, dynamic PET image reconstruction is a complex task that requires several quantitative corrections including normalization, attenuation, random, and scattering. In addition, the calculation of a robust and accurate system matrix is required. These make it difficult to implement the reconstruction-based methods. In contrast, image denoising applied to the reconstructed dynamic PET images can be easily implemented to reduce the noise of dynamic PET images, thus improving the quality of parametric images.
Over the last 20 years, several different image denoising methods, such as wavelet denoising [10], high constrained backprojection (HYPR) [11], non-local means filtering based on spatiotemporal block search (NLM-ST) [12], and image-guided filter [13], have been proposed to improve the quality of dynamic PET images. The improved image quality can thus produce PET parametric images with superior image quality. In addition to traditional denoising methods, many deep learning (DL)-based denoising methods have been developed in recent years [20]. Although DL-based methods can achieve promising denoising results, there are several challenges to be solved. For example, DL-based denoising methods often require large and clean training datasets which are difficult to obtain in clinical practice.
To overcome this problem, unsupervised learning can be used. For example, deep image prior (DIP) has been shown to be capable of solving standard inverse problems such as such as denoising, super-resolution, and inpainting [21]. Recently, the DIP method has been applied to denoise dynamic PET images [22]. However, due to the fact that the DIP method proposed by [22] can process a single time-frame PET image at a time, denoising all the dynamic PET images may be time-consuming. Moreover, based on the previous study [22], it is still unknown whether the DIP-based denoising method could improve the quality of PET parametric images. To address these limitations, we propose a new DIP-based method that has the ability to denoise all dynamic PET images simultaneously. Moreover, we propose a modified version of the DIP method to further improve the quality of dynamic PET images. The performance evaluation was conducted using simulated dynamic PET data, and the proposed DIP-based methods were compared to the HYPR [11] and NLM-ST [12] methods.
Methods and Materials
Image Denoising Method Based on DIP
The original DIP method [21, 22] is a type of unsupervised learning which can be used to perform image denoising without training data. In the original DIP method, an image (I) is represented as an input (x) in a convolutional neural network (f) with network weights (θ) as follows:
| 1 |
Given a noisy image (y), the denoised image () can be obtained by minimizing the following equation:
| 2 |
where is the L2 norm and is the network weights after training. Based on the observation that the network can fit natural images faster than noise [21], using early stopping can produce images with less noise. The input (x) can be a random image, but it was shown that the input (x) obtained by summing all dynamic PET images can be used to improve the performance of the DIP-based denoising method [22].
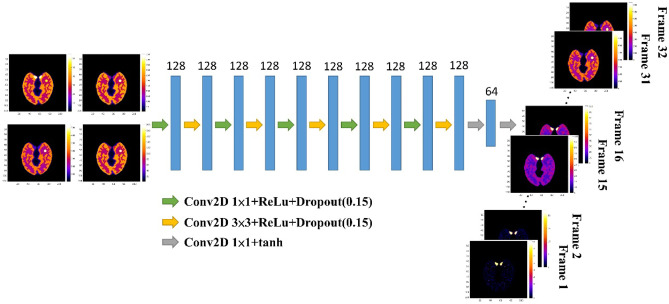
According to the previous studies [21, 22], the original DIP method can only process a single image at a time. It may be very time-consuming to denoise all dynamic (multi-frame) PET images. To address this limitation, we propose a new DIP-based method that has the ability to simultaneously denoise all noisy dynamic PET images, . T is the total number of time frames. As shown in Fig. 1, given different time-averaged PET images (xmean), all denoised dynamic PET images () can be obtained by minimizing the following equation:
| 3 |
Fig. 1.
The architecture of the SDIP method. The noisy dynamic PET images are used as training targets, and the four time-averaged PET images are used as the network input
For a 60-min dynamic PET scan, xmean used in this study was four time-averaged PET images averaged over 0–20 min, 20–40 min, 40–60 min, and 0–60 min (i.e., , , , and ). In Eq. (3), we used one single DIP (SDIP) model to simultaneously denoise all dynamic PET images. As also shown in Fig. 1, the SDIP model consisted of twelve two-dimensional (2D) convolutional layers with two different kernel sizes: 1 1 and 3 3. The 1 1 convolutional layer was used as a channel-wise pooling to capture temporal information presented in the input feature maps. In contrast, the 3 3 convolutional layer was used to extract spatial information. The number of filters for each convolutional layer was 128 except for the last two convolutional layers which had 64 and 32 filters. Note that the number of filters for the last convolutional layer is equal to the number of dynamic PET frames. Except for the last two convolutional layers that used a tanh activation function, each convolutional layer was followed by a rectified linear unit (ReLu) activation function and a drop layer before the next layer. However, due to the fact that the input images (i.e., xmean) still contain some noise, the proposed SDIP method may not produce optimal denoising results for dynamic PET images.
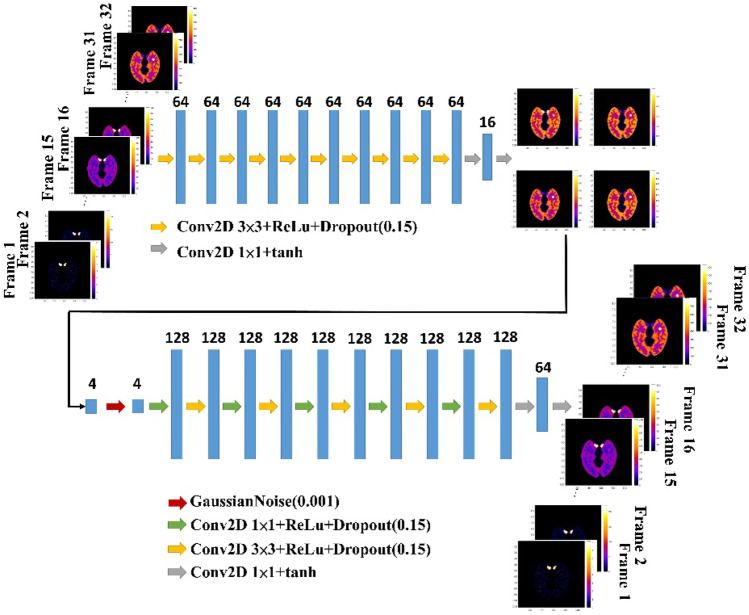
To further improve the denoising performance, we proposed a double DIP (DDIP) method which consisted of two DIP models (Fig. 2). In the first DIP model, given all noisy dynamic PET (), the time-averaged PET images () can be obtained by minimizing the following equation:
| 4 |
Fig. 2.
The architecture of the DDIP method. In the first DIP, the four time-averaged PET images are used as training targets, and the dynamic PET images are used as the input. The second DIP architecture is similar to the SDIP architecture
Next, we trained the other DIP model to obtain all denoised dynamic PET images (). The second DIP model is the same as the SDIP model (Fig. 1) except for the input ( instead of xmean). The first DIP model is designed to obtain high-quality time-averaged PET images which can be a good input for the second DIP model. As shown in Fig. 2, the first DIP model consisted of ten 2D convolutional layers with 3 × 3 kernel size and two 2D convolutional layers with 1 × 1 kernel size. The number of filters for each convolutional layer was 64 except for the last two convolutional layers which were 16 and 4 (= the number of mean images). Except for the last two convolutional layers that use a tanh activation function, each convolutional layer is followed by a ReLu activation function and a drop layer before the next layer. The second DIP model is the same as the SDIP model except that there is a Gaussian noise layer. The output of the first DIP model is fed into the Gaussian noise layer which acts as a regularizer and avoids overfitting [23].
In order to improve the consistency of the proposed DDIP method, we performed data augmentation (DA) [24] on the noisy dynamic PET images. The standard 90 degree rotation and left-to-right flip were used to increase the amount of data (8 times). The average of the eight model’s outputs was treated as the final prediction. The DDIP method that combined with DA was denoted as DDIP-DA. The adaptive moment estimation optimization algorithm [24] was used to minimize Eqs. (3) and (4). In the proposed DIP architectures, the initial learning rate was set to 10−3, the dropout rate was set to 0.15, and the number of epochs was 1000. The beta1 and beta2 were 0.9 and 0.999, respectively. For the SDIP and DDIP methods, the batch size was 1. In contrast, the batch size was set to 8 for the DDIP-DA method. The proposed DIP-based methods were run on a computer with Fedora 26 and NVIDIA Titan XP GPU, TensorFlow 1.4, and Keras 2.2.5. Each input (and output) image was normalized to the range [−1, 1] by dividing its maximum value, subtracting 0.5, and multiplying by 2.
Computer Simulations
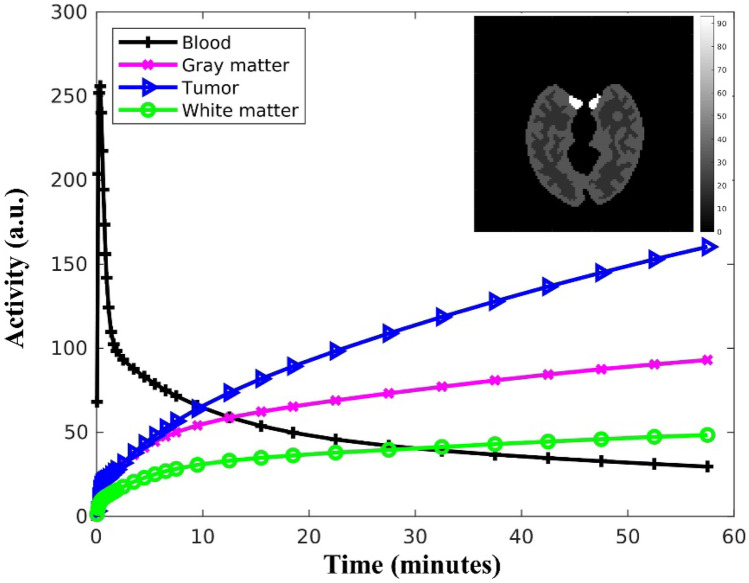
We used a brain phantom to simulate dynamic PET data (Fig. 3) based on a GE Discovery ST PET scanner. A standard two-compartment four-rate constant model was used to simulate the kinetics of 18F-FDG in the brain. Model parameters were set as follows: [K1 (min−1), k2 (min−1), k3 (min−1), k4 (min−1), Vb (unitless)], gray matter = [0.102, 0.130, 0.062, 0.007, 0.03], white matter = [0.054, 0.109, 0.045, 0.006, 0.02], and tumor = [0.089, 0.055, 0.096, 0.001, 0.05] [25]. The dynamic PET images consisted of 32 time frames over 60 min and followed the rules: 10 6 s, 4 15 s, 6 60 s, 4 180 s, and 8 300 s. To model the intrinsic resolution of a clinical PET scanner, each noise-free dynamic PET image was filtered by a 5-mm FWHM (full width at half maximum) Gaussian filter [26]. All smoothed dynamic PET images were then forward projected to generate noise-free emission sinograms. In this study, the system matrix was calculated based on square pixel basis and strip-integral detector model, and the system matrix generation was implemented using the Michigan Image Reconstruction Toolbox (http:// web.eecs.umich.edu/∼fessler/code). We also simulated physical processes such as radioactive decay, attenuation, random, and scatter. The distribution of random events was modeled by a uniform background. We applied a 20-cm FWHM Gaussian kernel to each dynamic PET image, and the distribution of scattered events was generated by forward projecting each blurred dynamic PET image [26]. The random and scatter fractions were 5% and 20%, respectively. Finally, we added Poisson noise to the attenuated emission sinograms which resulted in a total number of 20 million events. Each time-frame noisy emission sinogram was independently reconstructed using the kernelized expectation–maximization (KEM) algorithm [8] with 100 iterations, and the reconstruction parameters were the same as those used in [8]. A total of twenty noisy realizations were simulated.
Fig. 3.
Simulated brain image and TACs of input function, gray matter, white matter, and tumor
Data Analysis
Parametric images were generated by the nonlinear least-square fitting of pixel-wise TACs. The trust-region-reflective algorithm [27, 28] was used to solve the ordinary least squares objective function. The initial guesses were set as K1, k2, k3, k4, and Vb = [0.12 min−1, 0.15 min−1, 0.02 min−1, 0.005 min−1, and 0.01]. The lower and upper bounds were set as [0.01 K1 1.0 min−1], [0.01 k2 1.0 min−1], [0.0 k3 0.4 min−1], [0.0 k4 0.1 min−1], and [0 Vb 1]. The input function used for kinetic modeling analysis was estimated from the reconstructed dynamic PET images. The first ten denoised dynamic PET images (i.e., 0–1 min) were summed. Then, a threshold (i.e., 90% of the maximum intensity) was set to create a binary mask. Given each denoised dynamic PET image, the pixel intensities in this mask were averaged to obtain the blood TAC.
We compared the results of the proposed DIP-based methods with those of HYPR and NLM-ST. In the HYPR method, the composite image was the sum of all dynamic PET images, and a 9-mm-FWHM Gaussian filter was used. In the NLM-ST method, the temporal threshold was set to 20 min, and the smoothing parameter was set to 1.5. The local neighborhood was set to 3 3, and the search window was set to 11 11. The performance of all denoising methods was evaluated by bias and coefficient of variation (CV) of parameter estimates. We calculated the bias as follows:
| 5 |
where is the mean parameter value of the ith pixel calculated from all noise realizations (J = 20), is the estimated parameter value for the ith pixel of the jth noise realization, I is the total number of pixels in each tissue (i.e., gray matter, white matter, and tumor), and is the true parameter value of the ith pixel. The CV was calculated as follows:
| 6 |
The bias and CV were calculated for each tissue type, and the average of these three values was presented.
Results
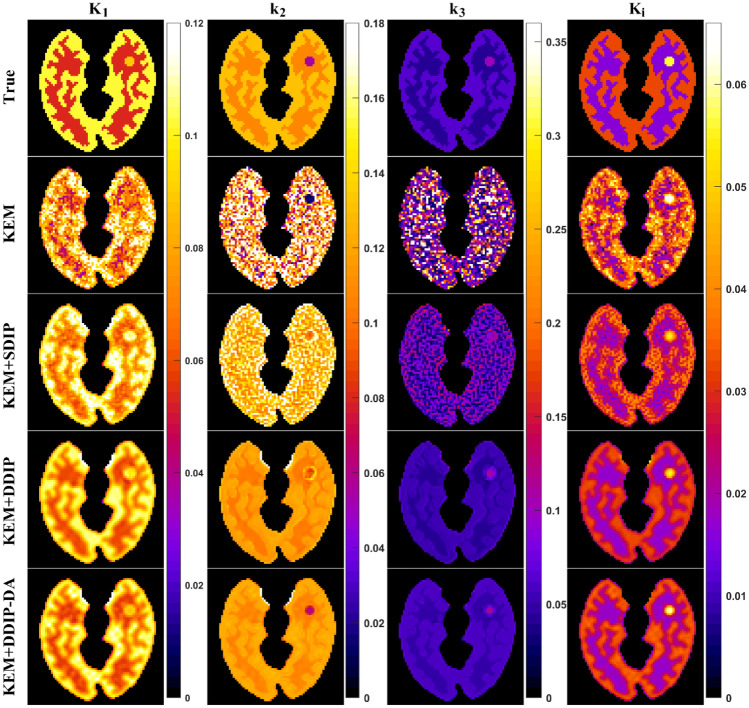
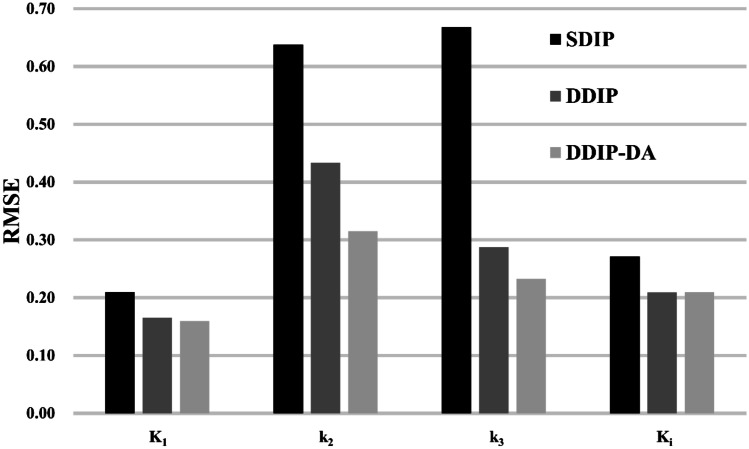
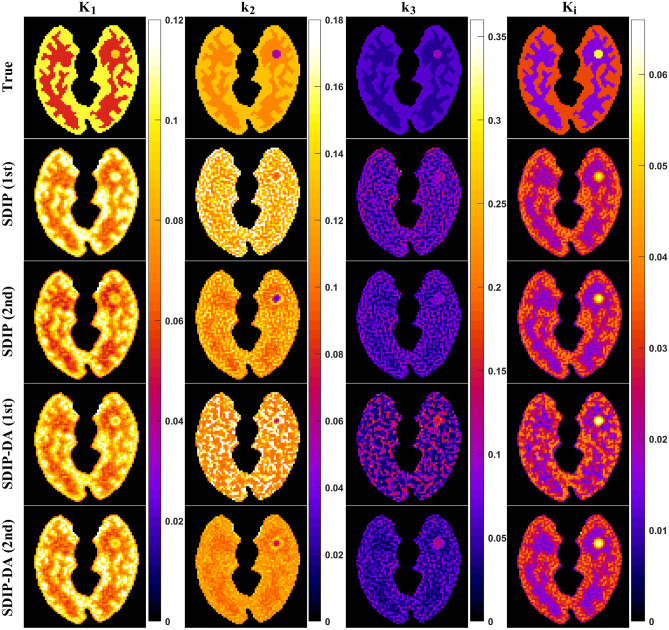
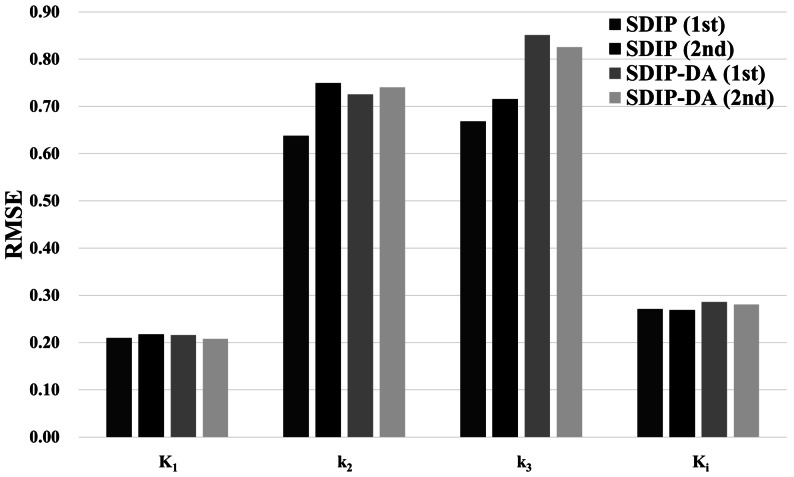
Figure 4 shows an example of the parametric images of K1, k2, k3, and Ki obtained from the ground truth, the KEM reconstructions, and the KEM reconstructions denoised by the proposed DIP-based methods. The quality of parametric images obtained from the proposed DIP-based methods was better than that obtained from the KEM reconstructions. Moreover, we observed that both the DDIP and DDIP-DA methods provided better tissue contrast than the SDIP method. Compared with the DDIP method, the DDIP-DA method produced less biased k2 and k3 estimates in the tumor region. Figure 5 shows the root-mean-square error (RMSE) of parameter estimates obtained by the proposed DIP-based methods. The RMSE values were separately calculated for gray matter, white matter, and tumor, and the averaged values were presented. Obviously, the DDIP-DA method outperformed both the SDIP and DDIP methods. As also shown in Figs. 9 and 10 in the Appendix, the SDIP combined with DA (SDIP-DA) did not improve the performance of parameter estimates. Similar results were observed even if we repeated the SDIP-based denoising process twice.
Fig. 4.
Parametric images of K1, k2, k3, and Ki obtained using KEM-reconstructed dynamic PET images with and without the proposed DIP-based denoising methods: SDIP, DDIP, and DDIP-DA
Fig. 5.
RMSE of K1, k2, k3, and Ki for SDIP, DDIP, and DDIP-DA
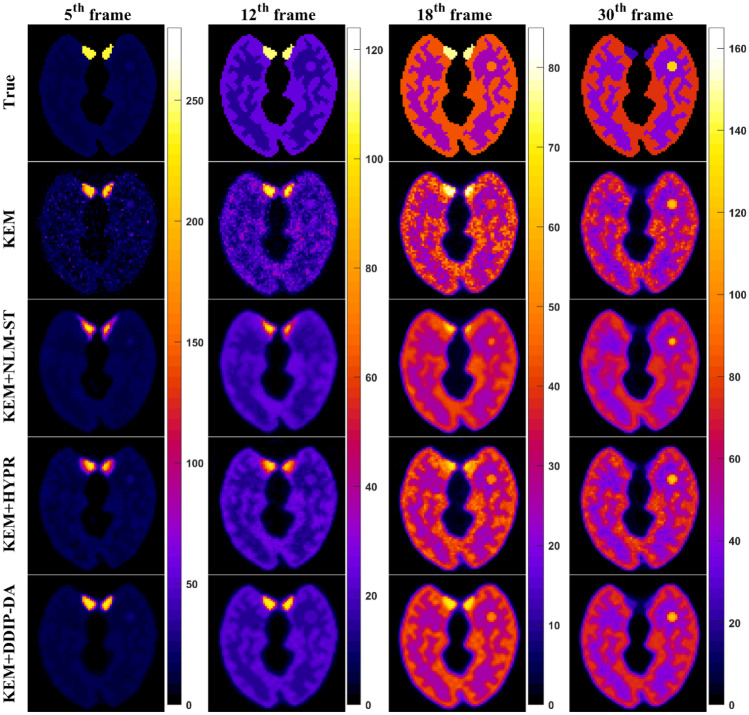
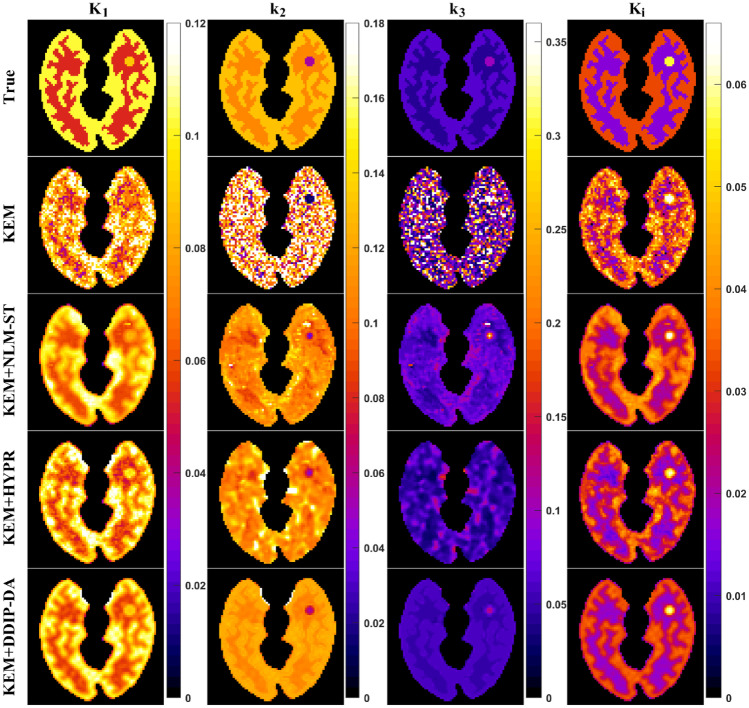
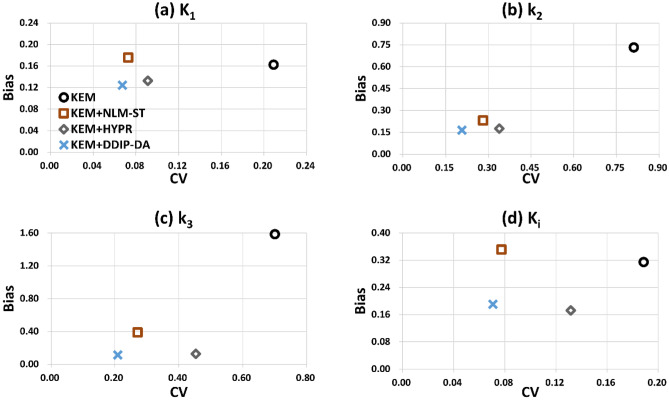
Next, we compared the performance of the proposed DDIP-DA method with that of other image denoising methods (i.e., HYPR and NLM-ST). As shown in Fig. 6, the NLM-ST method could reduce image noise at the cost of over-smoothing the dynamic PET images. The HYPR method prevented over-smoothing the dynamic PET images but provided limited noise reduction. Only the proposed DDIP-DA method could reduce image noise without over-smoothing edges and fine structures. Figure 7 shows the parametric images of K1, k2, k3, and Ki obtained from the ground truth and the KEM reconstruction denoised by different denoising methods. It can be seen that the k2 the k3 parametric images obtained from the NLM-ST and HYPR methods were over-smoothing. The DDIP-DA method could alleviate the over-smoothing problem and provide good tissue contrast. Figure 8 shows the plot of bias vs. CV with the four denoising methods. Overall, the proposed DDIP-DA could achieve a better balance between bias and CV than the other two denoising methods.
Fig. 6.
True, noisy, and denoised dynamic PET images for different time frames. From left to right columns: the 5th frame, 12th frame, 18th frame, and 30th frame. From top to bottom rows: ground truth, KEM, KEM + NLM-ST, KEM + HYPR, and KEM + DDIP-DA
Fig. 7.
Parametric images of K1, k2, k3, and Ki estimated using the three denoising methods (i.e., HYPR, NLM-ST, and DDIP-DA). The parametric images obtained from undenoised dynamic PET images (i.e., KEM) were also presented
Fig. 8.
Plots of bias vs. CV of K1, k2, k3, and Ki for the three denoising methods: HYPR, NLM-ST, and DDIP-DA. The results obtained from undenoised dynamic PET images (i.e., KEM) were also presented
Discussion
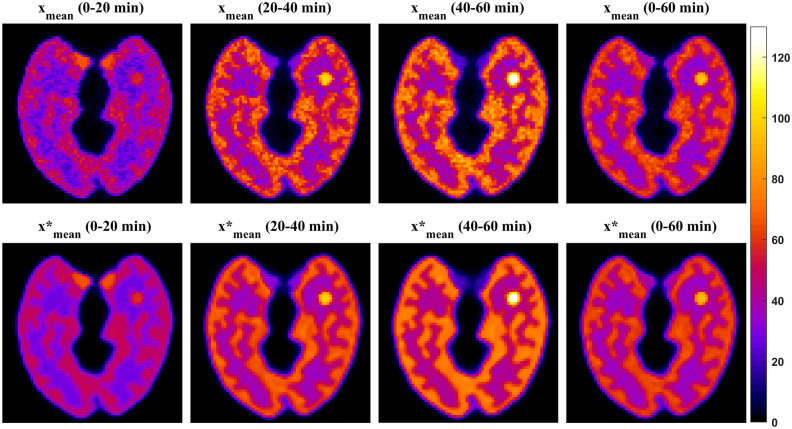
The original DIP method [21] has been applied to denoise dynamic PET images [22]. Like the original DIP method [21], the DIP-based method used for dynamic PET images [22] can process one image at a time. Because dynamic PET data are reconstructed into multiple time frames, denoising one image at a time may be time-consuming. In this study, we proposed a modified DIP method (SDIP) to denoise all dynamic PET images simultaneously. The simulation results showed the feasibility of using the proposed SDIP method to simultaneously denoise all dynamic PET images. However, the denoising performance of the proposed SDIP method was limited. One possible reason is that the input images (i.e., the time-averaged PET images) still contain some noise (Fig. 11 in the Appendix). To further improve the performance of the proposed SDIP method, we proposed a DDIP architecture which consisted of two DIP models. The first DIP model was designed to generate high-quality images which were used as the input of the second DIP model. We observed that the input data obtained from the first DIP model had improved image quality (Fig. 11 in the Appendix) which led to great improvements in the quality of dynamic PET images. We also found that the proposed DDIP method combining with DA (i.e., DDIP-DA) could further improve its denoising performance.
Overall, the proposed DDIP-DA method achieved a better balance between bias and CV than the other two image denoising methods (Fig. 8). Both the NLM-ST and HYPR methods yielded poor-quality parametric images. In particular, the k2 and k3 parametric images were over-smoothed. Although the over-smoothing problem can be alleviated by changing the value of the smoothing parameter used in the NLM-ST and HYPR methods, this would increase the bias of parameter estimates. Compared to the NLM-ST and HYPR methods, the proposed DDIP-DA method could improve the under- and over-estimation of the model parameters while maintaining good tissue contrast.
Although the proposed DDIP-DA method could improve the quality of PET parametric images, there were several limitations to our study. First, we evaluated the performance of the proposed DDIP-DA method using simulation data. The proposed DDIP-DA method should be further evaluated using real dynamic PET data. Second, the proposed DDIP-DA method had high computational time. To denoise 32-frame dynamic PET images, the NLM-ST and HYPR methods took 2 and 0.05 s, respectively. In contrast, the proposed DDIP-DA method took 180 s. However, the proposed DDIP-DA method required less computational time than the original DIP method [22] which took 1085 s. The original DIP method [22] was more time-consuming because it processed a single time-frame PET image at a time. Denoising all dynamic PET images sequentially (i.e., 32 frames) would be time-consuming. Third, the performance of the proposed DIP-based methods depends on the epoch selection. Using a low number of epochs can lead to under-fitting. In contrast, using a high number of epochs can result in over-fitting. The optimal number of epochs may be affected by several factors such as total counts and dynamic PET scan protocols. Some automatic stopping criteria [29, 30] will be investigated in our future work. Finally, we observed that the tumor region had higher bias (40% for k2 and 15% for k3) and CV (44% for k2 and 38% for k3) than gray matter and white matter (bias < 10% and CV < 13% for k2 and k3). One possible reason is that the simulated tumor lesion has a small size which is easily affected by surrounding tissues. Moreover, the tumor had high intensities which may need more epochs to recover. This indicates that the DIP-based methods have different learning rates in different regions.
Conclusions
In this study, we proposed an unsupervised image denoising method based on the concept of DIP. Different from the original DIP method, the proposed DIP-based methods can simultaneously denoise all frames of the dynamic PET data. Our simulation results showed that dynamic PET images denoised using the proposed DDIP-DA method could provide higher-quality parametric images and lower RMSE than both NLM-ST and HYPR methods. Our preliminary results indicate that the proposed DDIP-DA method is an effective method for simultaneously denoising dynamic PET images.
Appendix
Fig. 9 Parametric images of K1, k2, k3, and Ki obtained using KEM-reconstructed dynamic PET images with the proposed DIP-based denoising methods: SDIP and SDIP-DA. Both SDIP and SDIP-DA methods were repeated twice
Fig. 10 RMSE of K1, k2, k3, and Ki for SDIP and SDIP-DA. Both SDIP and SDIP-DA were repeated twice
Fig. 11 The four time-averaged PET images (xmean and ) obtained from noisy dynamic PET images (top) and the first DIP output of the DDIP model (bottom)
Author Contribution
Cheng-Hsun Yang is responsible for implementation and data analysis. Hsuan-Ming Huang is responsible for writing the manuscript.
Funding
This study has received funding by MOST 110–2221-E-002–029 from Ministry of Science and Technology, Taiwan.
Availability of Data and Material
If anyone asks for data, we will provide data via e-mail.
Code Availability
If anyone asks for source code, we will provide source code via e-mail.
Declarations
Ethics Approval
Not applicable. This is a simulation study.
Consent to Participate
Not applicable.
Consent for Publication
Authors are responsible for correctness of the statements provided in the manuscript. See also Authorship Principles. The Editor-in-Chief reserves the right to reject submissions that do not meet the guidelines described in this section.
Additional Declarations for Articles in Life Science Journals that Report the Results of Studies Involving Humans and/or Animals
Not applicable.
Conflict of Interest
The authors declare no competing interests.
Footnotes
Publisher's Note
Springer Nature remains neutral with regard to jurisdictional claims in published maps and institutional affiliations.
References
- 1.Carson RE. Tracer kinetic modeling in PET. Springer-Verlag: Positron Emiss. Tomogr; 2006. pp. 127–159. [Google Scholar]
- 2.Kotasidis FA, Tsoumpas C, Rahmim A. Advanced kinetic modelling strategies: Towards adoption in clinical PET imaging. Clin Transl Imaging. 2014;2:219–237. doi: 10.1007/s40336-014-0069-8. [DOI] [Google Scholar]
- 3.Ko BS, Cameron JD, DeFrance T, Seneviratne SK. CT stress myocardial perfusion imaging using Multidetector CT-A review. J Cardiovasc Comput Tomogr. 2011;5:345–356. doi: 10.1016/j.jcct.2011.10.005. [DOI] [PubMed] [Google Scholar]
- 4.Koh TS, Ng QS, Thng CH, Kwek JW, Kozarski R, Goh V. Primary colorectal cancer: Use of kinetic modeling of dynamic contrast-enhanced CT data to predict clinical outcome. Radiology. 2013;267:145–154. doi: 10.1148/radiol.12120186. [DOI] [PubMed] [Google Scholar]
- 5.Models and methods for analyzing DCE-MRI Khalifa F, Soliman A, El-Baz A, Abou El-Ghar M, El-Diasty T, Gimel’Farb G, et al. A review. Med Phys. 2014;41:124301. doi: 10.1118/1.4898202. [DOI] [PubMed] [Google Scholar]
- 6.Gaddikeri S, Gaddikeri RS, Tailor T, Anzai Y. Dynamic contrast-enhanced MR imaging in head and neck cancer: Techniques and clinical applications. Am J Neuroradiol. 2016;37:588–595. doi: 10.3174/ajnr.A4458. [DOI] [PMC free article] [PubMed] [Google Scholar]
- 7.Lu L, Karakatsanis NA, Tang J, Chen W, Rahmim A. 3.5D dynamic PET image reconstruction incorporating kinetics-based clusters. Phys Med Biol. 2012;57:5035–5055. doi: 10.1088/0031-9155/57/15/5035. [DOI] [PMC free article] [PubMed] [Google Scholar]
- 8.Wang G, Qi J. PET image reconstruction using Kernel method. IEEE Trans Med Imaging. 2015;34:61–71. doi: 10.1109/TMI.2014.2343916. [DOI] [PMC free article] [PubMed] [Google Scholar]
- 9.Cao S, He Y, Zhang H, Lv W, Lu L, Chen W. Dynamic PET image reconstruction incorporating multiscale superpixel clusters. IEEE Access. 2021;9:28965–28975. doi: 10.1109/ACCESS.2021.3058807. [DOI] [Google Scholar]
- 10.Shidahara M, Ikoma Y, Kershaw J, Kimura Y, Naganawa M, Watabe H. PET kinetic analysis: Wavelet denoising of dynamic PET data with application to parametric imaging. Ann Nucl Med. 2007;21:379–386. doi: 10.1007/s12149-007-0044-9. [DOI] [PubMed] [Google Scholar]
- 11.Christian BT, Vandehey NT, Floberg JM, Mistretta CA. Dynamic PET denoising with HYPR processing. J Nucl Med. 2010;51:1147–1154. doi: 10.2967/jnumed.109.073999. [DOI] [PMC free article] [PubMed] [Google Scholar]
- 12.Dutta J, Leahy RM, Li Q. Non-local means denoising of dynamic PET images. PLoS One. 2013;8:e81390. doi: 10.1371/journal.pone.0081390. [DOI] [PMC free article] [PubMed] [Google Scholar]
- 13.Lu L, Hu D, Ma X, Ma J, Rahmim A, Chen W: Dynamic PET denoising incorporating a composite image guided filter. 2014 IEEE Nucl. Sci. Symp. Med. Imaging Conf. NSS/MIC 2014, Institute of Electrical and Electronics Engineers Inc.; 2016
- 14.Guo H, Renaut RA, Chen K, Reiman E. FDG-PET parametric imaging by total variation minimization. Comput Med Imaging Graph. 2009;33:295–303. doi: 10.1016/j.compmedimag.2009.01.005. [DOI] [PMC free article] [PubMed] [Google Scholar]
- 15.Huang HM, Liu CC, Lin C. Indirect methods for improving parameter estimation of PET kinetic models. Med Phys. 2019;46:1777–1784. doi: 10.1002/mp.13448. [DOI] [PubMed] [Google Scholar]
- 16.Huang HM. Kernel-based curve-fitting method with spatial regularization for generation of parametric images in dynamic PET. Phys Med Biol. 2020;65:225006. doi: 10.1088/1361-6560/abb1d8. [DOI] [PubMed] [Google Scholar]
- 17.Kamasak ME, Bouman CA, Morris ED, Sauer K. Direct reconstruction of kinetic parameter images from dynamic PET data. IEEE Trans Med Imaging. 2005;24:636–650. doi: 10.1109/TMI.2005.845317. [DOI] [PubMed] [Google Scholar]
- 18.Germino M, Gallezot JD, Yan J, Carson RE. Direct reconstruction of parametric images for brain PET with event-by-event motion correction: Evaluation in two tracers across count levels. Phys Med Biol. 2017;62:5344–5364. doi: 10.1088/1361-6560/aa731f. [DOI] [PMC free article] [PubMed] [Google Scholar]
- 19.Gong K, Cheng-Liao J, Wang G, Chen KT, Catana C, Qi J. Direct Patlak reconstruction from dynamic PET data using the Kernel method with MRI information based on structural similarity. IEEE Trans Med Imaging. 2018;37:955–965. doi: 10.1109/TMI.2017.2776324. [DOI] [PMC free article] [PubMed] [Google Scholar]
- 20.Tian C, Fei L, Zheng W, Xu Y, Zuo W, Lin CW. Deep learning on image denoising: An overview. Neural Networks. 2020;131:251–275. doi: 10.1016/j.neunet.2020.07.025. [DOI] [PubMed] [Google Scholar]
- 21.Lempitsky V, Vedaldi A, Ulyanov D. Deep image prior. IEEE Computer Society: Proc. IEEE Comput. Soc. Conf. Comput. Vis. Pattern Recognit; 2018. pp. 9446–9454. [Google Scholar]
- 22.Hashimoto F, Ohba H, Ote K, Teramoto A, Tsukada H. Dynamic PET image denoising using deep convolutional neural networks without prior training datasets. IEEE Access. 2019;7:96594–96603. doi: 10.1109/ACCESS.2019.2929230. [DOI] [Google Scholar]
- 23.Camuto A, Willetts M, Şimşekli U, Roberts S, Holmes C: Explicit regularisation in Gaussian noise injections. ArXiv 2007.07368v6, 2020
- 24.Kingma DP, Ba JL: Adam: A method for stochastic optimization. 3rd Int. Conf. Learn. Represent. ICLR 2015 - Conf. Track Proc., International Conference on Learning Representations, ICLR; 1412.6980, 2015
- 25.Huang SC, Phelps ME, Hoffman EJ, Sideris K, Selin CJ, Kuhl DE. Noninvasive determination of local cerebral metabolic rate of glucose in man. Am J Physiol. 1980;238:69–82. doi: 10.1152/ajpendo.1980.238.1.E69. [DOI] [PubMed] [Google Scholar]
- 26.Häggström I, Beattie BJ, Schmidtlein CR. Dynamic PET simulator via tomographic emission projection for kinetic modeling and parametric image studies. Med Phys. 2016;43:3104–3116. doi: 10.1118/1.4950883. [DOI] [PMC free article] [PubMed] [Google Scholar]
- 27.Branch MA, Coleman TF, Li Y. A subspace, interior, and conjugate gradient method for large-scale bound-constrained minimization problems. SIAM J Sci Comput. 1999;21:1–23. doi: 10.1137/S1064827595289108. [DOI] [Google Scholar]
- 28.Byrd RH, Schnabel RB, Shultz GA. Approximate solution of the trust region problem by minimization over two-dimensional subspaces. Math Program. 1988;40:247–263. doi: 10.1007/BF01580735. [DOI] [Google Scholar]
- 29.Jin SC, Hsieh CJ, Chen JC, Tu SH, Chen YC, Hsiao TC, et al. Development of limited-angle iterative reconstruction algorithms with context encoder-based sinogram completion for micro-CT applications. Sensors. 2018;18:4458. doi: 10.3390/s18124458. [DOI] [PMC free article] [PubMed] [Google Scholar]
- 30.Zhou Q, Zhou C, Hu H, Chen Y, Chen S, Li X. Towards the automation of deep image prior. ArXiv. 1911;07185:2019. [Google Scholar]
Associated Data
This section collects any data citations, data availability statements, or supplementary materials included in this article.
Data Availability Statement
If anyone asks for data, we will provide data via e-mail.
If anyone asks for source code, we will provide source code via e-mail.


