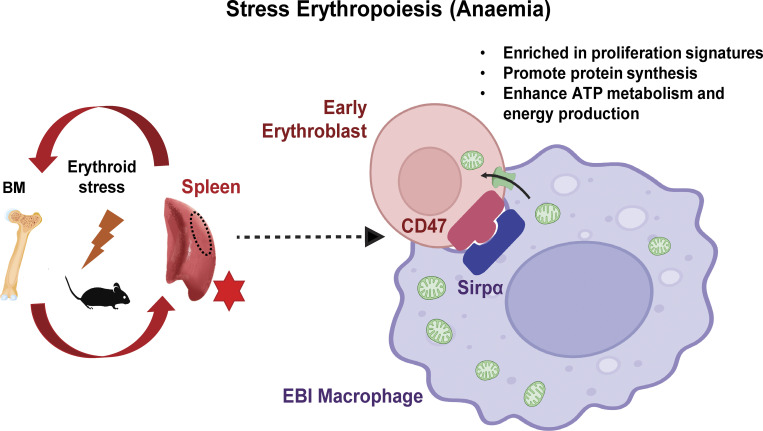
In our study, we demonstrated the functional importance of intercellular mitochondria transfer to mediate bioenergetic profiles of recipient erythroblasts to facilitate their recovery from anemic stress. We also identified a subset of metabolically active erythroid populations with higher abundance of mitochondria transfer marked by CD47.
Abstract
Intercellular mitochondria transfer is a biological phenomenon implicated in diverse biological processes. However, the physiological role of this phenomenon remains understudied between erythroblasts and their erythroblastic island (EBI) macrophage niche. To gain further insights into the mitochondria transfer functions, we infused EBI macrophages in vivo into mice subjected to different modes of anemic stresses. Interestingly, we observed the occurrence of mitochondria transfer events from the infused EBI macrophages to early stages of erythroblasts coupled with enhanced erythroid recovery. Single-cell RNA-sequencing analysis on erythroblasts receiving exogenous mitochondria revealed a subset of highly proliferative and metabolically active erythroid populations marked by high expression of CD47. Furthermore, CD47 or Sirpα blockade leads to a decline in both the occurrence of mitochondria transfer events and their mediated erythroid recovery. Hence, these data indicate a significant role of mitochondria transfer in the enhancement of erythroid recovery from stress through the alteration of the bioenergetic profiles via CD47–Sirpα interaction in the early stages of erythroblasts.
Graphical Abstract
Introduction
Steady-state erythropoiesis generates mature erythrocytes at an estimated rate of 2.5 million RBCs per second in adult humans (Palis, 2014). However, the disruption of homeostatic RBC production by various types of anemic stressors leads to a surge in erythroid output, termed stress erythropoiesis. Acute erythroid stress is commonly caused by hemolysis or hemorrhage (McGrath, 1993). Phenylhydrazine (PHZ)-induced acute hemolytic anemia is a widely adopted model to analyze the responses in the murine bone marrow (BM) and spleen upon erythroid stress. Past studies demonstrated that compromised BM erythroid production upon acute anemic stress is compensated by enhanced splenic erythropoiesis, marked by increased numbers of early erythroid progenitors in the spleen (Hara and Ogawa, 1976).
Besides cell-intrinsic signaling pathways, native BM and splenic macrophages have also been implicated as part of the niche required to mediate stress erythropoiesis. Erythroblastic islands (EBIs) are formed through an interaction between macrophages and erythroblasts during erythropoiesis. Early studies on EBIs focused on the role of EBI macrophages in iron transport, heme biosynthesis, as well as affecting proliferation and survival of erythroblasts (Chasis and Mohandas, 2008; Leimberg et al., 2008; Li et al., 2019). Moreover, under anemic stress, erythroid progenitors have been shown to be closely associated with the splenic EBI macrophage niche (Liao et al., 2018). However, the detailed cellular and molecular mechanisms underlying these intercellular interactions remain unclear, especially under stress conditions.
Mitochondria dynamics play essential roles throughout erythroid differentiation. As important powerhouses of the cells, mitochondria mediate iron metabolism and heme biosynthesis in various stages of erythroblasts, followed by self-elimination via mitophagy to produce fully mature erythrocytes (Gonzalez-Ibanez et al., 2020; Moras et al., 2017; Yang et al., 2019). More recently, intercellular mitochondria transfer has been reported between various cell types contributing to the alteration of functional features of the recipient cells (Moschoi et al., 2016; Torralba et al., 2016). Furthermore, we previously reported that mitochondria are transported from erythroblasts to the EBI macrophages to mediate the steady-state clearance of mitochondria from erythroblasts (Yang et al., 2021). In this study, we further investigated the functions of EBI niche and the potential role of intercellular mitochondria transfer in the context of stress erythropoiesis.
Here, we induced stress erythropoiesis by adopting the PHZ-induced hemolytic anemia model, followed by infusion of exogenous EBI macrophages in vivo via intravenous injection. We discovered that mitochondria are transferred from EBI macrophages to early stages of erythroblasts to mediate their recovery from anemic stress by altering their bioenergetic profiles. Moreover, we identified a subpopulation of early erythroblasts marked by high CD47 expression that is highly sensitive to the molecular functions exerted by mitochondria transfer. Our observations were further validated in a bleeding-induced stress erythropoiesis model. Taken together, our data identify a functionally important role of EBI macrophages in mediating erythroid restoration, following acute anemic stress, via mitochondria transfer.
Results
EBI macrophage infusion facilitates the restoration of erythrocytes from hemolytic (PHZ) stress in vivo
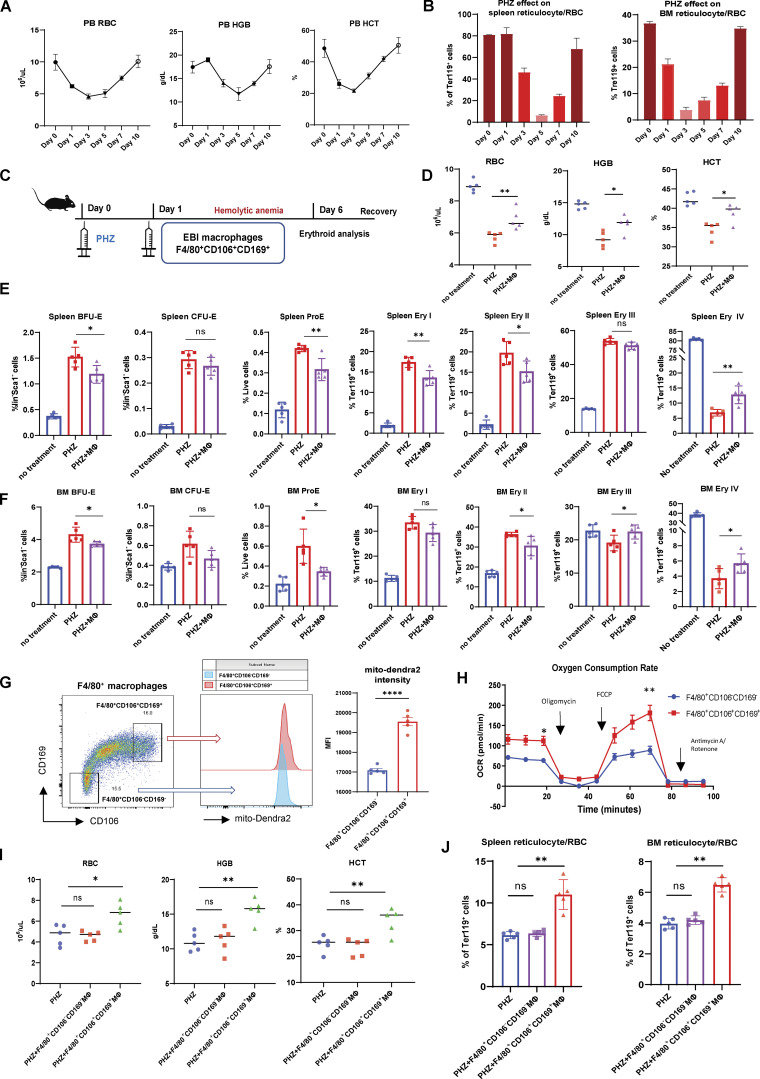
We first analyzed the dynamic changes of erythropoiesis upon PHZ-induced hemolytic anemia. Peripheral blood RBC, hemoglobin (HGB), and hematocrit (HCT) declined to minimum levels and started to recover between 3 and 5 d after PHZ treatment (Fig. 1 A). Similarly, the onset of BM and spleen reticulocytes/RBC recovery occurred ∼3–5 d after PHZ treatment (Fig. 1 B; gating strategy: Fig. S1 A). Of note, we examined the responses from various erythroid populations (BFU-E, CFU-E, proE, and Ery I, II, III, IV) to PHZ stress in BM and spleen, and found that only Ery IV (reticulocyte/RBC) displays a drastic decrease, in accordance with the peripheral blood RBC/HGB/HCT level, whereas earlier erythroid populations are mostly expanded following PHZ stress (Fig. 1, E and F).
Figure 1.
EBI macrophage infusion facilitates the restoration of erythrocytes from PHZ stress in vivo. (A) Peripheral blood analysis of RBC, HGB, and HCT levels in PHZ-treated mice. (B) FACS analysis of reticulocyte/RBC fraction in spleen and BM of PHZ-treated mice. (C) Schematic illustration of the experiment to analyze the effect of EBI macrophage infusion on erythroid recovery in PHZ-stress model. (D) Peripheral blood analysis of untreated and PHZ-treated mice, with or without EBI macrophage infusion. (E and F) FACS analysis of multiple erythroid populations (BFU-E, CFU-E, ProE, Ery I, II, III, IV) in (E) spleen and (F) BM of untreated and PHZ-treated mice, with or without EBI macrophage infusion. (G) Mitochondrial mass in control (F4/80+CD106−CD169−) and EBI (F4/80+CD106+CD169+) macrophages quantified by mito-Dendra2 fluorescence intensity. (H) OCR of control and EBI macrophages isolated by FACS. Macrophages were subjected to stimulation with oligomycin, FCCP, and rotenone and antimycin A. Mean ± SEM; n = 3; *, P < 0.05; **, P < 0.05 by Student’s t test. (I and J) Peripheral blood analysis (I) and FACS analysis (J) of reticulocyte/RBC fraction in spleen and BM of PHZ treated mice with and without control and EBI macrophage infusions. For all FACS quantifications, mean ± SEM; n = 5; *, P < 0.05; **, P < 0.01; ***, P ≤ 0.001; ****, P ≤ 0.0001 by Student’s t test.
Figure S1.
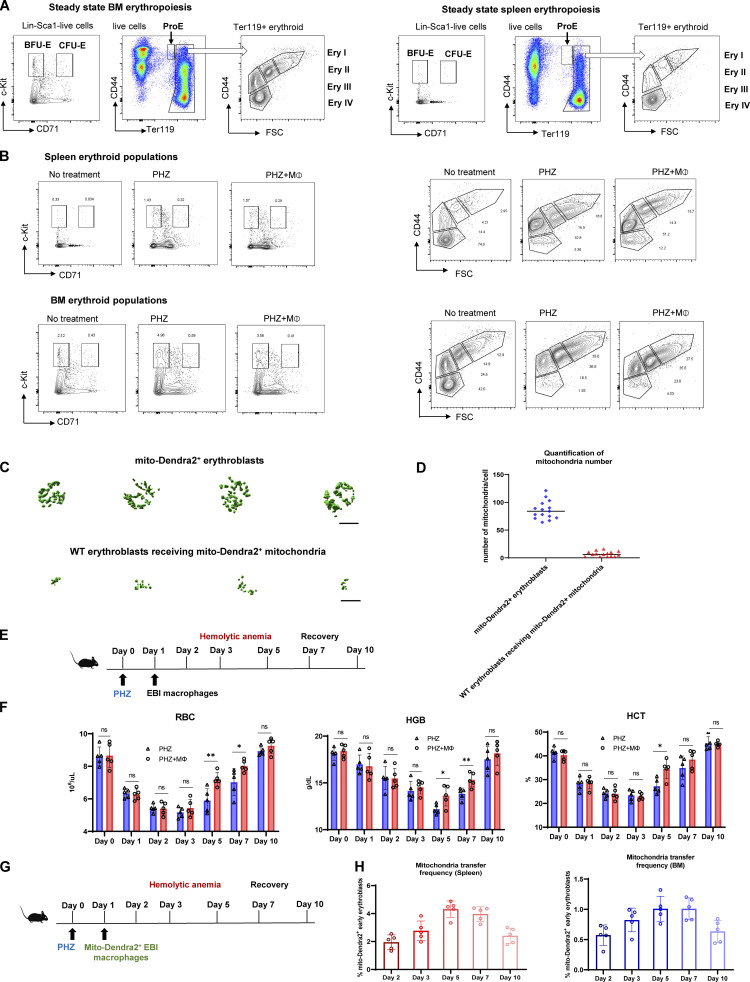
Gating strategy and kinetics for erythroid regeneration and mitochondria transfer. (A) Representative flow cytometric plots showing the gating of BM/splenic erythroid populations based on c-Kit and CD71 expression (BFU-E and CFU-E) and Ter119 and CD44 expression (ProE, Ery I [basophilic], II [polychromatic], III [orthochromatic], IV [reticulocyte/RBC]) under steady state. (B) Representative flow cytometric plots showing the erythroid populations’ responses to PHZ stress, with or without EBI macrophage infusion in spleen and BM. (C and D) Representative isosurface rendering of super-resolution images of Ter119+CD44+ early stages of erythroblasts in native mito-Dendra2 donor mice (upper) and mito-Dendra2–labeled early erythroblasts in recipient wildtype mice (lower) and the numbers of mitochondria were quantified for both categories in D. (E) Schematic illustration of the experiment to analyze the kinetics of erythroid recovery at various time points after EBI macrophage infusion in PHZ stress model. (F) Peripheral blood analysis of the kinetic changes of RBC, HGB, and HCT levels in PHZ-treated mice in the presence and absence of EBI macrophage infusion during different time points of erythroid recovery phases. (G) Schematic illustration of the experiment to analyze the kinetic changes of mitochondria transfer at various time points after EBI macrophage infusion. (H) The kinetic changes of the frequency of mitochondria transfer, as indicated by the percentage of mito-Dendra2+ events, during different time point of erythroid recovery phases. Mean ± SEM; n = 5; *, P < 0.05; **, P < 0.01 by Student’s t test.
To investigate the potential role of EBI macrophages under erythroid stress, we isolated EBI macrophages (F4/80+CD106+CD169+) and intravenously injected three million EBI macrophages into PHZ-treated mice 1 d after PHZ treatment, and analyzed the kinetic changes of peripheral RBC, HGB, and HCT at various time points (Fig. S1 E). Interestingly, we discovered that EBI macrophage infusion accelerated erythroid regeneration most prominently between 4 and 6 d after infusion (Fig. S1 F). Therefore, we focused on the time point of 5 d after EBI macrophage infusion for subsequent analysis (Fig. 1 C). Notably, we observed enhanced recovery of peripheral RBC, HGB, and HCT levels, as well as BM and spleen reticulocyte/RBC populations in mice infused with EBI macrophage (Fig. 1, D–F; and Fig. S1 B). Furthermore, we found that in contrast to reticulocyte/RBC fractions, the expansion pattern observed among earlier erythroid populations during PHZ stress are ameliorated after EBI macrophage infusion (Fig. 1, E and F).
To analyze whether the effect of accelerated erythroid recovery is specific to EBI macrophages, we also isolated F4/80+CD106−CD169− macrophages to serve as a control in our experiments. We first compared the metabolic profiles between both macrophage populations and adopted a transgenic mouse line that ubiquitously expresses mitochondrial-specific Dendra2 fluorescent protein (mito-Dendra2 mice; Pham et al., 2012) to compare their mitochondria dynamics. In comparison with control macrophages (F4/80+CD106−CD169−), the EBI macrophages (F4/80+CD106+CD169+) exhibited higher mitochondrial mass, as shown by the greater mito-Dendra2 fluorescence intensity (Fig. 1 G), and elevated basal and maximal oxygen consumption rates (OCR; Fig. 1 H), which indicates a more metabolically active profile in this population. Importantly, in contrast to the promising effect of EBI macrophage infusion on accelerated erythroid recovery, control macrophages were incapable of facilitating the regeneration of erythroid populations effectively (Fig. 1, I and J). These data suggest that EBI macrophages specifically provide important niche factors to erythroblasts and promote their recovery from PHZ-induced acute anemic stress.
Mitochondria are transported from EBI macrophage to early stages of erythroblasts upon stress
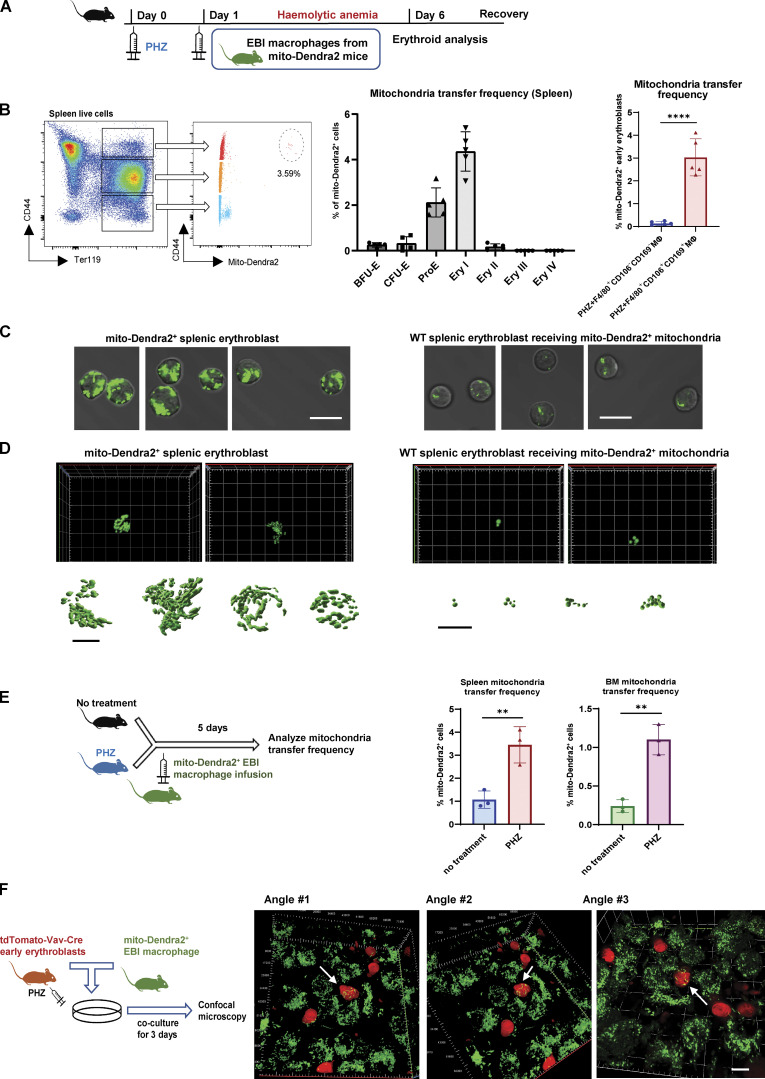
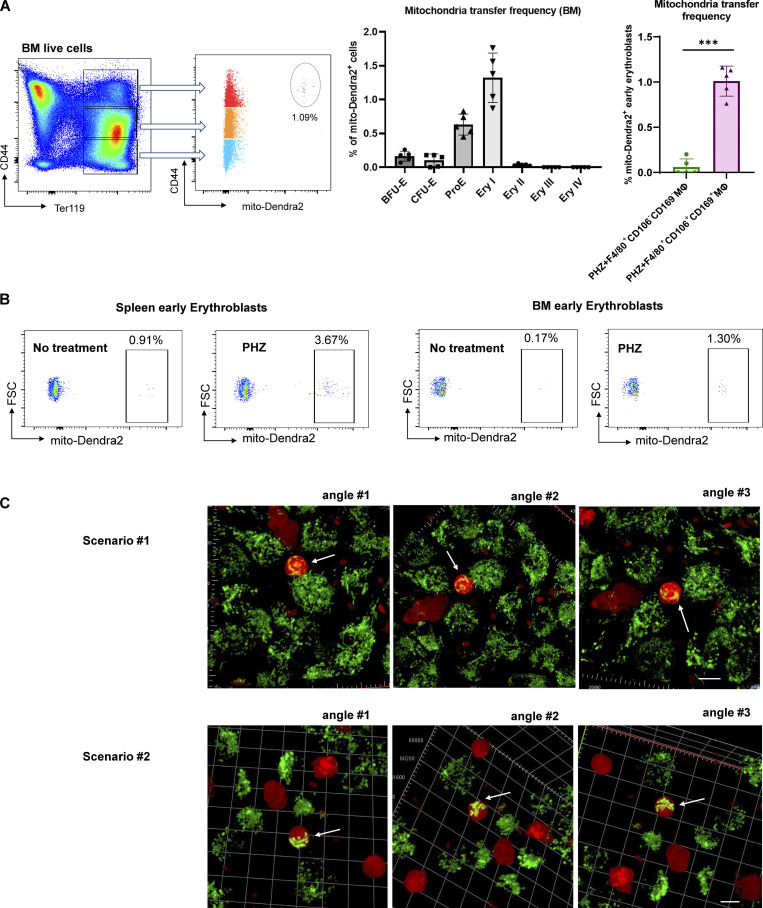
To examine the potential contribution of mitochondrial dynamics in EBI macrophage-mediated erythroid regeneration, we infused EBI macrophages isolated from mito-Dendra2 mice into wildtype mice under PHZ induced anemic stress (Fig. 2 A). Strikingly, we observed that the enhanced erythroid regeneration was associated with the presence of mito-Dendra2–labeled cells residing in both the splenic and BM Ter119+CD44+ populations that correspond with the early stages of erythroblasts (Fig. S1, G and H). More specifically, the presence of mito-Dendra2–labeled mitochondria could be observed in erythroid populations as early as the BFU-E stage, whereas their occurrence was the most prominent in Ery I stage, followed by ProE (Fig. 2 B and Fig. S2 A). Hence, in subsequent analyses, Ery I and proE populations will be analyzed together as “early erythroblasts” to characterize the function of mitochondria transfer. Interestingly, such a phenomenon was almost absent in early erythroblasts infused with control macrophages void of EBI macrophage markers (i.e., CD106 and CD169; Fig. 2 B and Fig. S2 A). Remarkably, EBI macrophages were previously shown to be closely associated with the early stages of erythroblasts (Seu et al., 2017; Yang et al., 2021), hence we postulated that intercellular mitochondria transfer from EBI macrophage to early stages of erythroblasts (i.e., Ery I and ProE) occurred.
Figure 2.
Mitochondria are transported from EBI macrophages to early erythroblasts upon stress. (A) Schematic illustration of the experiment to examine the mitochondrial dynamics in EBI macrophage-mediated erythroid regeneration following PHZ-induced stress. (B) Frequency of mitochondria transfer, as indicated by the percentage of mito-Dendra2+ events, among various stages of erythroid populations in spleen. Mitochondria transfer frequency is also shown among early erythroblasts in spleen of PHZ-treated mice infused with either control (F4/80+CD106−CD169−) or EBI (F4/80+CD106+CD169+) macrophages from mito-Dendra2 mice. Representative FACS plots are shown. Mean ± SEM; n = 5; ***, P ≤ 0.001; ****, P ≤ 0.0001 by Student’s t test. (C) Confocal microscopy images showing native early splenic erythroblasts (Ter119+CD44+) from mito-Dendra2 mice (left) and mito-Dendra2+ early splenic erythroblasts from wildtype mice administered EBI macrophages from mito-Dendra2 mice (right). Scale bar, 10 μm. (D) Representative Z-stack and iso-surface rendering of super-resolution images of native early splenic erythroblasts from mito-Dendra2 mice (left) and mito-Dendra2+ early erythroblasts from wildtype mice administered EBI macrophages from mito-Dendra2 mice (right). Scale bar, 5 μm. (E) Frequency of mitochondria transfer as indicated by the percentage of mito-Dendra2+ events among early erythroblast in the spleens (left) and BM (right) of untreated or PHZ-treated mice infused with EBI macrophages from mito-Dendra2 mice. Schematic illustration of the experiment is shown. Mean ± SEM; n = 3; **, P < 0.01 by Student’s t test. (F) Confocal microscopy images showing the presence of mito-Dendra2–labeled mitochondria in recipient erythroblasts (isolated from PHZ stressed tdTomato-Vav-Cre mice) in close contact with donor EBI macrophages (isolated from mito-Dendra2 mice) after coculture for 3 d. A schematic illustration of the experiment is shown. Scale bar, 10 μm.
Figure S2.
Characterization of mitochondria transfer. (A) Frequency of mitochondria transfer, as indicated by the percentage of mito-Dendra2+ events, among various stages of erythroid populations in BM. Mitochondria transfer frequency is also shown among early erythroblasts in BM of PHZ-treated mice infused with either control (F4/80+CD106−CD169−) or EBI (F4/80+CD106+CD169+) macrophages from mito-Dendra2 mice. Representative FACS plots are shown. Mean ± SEM; n = 5; ***, P ≤ 0.001; ****, P ≤ 0.0001 by Student’s t test. (B) Representative flow cytometric plots showing the gating of mito-Dendra2+ population that were identified as having received mitochondria in mice under steady state and PHZ-stress respectively. (C) Confocal microscopy images showing the presence of mito-Dendra2–labeled mitochondria in recipient erythroblasts (isolated from PHZ-stressed tdTomato-Vav-Cre mice) in close contact with donor EBI macrophages (isolated from mito-Dendra2 mice) upon coculture for 3 d. Two separate scenarios with three different angles each were shown. Scale bar, 10 μm.
Closer examination by confocal imaging revealed that the quantity and distribution of the mito-Dendra2–labeled mitochondria in the early erythroblasts from recipient wildtype mice was distinct from that of the native early erythroblasts isolated from mito-Dendra2 mice (Fig. 2 C). To further validate our observation, we utilized super-resolution imaging to construct three-dimensional z-stack images of the mitochondria structure in native early erythroblasts (from mito-Dendra2 mice) and wildtype early erythroblasts that received exogenous mito-Dendra2–labeled mitochondria and observed that 2–16 mitochondria were transferred into early erythroblasts (Fig. 2 D and Fig. S1, C and D).
Given that mitochondria transfer events were observed under stress conditions, we next investigated whether mitochondria transfer takes place during a steady state by infusing EBI macrophages isolated from mito-Dendra2 mice directly into wildtype mice. Interestingly, the mitochondria transfer frequency (percentage of early erythroblasts that are mito-Dendra2+) was significantly higher in splenic and BM early erythroblasts from PHZ-treated mice compared to those from untreated mice (Fig. 2 E and Fig. S2 B), suggesting that mitochondria transfer events from EBI macrophages to erythroblasts increase under stress conditions, during which erythropoiesis is highly upregulated to regenerate RBCs.
Next, we continued to examine the mitochondria transfer machineries and adopted the in vitro coculture systems previously established (Yang et al., 2021). Here, to visualize the transfer events between different cell types, we generated tdTomato-Vav-Cre mice and induced PHZ stress, followed by isolation of their early erythroblasts to coculture with EBI macrophages isolated from mito-Dendra2+ mice. Notably, after 3 d of coculture, we observed the presence of mito-Dendra2–labeled mitochondria in multiple tdTomato+ early erythroblasts that were closely attached to adjacent EBI macrophages (Fig. 2 F and Fig. S2 C). Of note, as mitochondria transfer events observed here predominantly involved cell–cell contact, we proposed that “direct uptake” might be the most common mode of mitochondria transfer from EBI macrophage to stressed early erythroblasts.
Mitochondria transfer confers proliferation signature to a subpopulation of early erythroblasts expressing CD47
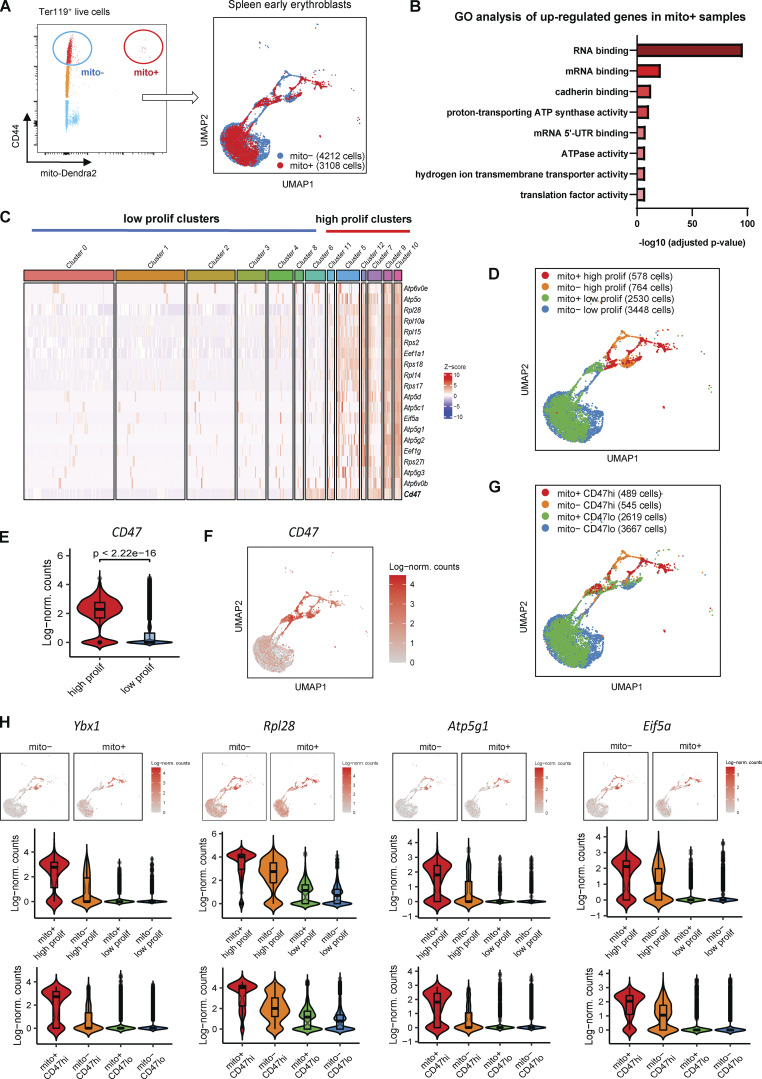
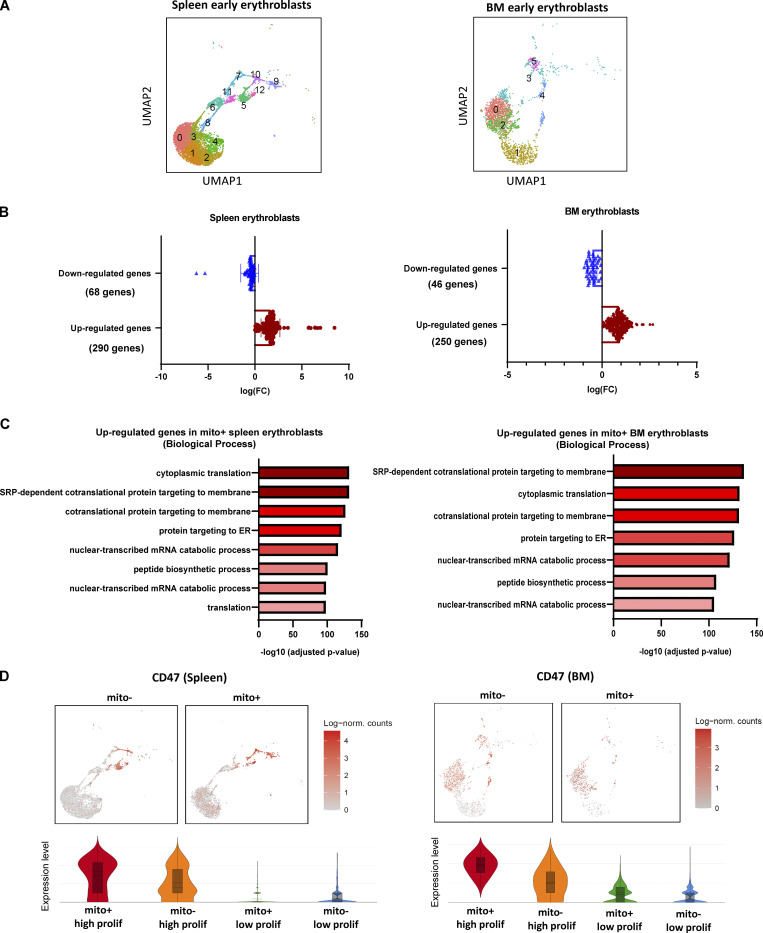
To elucidate the functional role of mitochondria transfer between EBI macrophages and early erythroblasts, we isolated early erythroblasts with and without transferred mitochondria based on the presence of mito-Dendra2–labeled mitochondria (Fig. 3 A; labeled as mito+ and mito− respectively) and performed single-cell RNA sequencing (scRNA-seq; Fig. S3 A). Differential gene expression analysis performed on the scRNA-seq data showed that mitochondria transfer to both splenic and BM early erythroblasts was associated with a higher number of upregulated genes compared to downregulated genes (Fig. S3 B), suggesting that mitochondria transfer may exert an activating effect. Importantly, Gene Ontology (GO) analysis performed via Enrichr (Chen et al., 2013; Kuleshov et al., 2016; Xie et al., 2021) on molecular functions of upregulated genes upon mitochondria transfer revealed a striking enrichment of genes associated with RNA/mRNA binding (translation) in both splenic and BM early erythroblasts (Fig. 3 B; and Figs. S3 C and S4 F). A closer examination of RNA binding GO datasets revealed a myriad of ribosomal genes (e.g., Rpl28, Rpl14, Rpl10a, Rps18, etc.) and translation/protein synthesis related genes (Ybx1, Eif5a, Eef1a1, Eef1g, etc.). In addition, ATP metabolism is another GO molecular function highly enriched in mitochondria-transferred splenic early erythroblasts, consisting of ATP synthase/ATPase/hydrogen ion transmembrane transporter activities (Fig. 3 B). Of note, both ribosome/protein synthesis and ATP activity-related genes symbolize proliferation signatures (Shahbazian et al., 2010; Vadivel Gnanasundram and Fåhraeus, 2018) and are highly upregulated upon mitochondria transfer.
Figure 3.
Mitochondria transfer confers proliferation signatures to a subpopulation of early erythroblasts expressing CD47. (A) Gating strategy used to isolate mito-Dendra2− (mito−; without exogenous mitochondria transfer) and mito-Dendra2+ (mito+; with exogenous mitochondria transfer) early erythroblasts (left). UMAP visualization (right) of pooled scRNA-seq data is shown and includes 4,212 mito− cells and 3,108 mito+ splenic early erythroblasts. (B) Enrichment analysis (GO molecular function) of genes upregulated in mito+ early splenic early erythroblasts (vs. mito−) via EnrichR. (C) Gene expression profiling based on selected proliferation signatures among the 12 clusters identified from splenic pool of early erythroblasts, and their clustering into high and low proliferating clusters respectively. (D) UMAP visualization based on high and low proliferating clusters in the pooled (mito+ and mito−) splenic early erythroblasts. (E and F) Violin plots showing the differences in CD47 gene expression between high and low proliferating clusters, and (F) UMAP visualization of CD47 expression in splenic early erythroblasts. (G) UMAP visualization based on CD47hi and CD47lo clusters in the pooled (mito+ and mito−) splenic early erythroblasts. (H) Violin plots comparing the differences in selected proliferation signature gene expressions of high and low proliferating clusters vs. CD47hi and CD47lo clusters, in mito+ and mito− splenic erythroblasts respectively.
Figure S3.
Spleen and BM scRNA-seq analysis. (A) UMAP visualization of original clustering in the pooled (mito+ and mito−) early erythroblasts in spleen and BM. (B) Quantification of the number of up-regulated genes and down-regulated genes in spleen and BM erythroblast after mitochondria transfer. (C) Bar plots showing the enriched up-regulated GO biological processes from spleen (left) and BM (right) mito+ samples (vs. mito− samples) via EnrichR. (D) UMAP visualization and Violin plots comparing the differences in CD47 expressions of high and low proliferating clusters in mito+ and mito− spleen and BM erythroblasts respectively.
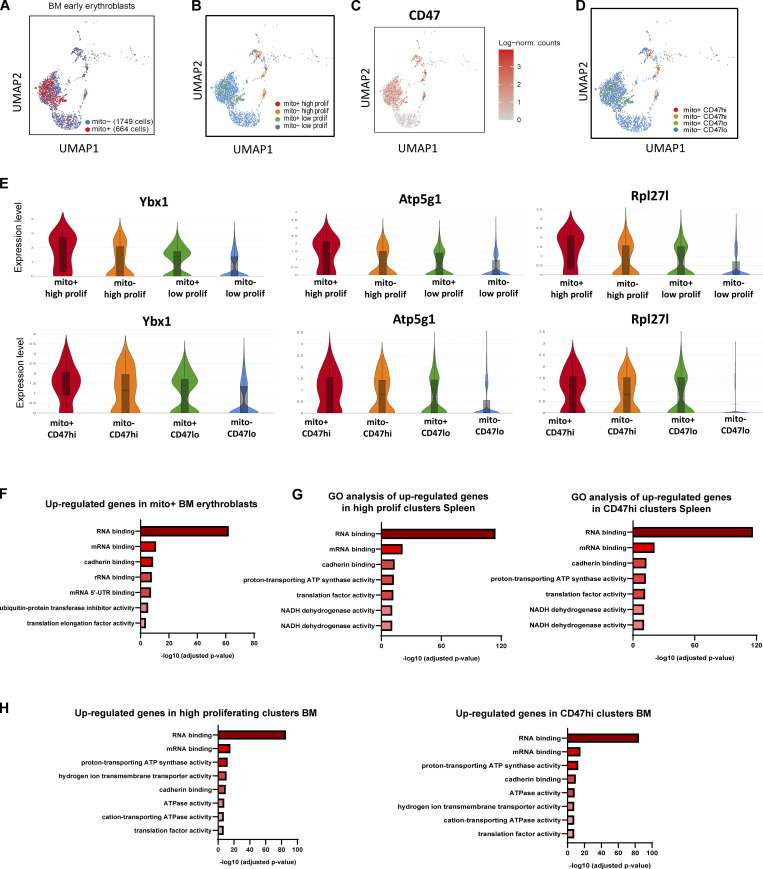
Figure S4.
BM and Spleen scRNA-seq and GO analysis. (A) UMAP visualization of pooled scRNA-seq data is shown including 1,749 mito− cells and 664 mito+ BM early erythroblasts. (B) UMAP visualization of re-clustering of high and low proliferating groups in the pooled (mito+ and mito−) BM early erythroblasts. (C) UMAP visualization of CD47 expression in BM samples. (D) UMAP visualization of re-clustering of CD47hi and CD47lo clusters in the pooled (mito+ and mito−) BM early erythroblasts. (E) Violin plots comparing the differences in selected proliferation signature gene expressions of high and low proliferating clusters vs. CD47hi and CD47lo clusters, in mito+ and mito− BM erythroblasts, respectively. (F) Bar plots showing the enriched up-regulated GO molecular functions from BM mito+ samples (vs. mito− samples). (G) Bar plots showing the enriched up-regulated GO molecular functions from splenic high proliferating clusters (vs. low proliferating clusters, left panel) and CD47hi clusters (vs. CD47lo, right panel) respectively. (H) Bar plots showing the enriched up-regulated GO molecular functions from BM high proliferating clusters (vs. low proliferating clusters, left panel) and CD47hi clusters (vs. CD47lo, right panel) respectively.
To characterize these molecular functions at the single-cell level, we further classified the pooled spleen and BM early erythroblast populations, respectively, based on the expression of significantly enriched proliferation signatures and reclustered them into distinctive “high proliferating” and “low proliferating” clusters (Fig. 3, C and D; and Fig. S4 B). To isolate these clusters for functional analysis, we screened through surface markers, which are able to mark proliferation signatures and that are upregulated upon mitochondria transfer (Fig. 3 C, E and F; and Fig. S3 D), and identified CD47 (integrin-associated protein) as a highly promising candidate.
CD47 is highly expressed in erythroid lineages and functions as a ligand for signal regulatory protein alpha (SIRPα), which is highly expressed by myeloid phagocytic cells including granulocytes, monocytes, dendritic cells, and macrophages (Oldenborg, 2004; Seiffert et al., 1999). CD47–SIRPα interaction leads to the recruitment of phosphatases that function to inhibit phagocytosis (Fujioka et al., 1996), thus delivering a “don’t eat me” signal (Russ et al., 2018). Given that erythroid cells are susceptible to phagocytic clearance by macrophages upon exposure to PHZ-induced stress, we postulated that CD47 has a role in potentiating erythroid recovery mediated by mitochondria transfer. Indeed, CD47 expression was highly correlated with the expression of proliferation signatures enriched after mitochondria transfer (Fig. 3, C–F; and Fig. S4, B and C). Therefore, we reclustered the erythroblasts into CD47hi and CD47lo clusters based on CD47 expression and found a close association of CD47 expression with proliferation gene signatures (Fig. 3 D, G and H; and Fig. S4, B–E). Notably, molecular functions reflected by gene sets enriched in CD47hi clusters are highly correlated with those enriched in high proliferating clusters, and both are closely associated with the molecular functions delivered by mitochondria transfer (Fig. 3 B and Fig. S4, F–H). All these data indicate a potential connection between mitochondria transfer–mediated erythroid recovery with proliferation signatures and CD47 expression.
Early erythroblasts display enhanced protein synthesis and ATP metabolism upon PHZ stress and mitochondria transfer
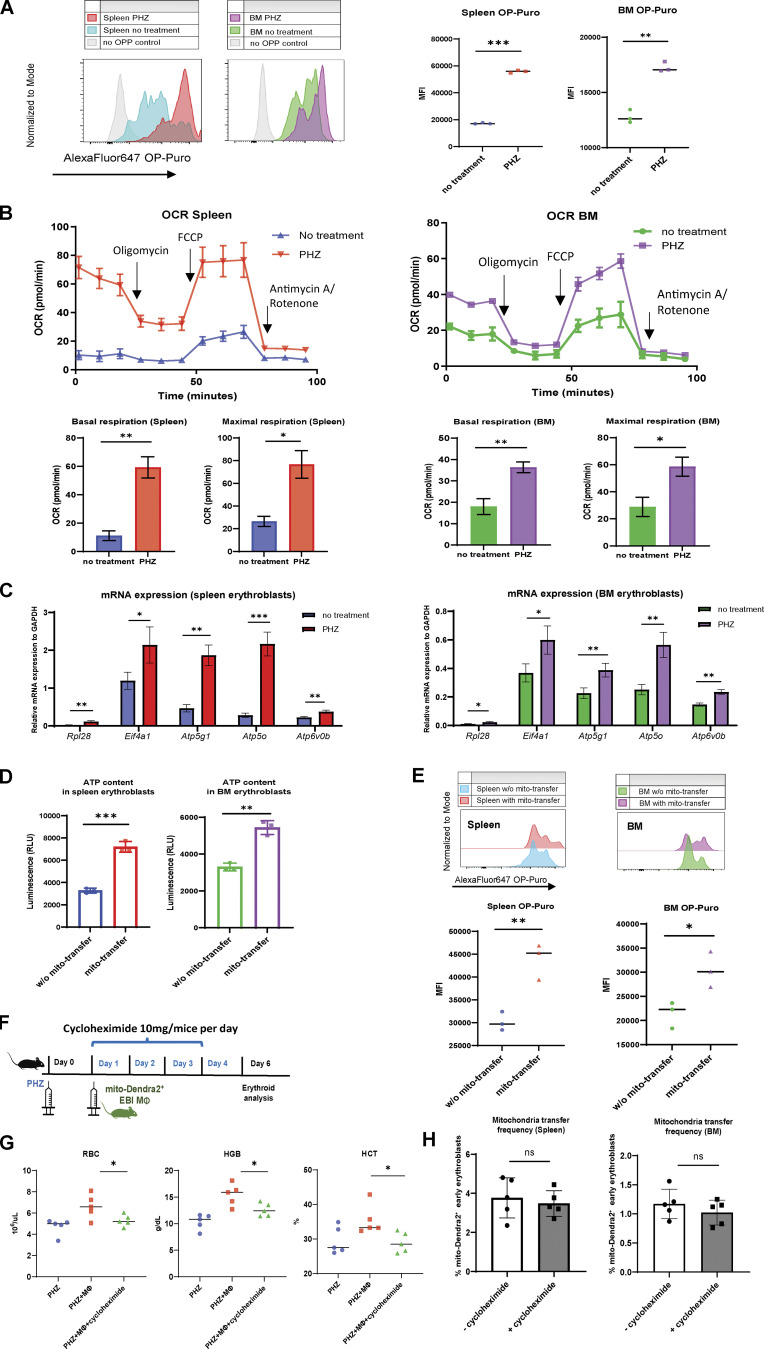
To dissect the functional role of mitochondria transfer, we further profiled changes in translation and metabolic status of early stages of erythroblasts. First, we observed significantly enhanced protein synthesis (measured by OP-Puro protein synthesis assay) and mitochondrial OCR in early erythroblasts upon PHZ treatment (Fig. 4, A and B), indicating that these erythroblasts become more metabolically active to overcome stress. In agreement, selected genes associated with protein synthesis (Rpl28, Eif4a1) and ATP metabolism (Atp5g1, Atp5o, Atp6vob) were significantly upregulated in early erythroblasts under anemic stress (Fig. 4 C), supporting their enhanced translational and metabolic functions.
Figure 4.
Protein and ATP synthesis is enhanced upon erythroid stress and potentiated by mitochondria transfer. (A) Protein synthesis rate, as determined by OP-Puro incorporation of splenic and BM early erythroblasts under steady state and PHZ stress. Signal in mice erythroblasts without administration of OP-Puro was included as the negative control. Representative FACS plots are shown. (B) OCR of splenic and BM early erythroblasts under steady state and PHZ stress. Quantifications of basal and maximal respiration are shown. (C) mRNA expression of Rpl28, Eif4a1, Atp5g1, Atp5o, and Atp6v0b in early erythroblasts under steady state and PHZ stress. Error bars indicate the SEM for three independent experiments. (D) ATP content of splenic and BM early erythroblasts in the presence (mito-Dendra2+) and absence (mito-Dendra2−) of mitochondria transfer measured by CellTiter-Glo Luminescent Cell Viability Assay. (E) Protein synthesis rate of splenic and BM early erythroblasts in the presence and absence of mitochondria transfer. Representative FACS plots are shown. For all quantification, mean ± SEM; n = 3; *, P < 0.05; **, P < 0.01; ***, P ≤ 0.001 by Student’s t test. (F) Schematic illustration of the experiment to verify the effect of protein synthesis inhibition on mitochondria transfer and erythroid recovery. 10 mg of cycloheximide was administered in parallel with EBI macrophages from mito-Dendra2 mice into PHZ-treated mice. (G) Peripheral blood analysis of PHZ-treated mice administered either cycloheximide and/or EBI macrophages (MΦ). (H) Frequency of mitochondria transfer, as indicated by the percentage of mito-Dendra2+ events, among early erythroblasts in spleen and BM, in the presence or absence of cycloheximide.
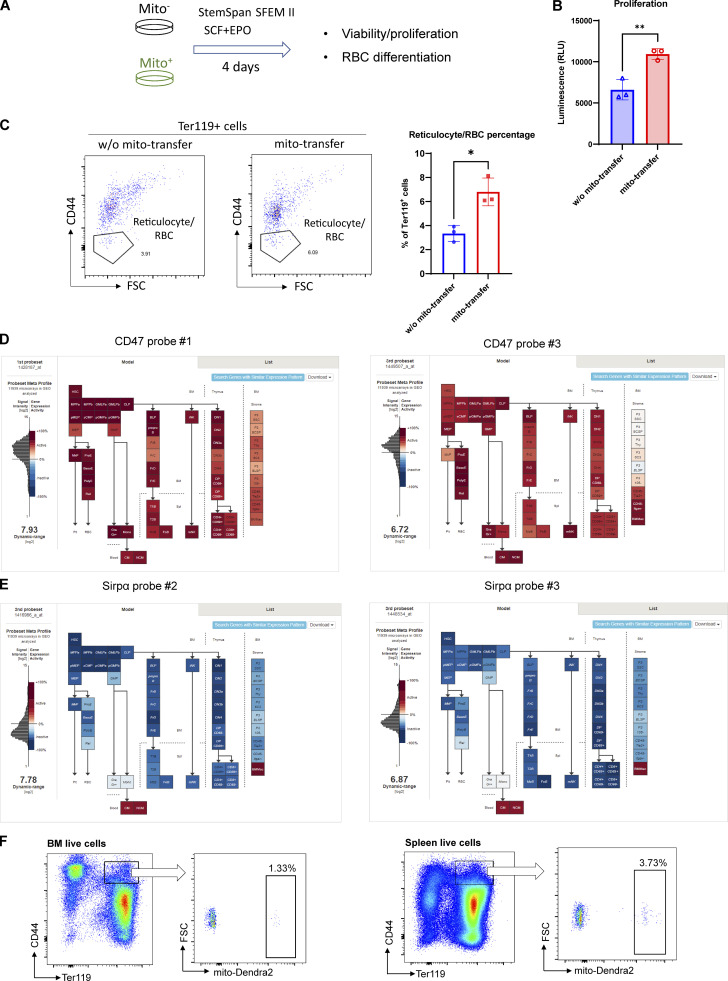
Interestingly, consistent with the molecular functions of mitochondria transfer inferred from GO analysis and erythroid regeneration dynamics, mitochondria transfer was found to be associated with increased ATP content/proliferation and protein synthesis in recipient early erythroblasts, as well as greater capability to differentiate into reticulocyte/RBCs (Fig. 4, D and E; and Fig. S5, A–C). These findings suggest that erythroblasts switch to a more metabolically active biogenetic profile in response to stress, and this effect is potentiated by mitochondria transfer.
Figure S5.
In vitro validation of mitochondria transfer functions and characterization in bleeding model. (A) Schematic illustration of the experiment to analyze the functions of mitochondria transfer from in vitro culture of splenic early erythroblasts (mito−: w/o mito-transfer; and mito+: mito-transfer). (B) Proliferation of the indicated splenic early erythroblasts populations measured by CellTiter-Glo Luminescent Cell Viability Assay. (C) FACS analysis of reticulocytes/RBC fractions from in vitro culture of mito− and mito+ early erythroblasts respectively. For all quantification, mean ± SEM; *, P < 0.05; **, P < 0.01, by Student’s t test. (D) Cd47 mRNA expression by gene expression microarray on BM-HSPC, mature leukocytes, stromal cells and nucleated erythroid cells. Data are from the Gene Expression Commons dataset (https://gexc.riken.jp/models/1649/genes/Cd47). (E) Sirpα mRNA expression by gene expression microarray on BM-HSPC, mature leukocytes, stromal cells and nucleated erythroid cells. Data were obtained from the Gene Expression Commons dataset that is available online (https://gexc.riken.jp/models/1649/genes/Sirpa). (F) Representative flow cytometric plots showing the gating of mito-Dendra2+ population that were identified as having received mitochondria in BM and splenic early erythroblasts after bleeding.
To verify this hypothesis, we administered cycloheximide, a well-established protein synthesis inhibitor, in vivo and observed prominently compromised RBC regeneration (Fig. 4, F and G). However, the effect of protein synthesis inhibition on mitochondria transfer frequency is much less significant (Fig. 4 H), suggesting that mitochondria transfer is more likely to be an upstream event of protein synthesis, to regulate the proliferation of early erythroblasts.
CD47 expression defines a subpopulation of metabolically active early erythroblasts with a higher abundance of mitochondria transfer events
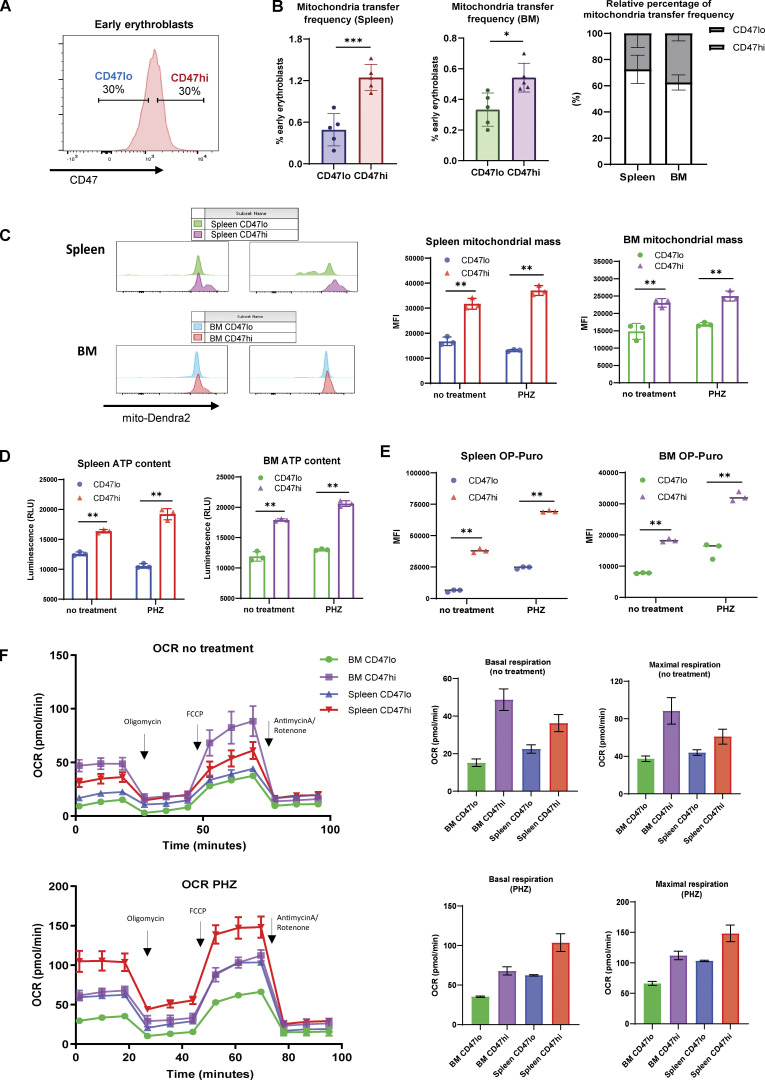
Given the close association between CD47 and proliferation signatures, we proceeded to investigate the functional difference between CD47hi and CD47lo early erythroblasts (gating strategy for CD47hi and CD47lo: Fig. 5 A). Remarkably, we found that mitochondria transfer occurred predominantly in CD47hi early erythroblasts compared to the CD47lo counterparts, especially in the splenic early erythroblasts (Fig. 5 B). Subsequent functional analysis revealed that CD47hi early erythroblasts contained higher mitochondrial mass under both steady state and stress conditions (Fig. 5 C). Moreover, we found that CD47 marks a subpopulation of early erythroblasts that has greater protein synthesis and ATP production activities, which were even more prominent under stress than in the steady state (Fig. 5, D and E). Mitochondrial respiration analysis also revealed a metabolic switch in early erythroblasts following exposure to anemic stress. Specifically, CD47hi BM early erythroblasts are the most metabolically active under steady state, followed by CD47hi splenic early erythroblasts, whereas splenic CD47hi early erythroblasts become most metabolically active after PHZ stress (Fig. 5 F). Collectively, our data demonstrate that CD47 expression defines a subpopulation of metabolically active early erythroblasts with a higher abundance of mitochondria transfer events.
Figure 5.
CD47 marks enhanced protein and ATP synthesis and is associated with mitochondria transfer. (A) Representative gating strategy of CD47lo (bottom 30%) and CD47hi (top 30%) fractions within BM and splenic early erythroblasts. (B) Mitochondria transfer frequency in CD47lo and CD47hi splenic and BM early erythroblasts respectively (left), and their relative percentage of occurrence in spleen and BM respectively (right). (C) Mitochondria mass, as determined by mito-Dendra2 fluorescence intensity, of the indicated splenic and BM early erythroblasts populations (CD47lo and CD47hi) under steady state and PHZ stress. (D) ATP content of the indicated splenic and BM early erythroblast populations (CD47lo and CD47hi) under steady state and PHZ stress, measured by CellTiter-Glo Luminescent Cell Viability Assay. (E) Protein synthesis rate, as determined by OP-Puro incorporation, of the indicated splenic and BM early erythroblasts populations (CD47lo and CD47hi) under steady state and PHZ stress. (F) OCR of the indicated splenic and BM early erythroblast populations (CD47lo and CD47hi) under steady state (upper panel) and PHZ stress (lower panel). The quantifications of basal and maximal respiration are shown. For all quantification, mean ± SEM; *, P < 0.05; **, P < 0.01; ***, P ≤ 0.001 by Student’s t test.
CD47 or Sirpα blockade abrogates erythroid recovery from PHZ stress
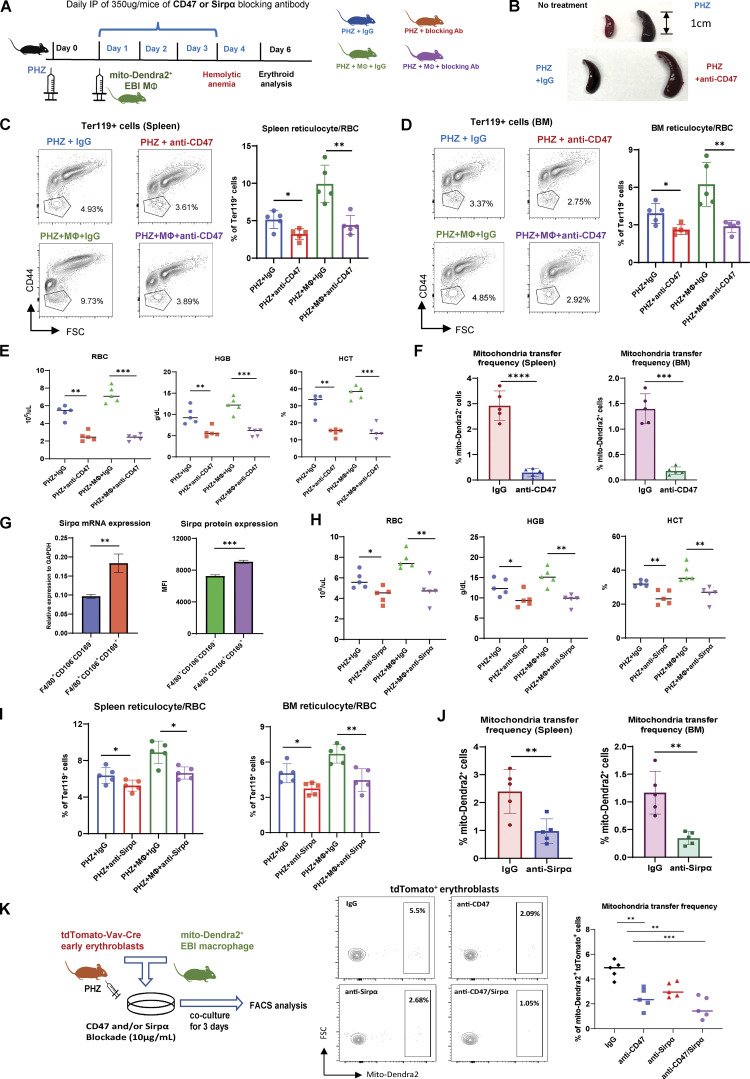
To further validate the function of CD47 in mitochondria transfer-mediated erythroid recovery, we administered CD47 blocking antibody (anti-CD47) in vivo (Fig. 6 A). Strikingly, we observed severely enlarged spleens with CD47 blockade in addition to the effect of PHZ (Fig. 6 B), indicating exacerbated anemic stress. Functionally, CD47 blockade effectively abrogated erythroid recovery from PHZ stress both in the presence and absence of EBI macrophage infusion (Fig. 6, C–E). This compromised erythroid regeneration was associated with a significant reduction in mitochondria transfer events in both splenic and BM early erythroblasts (Fig. 6 F). These data suggest that CD47 blockade disrupts mitochondria transfer–mediated erythroid recovery from PHZ-induced anemic stress.
Figure 6.
CD47 or Sirpα blockade abrogates mitochondria transfer–mediated erythroid recovery from acute anemic stress. (A) Schematic illustration of the experiment to validate the function of CD47 in mitochondria transfer–mediated erythroid recovery. CD47 blocking antibody (anti-CD47) or Sirpα blocking antibody (anti-Sirpα) was administered in parallel with EBI macrophages from mito-Dendra2 mice into PHZ-treated mice. (B) Spleen morphology before and after PHZ treatment (upper), with and without CD47 blockade (lower). (C and D) FACS analysis of reticulocytes/RBC fraction in (C) spleen and (D) BM of PHZ-treated mice administered either IgG (control), CD47 Ab (anti-CD47), and/or EBI macrophages (MΦ). (E) Peripheral blood analysis of PHZ-treated mice administered either IgG (control), CD47 Ab (anti-CD47), and/or EBI macrophages (MΦ). (F) Frequency of mitochondria transfer, as indicated by the percentage of mito-Dendra2+ events, among early erythroblasts in spleen and BM; in the presence or absence of CD47 blockade. (G) Expression level of Sirpα mRNA and protein in control (F4/80+CD106−CD169−) and EBI (F4/80+CD106+CD169+) macrophages. (H and I) Peripheral blood (H) and (I) FACS analysis of reticulocytes/RBC fraction in PHZ-treated mice administered either IgG (control), Sirpα blocking antibody (anti-Sirpα), and/or EBI macrophages (MΦ). (J) Frequency of mitochondria transfer among splenic and BM early erythroblasts in the presence or absence of Sirpα blockade. For all quantification, mean ± SEM; *, P < 0.05; **, P < 0.01; ***, P ≤ 0.001; ****, P ≤ 0.0001 by Student’s t test. (K) Frequency of mitochondria transfer from cocultured mito-Dendra2+ EBI macrophages to erythroblasts isolated from PHZ treated tdTomato-Vav-Cre mice, in the presence or absence of CD47 and/or Sirpα blockade. Schematic illustration of the experimental design is shown. For all quantification, mean ± SEM; **, P < 0.01; ***, P ≤ 0.001 by Student’s t test.
To rule out the broad inhibitory effect of CD47, which is also expressed on various HSPC populations as evidenced by Gene Expression Commons datasets (Seita et al., 2012; Fig. S5 D), we next targeted its well-characterized binding partner Sirpα. The expression of Sirpα is mostly restricted to macrophages (Fig. S5 E), thus the effect of Sirpα blockade would be much more specific. Interestingly, both mRNA and protein expression of Sirpα is higher in EBI macrophages (F4/80+CD106+CD169+) than in control macrophages (F4/80+CD106−CD169−; Fig. 6 G). Similar to CD47 blockade, Sirpα blockade compromised erythroid recovery in peripheral blood, as well as spleen and BM reticulocytes/RBC fractions (Fig. 6, H and I), although the effects appeared to be lesser compared to that of CD47 blockade. Of note, the occurrence of mitochondria transfer was also reduced upon Sirpα blockade (Fig. 6 J).
Next, to find out whether CD47–Sirpα interaction between erythroblasts and EBI macrophages can mediate mitochondria transfer, we administered CD47 and/or Sirpα blocking antibody in the in vitro coculture systems. Strikingly, both CD47 and Sirpα blockade reduced mitochondria transfer frequency in vitro, and coadministration of both blocking antibodies displayed synergistic effects (Fig. 6 K). These data suggest that CD47–Sirpα interaction is required for mitochondria transfer to occur, possibly involving their mediation in cell–cell contact and/or downstream signaling.
Mitochondria transfer from EBI macrophages ameliorates erythroid stress after in vivo serial blood withdrawal
In addition to hemolysis-induced acute anemic stress, another common cause of acute anemia is due to excessive blood loss (McGrath, 1993). Although the underlying physiological mechanisms that trigger anemia are different between PHZ and bleeding, active erythroid progenitor self-renewal has been observed in both experimental models (Angulo et al., 2018). Therefore, to confirm the role of mitochondria transfer in stress erythropoiesis, we adopted serial bleeding as an alternative approach to model anemic stress.
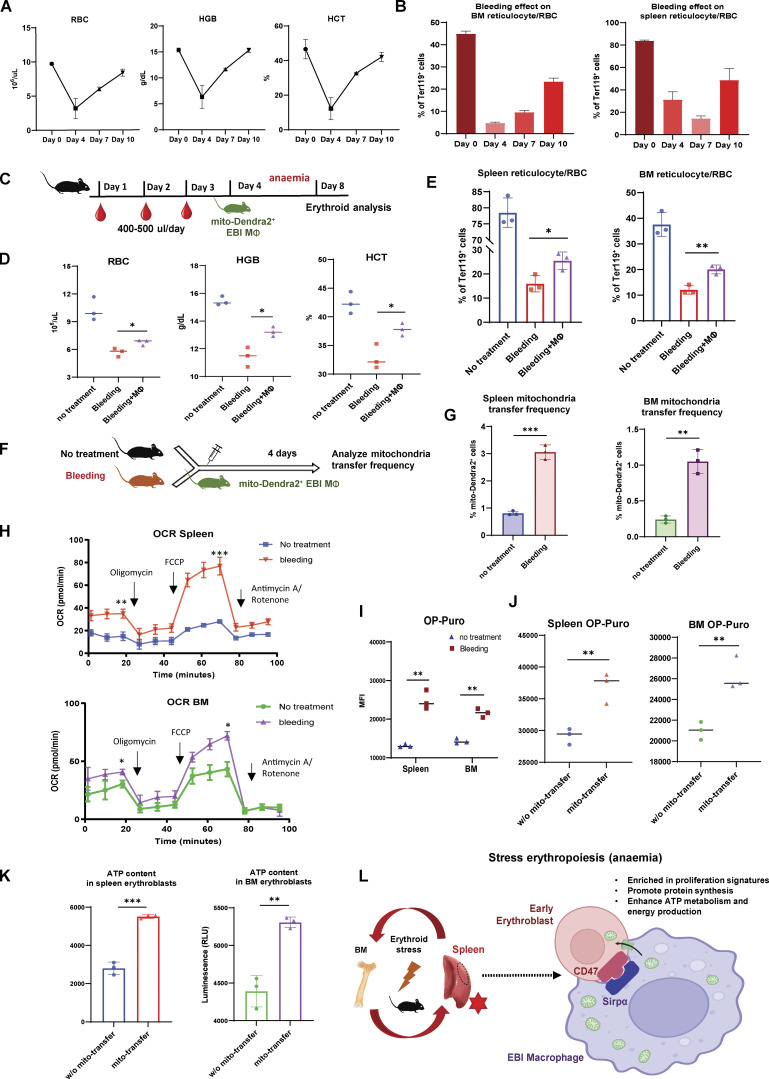
We first examined the erythroid recovery dynamics following serial bleeding for three consecutive days and observed minimum peripheral blood RBC/HGB/HCT levels 1 d after the serial bleeding, which marks the onset of recovery (Fig. 7 A). Similarly, BM and spleen reticulocytes/RBC recovery started approximately 1–3 d after the last serial bleeding (Fig. 7 B). Based on the erythroid recovery dynamics after bleeding, we infused EBI macrophages isolated from mito-Dendra2 mice 1 d after the last bleeding (Fig. 7 C) and observed accelerated erythroid recovery 4 d later in peripheral blood RBC/HGB/HCT levels as well as splenic and BM reticulocytes and RBCs percentage (Fig. 7, D and E). We also observed the presence of mito-Dendra2–labeled early erythroblasts, which indicates the occurrence of mitochondria transfer (Fig. S5 F). Similar to the PHZ stress model, the occurrence of mitochondria transfer to early erythroblasts was significantly boosted in response to stress from bleeding (Fig. 7, F and G).
Figure 7.
Mitochondria transfer from EBI macrophages ameliorates erythroid stress from serial blood withdrawal. (A) Peripheral blood analysis of RBC, HGB, and HCT levels of mice after serial bleeding. (B) FACS analysis of erythroid fraction in spleen and BM of mice after serial bleeding. (C) Schematic illustration of the experiment to analyze the effect of EBI macrophage infusion on erythroid recovery following serial bleeding. (D and E) Peripheral blood analysis (D) and FACS analysis (E) of erythroid fraction in spleen and BM of mice treated with the indicated conditions. (F) Schematic illustration of the experiment to assess mitochondria transfer frequency in response to serial bleeding. (G) Frequency of mitochondria transfer, as indicated by the percentage of mito-Dendra2+ events among early erythroblasts, in the spleens and BM of untreated or serially bled mice infused with EBI macrophages from mito-Dendra2 mice. (H) OCR of splenic and BM early erythroblasts under steady state and serial bleeding stress. (I) Protein synthesis rate, as determined by OP-Puro incorporation, of splenic and BM early erythroblasts under steady state and serial bleeding stress. (J) Protein synthesis rate of splenic and BM early erythroblasts, with or without transferred mitochondria, from serially bled mice. (K) ATP content of splenic and BM early erythroblasts, with or without transferred mitochondria, from serially bled mice. For all quantification, mean ± SEM; *, P < 0.05; **, P < 0.01; ***, P ≤ 0.001 by Student’s t test. (L) Proposed model of EBI macrophage-mediated erythroid recovery involving transfer of mitochondria from EBI macrophages to early erythroblasts, with is associated with an enhanced proliferative profile, particularly in a CD47 marked erythroblast subset. The mitochondria transfer events are possibly regulated by CD47–Sirpα mediated cell–cell interaction. The illustration was created with BioRender.com.
Functional analysis demonstrated that serial bleeding also resulted in increased metabolic activities in the early stages of erythroblasts, as reflected by the elevated mitochondrial oxygen consumption as well as protein synthesis rate (Fig. 7, H and I). More importantly, the elevated protein synthesis rate and ATP level in early erythroblasts after bleeding were associated with the presence of transferred mitochondria (Fig. 7, J and K), similar to what we observed with PHZ-induced anemic stress.
Collectively, our data demonstrate that both PHZ- and bleeding-induced acute anemic stress can be rescued by exogenous EBI macrophage infusion mediated by intercellular mitochondria transfer–instigated enhancement of metabolism and proliferation.
Discussion
In this study, we unveiled a novel role of EBI macrophage in the cellular response to acute anemic stress via intercellular mitochondria transfer. Splenic erythroblasts are the primary sites to overcome acute anemic stress and are closely associated with EBI macrophages. Here, we definitively demonstrated that mitochondria are transported from EBI macrophages to the early stages of erythroblasts in steady state erythropoiesis, and this process is significantly enhanced under anemic stress conditions. Erythroblasts receiving mitochondria are more vigorous in proliferation, protein synthesis, and energy production to drive their effective recovery, particularly in a subpopulation defined by high CD47 expression (Fig. 7 L).
Recently, important functions of intercellular mitochondria transfer have been implicated in multiple studies. The most profound role of mitochondria transfer is to alter the bioenergetic state of the recipient cells, affecting their proliferation, survival, differentiation, inflammatory responses, or drug resistance (Zampieri et al., 2021). Interestingly, scRNA-seq analysis of early erythroblasts that have gained mitochondria from EBI macrophages revealed a subset of erythroid populations marked by high expression of CD47. Cells in this particular subset are highly enriched in proliferation signature, including protein synthesis and ATP metabolic processes (Fig. 3). Furthermore, CD47 or Sirpα blockade leads to a remarkable decline in both mitochondria transfer events as well as their mediated erythroid recovery (Fig. 6). Thus, there is a clear association between CD47 and mitochondria transfer–mediated stress erythropoiesis.
To date, most studies on CD47 are restricted to its immunoregulatory functions via interaction with SIRPα from phagocytotic myeloid cells. Nevertheless, CD47 has also been implicated to regulate the metabolic pathway and oxidative stress in specific contexts. For instance, thrombospondin-1 (TSP1), a well-characterized secreted protein with high binding affinity to CD47, has been shown to affect mitochondrial and metabolic processes by acting through CD47, thus modulating cellular responses to inflammation, hypoxic stress, and redox signaling (Miller et al., 2015; Resovi et al., 2014; Roberts and Isenberg, 2021; Soto-Pantoja et al., 2015). Interestingly, CD47-null mice have been shown to have a defective immune system and develop progressive hemolytic anemia as they age (Kim et al., 2018), suggesting a potential function of CD47 in the context of stress erythropoiesis. SIRPα, on the other hand, is the most well-known receptor for CD47, and its close interaction constitutes a cell–cell communication system. In addition, cell–cell contact was commonly observed in the in vitro coculture system among mitochondria transfer events (Fig. 2 F), suggesting that “direct uptake” might be the predominant mode of mitochondria transfer mechanisms in the context of EBIs under stress (Zampieri et al., 2021). Interestingly, blockade of CD47 and/or Sirpα significantly compromised mitochondria transfer frequency both in vivo and in vitro (Fig. 6, F, J and K). These observations may imply the possibility of mitochondria transfer being regulated through CD47–SIRPα mediated cell–cell contacts and/or their downstream signaling and would be an intriguing topic for future investigation.
Furthermore, autologous macrophages have been widely adopted in clinical trial as a cell-based therapy to treat many diseases (Lee et al., 2016). Hence, we postulate that EBI macrophages as a potent erythroid niche may also serve as potential therapeutic agents targeting various types of anemia. For instance, a potential target is Diamond-Blackfan anemia, which is caused by mutations in multiple ribosomal genes (RPS19, RPL5, RPS10, etc.) leading to severe protein synthesis defects (Engidaye et al., 2019; Tyagi et al., 2020), which can potentially be targeted by mitochondria transfer–mediated mechanisms.
In summary, we provided evidence of the supportive role of splenic and BM EBI macrophages in the context of stress erythropoiesis. Our findings shed light on the functional importance of intercellular mitochondria transfer to mediate metabolic profiles of recipient erythroblasts that facilitate their recovery from anemic stress.
Materials and methods
Mice
Mice were in a C57/BL6 background. They were used for experiments at 8–12 wk old. Mito-Dendra2 (B6;129S-Gt[ROSA]26Sortm1.1(CAG-COX8A/Dendra2)Dcc/J) and Rosa26-LSL-tdTomato (B6.Cg-Gt[ROSA]26Sortm14(CAG-tdTomato)Hze/J) mice were obtained from Jackson Laboratory. Rosa26-LSL-tdTomato mice were crossed with Vav-Cre mice to generate tdTomato-Vav-Cre mice. All mice were maintained under experimental protocols approved by the institutional animal care and use committees under the National University of Singapore.
Chemicals and reagents
The following chemicals and reagents were used in this study: PHZ (114715; Sigma-Aldrich), cycloheximide (C4859; Sigma-Aldrich), InVivoMAb anti-mouse/human/rat CD47 (MIAP410; BioXcell), and InVivoMAb anti-mouse CD172a (SIRPα; P84; BioXcell).
Flow cytometry cell sorting and analysis
Procedures of isolation and staining of erythroid populations and EBI macrophages were described previously (Chen et al., 2009; Flygare et al., 2011; Yang et al., 2021). The following antibodies were used for flow cytometric analysis: F4/80 (BM8; BioLegend), Vcam1 (MVCAM.A; BioLegend), CD169 (3D6.112; BioLegend), TER-119 (Ter119; BD Bioscience), CD44 (IM7; BD Bioscience), Sirpα (P84; BioLegend), CD71(C2; BD Bioscience), c-Kit (2B8; Biolegend), Sca-1 (D7; BioLegend), CD4 (RM4-5; BD Bioscience), CD8 (53-6.72; BD Bioscience), B220 (RA3-6B2; BD Bioscience), Gr-1 (RB6-8C5; BD Bioscience), and Mac-1 (M/70; BD Bioscience). For measuring ATP content and proliferation, early erythroblasts were sorted in 96-well plates and measured for luminescence via CellTiter-Glo 2.0 Assay (Promega). Flow cytometric cell sorting was performed using Aria II (BD Biosciences) and analyzed using FlowJo software package (Tree Star).
PHZ treatment and serial blood withdrawal
To generate acute hemolytic anemia, mice were intraperitoneally injected with 40 mg/kg per mice of PHZ (114715; Sigma-Aldrich). As an alternative method to generate acute anemic stress, 400–500 µl of peripheral blood was obtained from the submental vein of the mice (8–12 wk old) for three consecutive days. Peripheral blood was obtained from the superficial temporal vein of mice for total blood count, collected in K2EDTA tubes (BD), and analyzed via the Celltac Alpha veterinary hematology analyzer (Nihon Kohden).
In vitro coculture
Early erythroblasts (ProE and Ery I) were isolated from PHZ-stressed tdTomato-Vav-Cre mice and cocultured with EBI macrophages (F4/80+CD106+CD169+) isolated from mito-Dendra2 mice in StemSpan SFEM II supplemented with M-CSF (PeproTech), EPO (BD Biosciences), and SCF (PeproTech) on poly-D-lysine (Sigma-Aldrich)–coated glass-bottom dishes (MatTek, 35 mm). Live cell imaging was conducted after 3 d of coculture under Zeiss LSM 880 with Airy-scan following the manufacturer’s instructions. Images obtained were analyzed using the Zeiss ZEN software.
Super-resolution imaging
Super-resolution imaging was performed as previously described (Takihara et al., 2019), with modifications. Early erythroblasts were directly sorted onto poly-D-lysine (Sigma-Aldrich)–coated glass-bottom dishes (MatTek, 35 mm). Super-resolution imaging of mitochondria was performed using an LSM 880 with Airyscan (Carl Zeiss). Fluorescence was collected by a Zeiss 100× objective for super-resolution imaging. Images acquired by a 32-Channel GaAsP PMT array Airyscan detector were processed using Airyscan Processing method in ZEN software (Carl Zeiss). Reconstruction of the three-dimensional mitochondrial structure was performed via Imaris 9.2.1 (Bitplane).
Single-cell library construction and sequencing
Mito-Dendra2–labeled early erythroblast (mito+) and control early erythroblasts (mito−) were isolated by FACs. Cell viability was evaluated using trypan blue and a hemocytometer. Samples were prepared for target capture of 6,000 cells. Single cells were subjected to the Chromium Instrument (10x Genomics) to generate single-cell gel beads in emulsion, followed by cDNA synthesis, amplification, and library construction using the Chromium Single Cell 3′ Reagent Kit v3 (10x Genomics) according to the manufacturer’s instructions. The final library was amplified and sequenced using the P5 and P7 primers in a DNBseq at BGI Genomics.
scRNA-seq analysis
Cell Ranger v6.0.0 (10x Genomics) was used to align reads to the prebuilt mm10 reference genome. The R package Seurat v4.0.0 was used for downstream analysis (Hao et al., 2021). Cells were removed if the number of UMIs was <500, the number of genes detected was <100, or ≥10% of reads were mapped to mitochondrial genes. Read counts were normalized using the Seurat SCTransform function. In the normalization, variation due to mitochondrial RNA ratio and cell cycle phase scores were regressed out. The data from mito-Dendra2+ and control samples were integrated based on the 3,000 most highly variable genes using the Seurat integration procedure. Principal component analysis was performed using the Seurat RunPCA function. The top 40 principal components were used for uniform manifold approximation and projection (UMAP), followed by cell clustering. Marker genes for each cluster were identified using the Seurat FindConservedMarkers function. Clusters were annotated by comparing the marker genes to known cell-type markers from literature. Differentially expressed genes between samples were estimated using the Seurat FindAllMarkers function.
Protein synthesis assay
Analysis of in vivo protein synthesis rate was performed as previously described (Tan et al., 2019). In short, mice were administered 50 mg/kg OP-Puro (MedChemExpress) intraperitoneally and euthanized exactly 1 h later. BM and spleen cells were harvested, treated with Fixable Viability Dye eFluor780 (eBioscience), and labeled with cell-surface marker antibodies, as described above. Cells were then fixed and permeabilized using IntraPrep Permeabilization Reagent (Beckman Coulter). OP-Puro was subsequently detected using the Click-iT Plus OPP Protein Synthesis Assay Kit (Thermo Fisher Scientific) according to manufacturer’s instructions.
Seahorse analysis
Seahorse analysis was performed, as described previously (Nakamura-Ishizu et al., 2018), with modifications. Briefly, early erythroblasts were isolated into SFEM medium and were subsequently cultured at 37°C for 1 h. Next, cells were washed and resuspended in Agilent Seahorse XF Base Medium and plated onto Seahorse XF culture plate coated with Cell-Tak reagent according to the manufacturer’s protocol. Cells were then immobilized and subsequently treated with 1.5 µm of oligomycin, 2 µm of FCCP, and 0.5 µm of rotenone/antimycin for analysis of mitochondrial respiration. OCR was measured by Seahorse XFe24 Analyzer (Seahorse Biosciences).
RNA extraction and quantitative PCR
RNA extraction and qPCR were performed as described previously (Yang et al., 2021) The following primers were used: mRpl28-F, 5′-CGCCTCTCGTGTCTCTCTTT-3′; mRpl28-R, 5′-CAGTTCCGGACGACCATC-3′; mEif4a1-F, 5′-GGATCATGTCTGCGAGTCAG-3′; mEif4a1-R, 5′-GCTATCCACAATCTCGTTCCA-3′; mAtp5g1-F, 5′-GGCACTGCTCATTTCTCCAG-3′; mAtp5g1-R, 5′-CAGGAAGGCTGCTTAGATGG-3′; mAtp5o-F, 5′-TCAGGTCTACGGCATCGAA-3′; mAtp5o-R, 5′-CTTTGGGGTCCTTCAGGAGT-3′; mAtp6v0b-F, 5′-TGGCCATCTATGGCATCAT-3′; mAtp6v0b-R, 5′-CAGCCCCAAACATGGAGTAA-3′; mSirpa-F, 5′-GCTTCGTCACGATGGGTCT-3′; mSirpa-R, 5′-AGCTCAGGCATCTCCTCTTG-3′; mGapdh-F, 5′-CTTTGTCAAGCTCATTTCCTGG-3′; mGapdh-R, 5′-TCTTGCTCAGTGTCCTTGC-3′.
Statistical analysis
All experiments were performed at least three times independently under similar conditions. Statistical significance was calculated using two-tailed unpaired t tests as indicated in the figure legends. Statistical significance is represented using the following symbols: ns, P > 0.05; *, P ≤ 0.05; **, P ≤ 0.01; ***, P ≤ 0.001; ****, P ≤ 0.0001.
Online supplemental material
Fig. S1 shows the gating strategy for various erythroid populations in the spleen and BM, as well as the kinetics of erythroid regeneration and mitochondria transfer after EBI macrophage infusion. Fig. S2 shows the characterization of mitochondria transfer events via flow cytometry and confocal microscopy analysis. Figs. S3 and S4 show scRNA-seq and GO analysis of BM and spleen-specific erythroid populations. Fig. S5 shows in vitro validation of mitochondria transfer function, Cd47/Sirpα expression in hematopoietic cells, as well as the characterization of mitochondria transfer in the bleeding model.
Acknowledgments
The authors thank Dr. Desmond Chin for advice and suggestions on this work. We also would like to thank Dr. Lai Lai Yap, Shu Ying Lee, Micelle Mok, Fion Lai, and Fiona Chia for technical assistance.
T. Suda is supported by the Singapore Translational Research Investigator Award from the National Medical Research Council in Singapore (NMRC/STaR 18 may-0004) and in part by a JSPS KAKENHI Grant-in-Aid for Scientific Research (S; grant no. 26221309). C. Yang is supported by the Open Fund-Young Individual Research Grant from the National Medical Research Council in Singapore (OFYIRG19may-0009).
Author contributions: T. Suda and C. Yang conceived the study, designed the experiments, and wrote the manuscript. R. Yokomori performed scRNA-seq analyses. L.H. Chua assisted in animal breeding and experiments. S.H. Tan and D.Q. Tan assisted in experiments and participated in the discussion and writing of manuscripts. K. Miharada and T. Sanda participated in the writing of manuscript, discussion, and analysis of experiments. All authors read and approved the final manuscript.
Data availability
The scRNA-seq data that support the findings of this study have been deposited in the Gene Expression Omnibus under accession codes GSE185267. All other data supporting the findings of this study are available from the corresponding author upon reasonable request.
References
- Angulo, O., Gandrillon O., and Crauste F.. 2018. Investigating the role of the experimental protocol in phenylhydrazine-induced anemia on mice recovery. J. Theor. Biol. 437:286–298. 10.1016/j.jtbi.2017.10.031 [DOI] [PubMed] [Google Scholar]
- Chasis, J.A., and Mohandas N.. 2008. Erythroblastic islands: Niches for erythropoiesis. Blood. 112:470–478. 10.1182/blood-2008-03-077883 [DOI] [PMC free article] [PubMed] [Google Scholar]
- Chen, E.Y., Tan C.M., Kou Y., Duan Q., Wang Z., Meirelles G.V., Clark N.R., and Ma’ayan A.. 2013. Enrichr: Interactive and collaborative HTML5 gene list enrichment analysis tool. BMC Bioinf. 14:128. 10.1186/1471-2105-14-128 [DOI] [PMC free article] [PubMed] [Google Scholar]
- Chen, K., Liu J., Heck S., Chasis J.A., An X., and Mohandas N.. 2009. Resolving the distinct stages in erythroid differentiation based on dynamic changes in membrane protein expression during erythropoiesis. Proc. Natl. Acad. Sci. USA. 106:17413–17418. 10.1073/pnas.0909296106 [DOI] [PMC free article] [PubMed] [Google Scholar]
- Engidaye, G., Melku M., and Enawgaw B.. 2019. Diamond blackfan anemia: Genetics, pathogenesis, diagnosis and treatment. EJIFCC. 30:67–81 [PMC free article] [PubMed] [Google Scholar]
- Flygare, J., Rayon Estrada V., Shin C., Gupta S., and Lodish H.F.. 2011. HIF1alpha synergizes with glucocorticoids to promote BFU-E progenitor self-renewal. Blood. 117:3435–3444. 10.1182/blood-2010-07-295550 [DOI] [PMC free article] [PubMed] [Google Scholar]
- Fujioka, Y., Matozaki T., Noguchi T., Iwamatsu A., Yamao T., Takahashi N., Tsuda M., Takada T., and Kasuga M.. 1996. A novel membrane glycoprotein, SHPS-1, that binds the SH2-domain-containing protein tyrosine phosphatase SHP-2 in response to mitogens and cell adhesion. Mol. Cell. Biol. 16:6887–6899. 10.1128/MCB.16.12.6887 [DOI] [PMC free article] [PubMed] [Google Scholar]
- Gonzalez-Ibanez, A.M., Ruiz L.M., Jensen E., Echeverria C.A., Romero V., Stiles L., Shirihai O.S., and Elorza A.A.. 2020. Erythroid differentiation and heme biosynthesis are dependent on a shift in the balance of mitochondrial fusion and fission dynamics. Front. Cell Dev. Biol. 8:592035. 10.3389/fcell.2020.592035 [DOI] [PMC free article] [PubMed] [Google Scholar]
- Hao, Y., Hao S., Andersen-Nissen E., Mauck W.M. 3rd, Zheng S., Butler A., Lee M.J., Wilk A.J., Darby C., Zager M., et al. 2021. Integrated analysis of multimodal single-cell data. Cell. 184:3573–3587.e29. 10.1016/j.cell.2021.04.048 [DOI] [PMC free article] [PubMed] [Google Scholar]
- Hara, H., and Ogawa M.. 1976. Erthropoietic precursors in mice with phenylhydrazine-induced anemia. Am. J. Hematol. 1:453–458. 10.1002/ajh.2830010410 [DOI] [PubMed] [Google Scholar]
- Kim, J.I., Park J.S., Kwak J., Lim H.J., Ryu S.K., Kwon E., Han K.M., Nam K.T., Lee H.W., and Kang B.C.. 2018. CRISPR/Cas9-mediated knockout of CD47 causes hemolytic anemia with splenomegaly in C57BL/6 mice. Lab. Anim. Res. 34:302–310. 10.5625/lar.2018.34.4.302 [DOI] [PMC free article] [PubMed] [Google Scholar]
- Kuleshov, M.V., Jones M.R., Rouillard A.D., Fernandez N.F., Duan Q., Wang Z., Koplev S., Jenkins S.L., Jagodnik K.M., Lachmann A., et al. 2016. Enrichr: A comprehensive gene set enrichment analysis web server 2016 update. Nucleic Acids Res. 44:W90–W97. 10.1093/nar/gkw377 [DOI] [PMC free article] [PubMed] [Google Scholar]
- Lee, S., Kivimäe S., Dolor A., and Szoka F.C.. 2016. Macrophage-based cell therapies: The long and winding road. J. Contr. Release. 240:527–540. 10.1016/j.jconrel.2016.07.018 [DOI] [PMC free article] [PubMed] [Google Scholar]
- Leimberg, M.J., Prus E., Konijn A.M., and Fibach E.. 2008. Macrophages function as a ferritin iron source for cultured human erythroid precursors. J. Cell. Biochem. 103:1211–1218. 10.1002/jcb.21499 [DOI] [PubMed] [Google Scholar]
- Li, W., Wang Y., Zhao H., Zhang H., Xu Y., Wang S., Guo X., Huang Y., Zhang S., Han Y., et al. 2019. Identification and transcriptome analysis of erythroblastic island macrophages. Blood. 134:480–491. 10.1182/blood.2019000430 [DOI] [PMC free article] [PubMed] [Google Scholar]
- Liao, C., Prabhu K.S., and Paulson R.F.. 2018. Monocyte-derived macrophages expand the murine stress erythropoietic niche during the recovery from anemia. Blood. 132:2580–2593. 10.1182/blood-2018-06-856831 [DOI] [PMC free article] [PubMed] [Google Scholar]
- McGrath, J.P. 1993. Assessment of hemolytic and hemorrhagic anemias in preclinical safety assessment studies. Toxicol. Pathol. 21:158–163. 10.1177/019262339302100207 [DOI] [PubMed] [Google Scholar]
- Miller, T.W., Soto-Pantoja D.R., Schwartz A.L., Sipes J.M., DeGraff W.G., Ridnour L.A., Wink D.A., and Roberts D.D.. 2015. CD47 receptor globally regulates metabolic pathways that control resistance to ionizing radiation. J. Biol. Chem. 290:24858–24874. 10.1074/jbc.M115.665752 [DOI] [PMC free article] [PubMed] [Google Scholar]
- Moras, M., Lefevre S.D., and Ostuni M.A.. 2017. From erythroblasts to mature red blood cells: Organelle clearance in mammals. Front. Physiol. 8:1076. 10.3389/fphys.2017.01076 [DOI] [PMC free article] [PubMed] [Google Scholar]
- Moschoi, R., Imbert V., Nebout M., Chiche J., Mary D., Prebet T., Saland E., Castellano R., Pouyet L., Collette Y., et al. 2016. Protective mitochondrial transfer from bone marrow stromal cells to acute myeloid leukemic cells during chemotherapy. Blood. 128:253–264. 10.1182/blood-2015-07-655860 [DOI] [PubMed] [Google Scholar]
- Nakamura-Ishizu, A., Matsumura T., Stumpf P.S., Umemoto T., Takizawa H., Takihara Y., O'Neil A., Majeed A.B.B.A., MacArthur B.D., and Suda T.. 2018. Thrombopoietin metabolically primes hematopoietic stem cells to megakaryocyte-lineage differentiation. Cell Rep. 25:1772–1785.e6. 10.1016/j.celrep.2018.10.059 [DOI] [PubMed] [Google Scholar]
- Oldenborg, P.A. 2004. Role of CD47 in erythroid cells and in autoimmunity. Leuk. Lymphoma. 45:1319–1327. 10.1080/1042819042000201989 [DOI] [PubMed] [Google Scholar]
- Palis, J. 2014. Primitive and definitive erythropoiesis in mammals. Front. Physiol. 5:3. 10.3389/fphys.2014.00003 [DOI] [PMC free article] [PubMed] [Google Scholar]
- Pham, A.H., McCaffery J.M., and Chan D.C.. 2012. Mouse lines with photo-activatable mitochondria to study mitochondrial dynamics. Genesis. 50:833–843. 10.1002/dvg.22050 [DOI] [PMC free article] [PubMed] [Google Scholar]
- Resovi, A., Pinessi D., Chiorino G., and Taraboletti G.. 2014. Current understanding of the thrombospondin-1 interactome. Matrix Biol. 37:83–91. 10.1016/j.matbio.2014.01.012 [DOI] [PubMed] [Google Scholar]
- Roberts, D.D., and Isenberg J.S.. 2021. CD47 and thrombospondin-1 regulation of mitochondria, metabolism, and diabetes. Am. J. Physiol. Cell Physiol. 321:C201–C213. 10.1152/ajpcell.00175.2021 [DOI] [PMC free article] [PubMed] [Google Scholar]
- Russ, A., Hua A.B., Montfort W.R., Rahman B., Riaz I.B., Khalid M.U., Carew J.S., Nawrocki S.T., Persky D., and Anwer F.. 2018. Blocking “don't eat me” signal of CD47-SIRPα in hematological malignancies, an in-depth review. Blood Rev. 32:480–489. 10.1016/j.blre.2018.04.005 [DOI] [PMC free article] [PubMed] [Google Scholar]
- Seiffert, M., Cant C., Chen Z., Rappold I., Brugger W., Kanz L., Brown E.J., Ullrich A., and Bühring H.J.. 1999. Human signal-regulatory protein is expressed on normal, but not on subsets of leukemic myeloid cells and mediates cellular adhesion involving its counterreceptor CD47. Blood. 94:3633–3643. 10.1182/blood.v94.11.3633.423k01_3633_3643 [DOI] [PubMed] [Google Scholar]
- Seita, J., Sahoo D., Rossi D.J., Bhattacharya D., Serwold T., Inlay M.A., Ehrlich L.I.R., Fathman J.W., Dill D.L., and Weissman I.L.. 2012. Gene expression commons: An open platform for absolute gene expression profiling. PloS One. 7:e40321. 10.1371/journal.pone.0040321 [DOI] [PMC free article] [PubMed] [Google Scholar]
- Seu, K.G., Papoin J., Fessler R., Hom J., Huang G., Mohandas N., Blanc L., and Kalfa T.A.. 2017. Unraveling macrophage heterogeneity in erythroblastic islands. Front. Immunol. 8:1140. 10.3389/fimmu.2017.01140 [DOI] [PMC free article] [PubMed] [Google Scholar]
- Shahbazian, D., Parsyan A., Petroulakis E., Topisirovic I., Martineau Y., Gibbs B.F., Svitkin Y., and Sonenberg N.. 2010. Control of cell survival and proliferation by mammalian eukaryotic initiation factor 4B. Mol. Cell. Biol. 30:1478–1485. 10.1128/MCB.01218-09 [DOI] [PMC free article] [PubMed] [Google Scholar]
- Soto-Pantoja, D.R., Kaur S., and Roberts D.D.. 2015. CD47 signaling pathways controlling cellular differentiation and responses to stress. Crit. Rev. Biochem. Mol. Biol. 50:212–230. 10.3109/10409238.2015.1014024 [DOI] [PMC free article] [PubMed] [Google Scholar]
- Takihara, Y., Nakamura-Ishizu A., Tan D.Q., Fukuda M., Matsumura T., Endoh M., Arima Y., Chin D.W.L., Umemoto T., Hashimoto M., et al. 2019. High mitochondrial mass is associated with reconstitution capacity and quiescence of hematopoietic stem cells. Blood Adv. 3:2323–2327. 10.1182/bloodadvances.2019032169 [DOI] [PMC free article] [PubMed] [Google Scholar]
- Tan, D.Q., Li Y., Yang C., Li J., Tan S.H., Chin D.W.L., Nakamura-Ishizu A., Yang H., and Suda T.. 2019. PRMT5 modulates splicing for genome integrity and preserves proteostasis of hematopoietic stem cells. Cell Rep. 26:2316–2328.e6. 10.1016/j.celrep.2019.02.001 [DOI] [PubMed] [Google Scholar]
- Torralba, D., Baixauli F., and Sánchez-Madrid F.. 2016. Mitochondria know No boundaries: Mechanisms and functions of intercellular mitochondrial transfer. Front. Cell Dev. Biol. 4:107. 10.3389/fcell.2016.00107 [DOI] [PMC free article] [PubMed] [Google Scholar]
- Tyagi, A., Gupta A., Dutta A., Potluri P., and Batti B.. 2020. A review of diamond-blackfan anemia: Current evidence on involved genes and treatment modalities. Cureus. 12:e10019. 10.7759/cureus.10019 [DOI] [PMC free article] [PubMed] [Google Scholar]
- Vadivel Gnanasundram, S., and Fåhraeus R.. 2018. Translation stress regulates ribosome synthesis and cell proliferation. Int. J. Mol. Sci. 19:3757. 10.3390/ijms19123757 [DOI] [PMC free article] [PubMed] [Google Scholar]
- Xie, Z., Bailey A., Kuleshov M.V., Clarke D.J.B., Evangelista J.E., Jenkins S.L., Lachmann A., Wojciechowicz M.L., Kropiwnicki E., Jagodnik K.M., et al. 2021. Gene set knowledge discovery with Enrichr. Curr. Protoc. 1:e90. 10.1002/cpz1.90 [DOI] [PMC free article] [PubMed] [Google Scholar]
- Yang, C., Endoh M., Tan D.Q., Nakamura-Ishizu A., Takihara Y., Matsumura T., and Suda T.. 2021. Mitochondria transfer from early stages of erythroblasts to their macrophage niche via tunnelling nanotubes. Br. J. Haematol. 193:1260–1274. 10.1111/bjh.17531 [DOI] [PubMed] [Google Scholar]
- Yang, C., Hashimoto M., Lin Q.X.X., Tan D.Q., and Suda T.. 2019. Sphingosine-1-phosphate signaling modulates terminal erythroid differentiation through the regulation of mitophagy. Exp. Hematol. 72:47–59.e1. 10.1016/j.exphem.2019.01.004 [DOI] [PubMed] [Google Scholar]
- Zampieri, L.X., Silva-Almeida C., Rondeau J.D., and Sonveaux P.. 2021. Mitochondrial transfer in cancer: A comprehensive review. Int. J. Mol. Sci. 22:3245. 10.3390/ijms22063245 [DOI] [PMC free article] [PubMed] [Google Scholar]
Associated Data
This section collects any data citations, data availability statements, or supplementary materials included in this article.
Data Availability Statement
The scRNA-seq data that support the findings of this study have been deposited in the Gene Expression Omnibus under accession codes GSE185267. All other data supporting the findings of this study are available from the corresponding author upon reasonable request.


