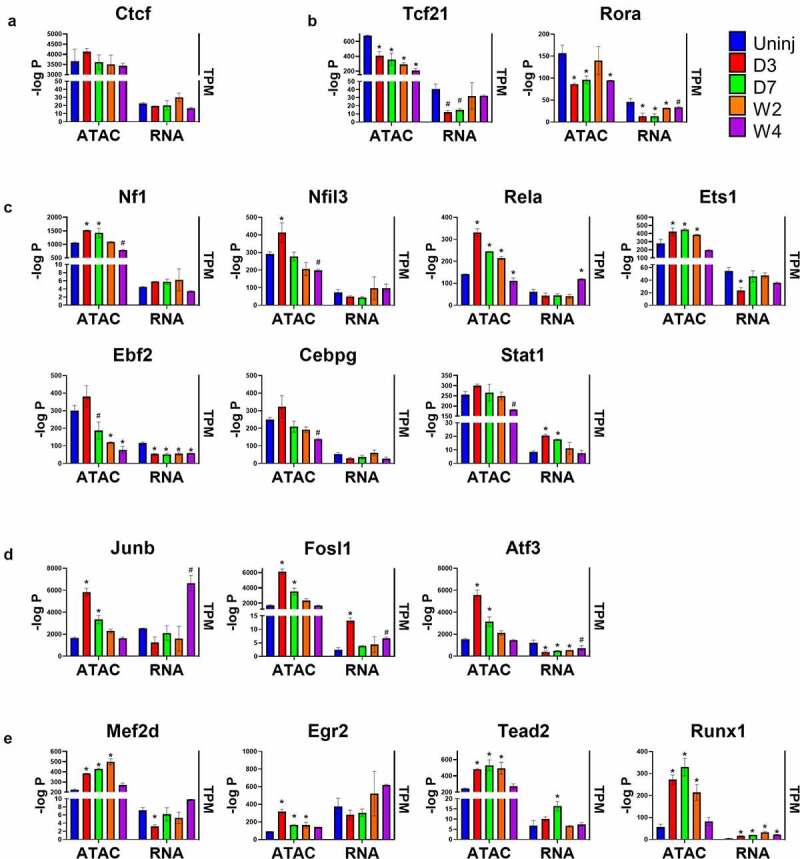
Figure 6.

Identification of TF motifs in distal ATAC-seq peaks.
(a-d) The enrichment-log P values of some most-enriched motifs in ATAC-seq peaks and the mRNA expression levels (TPM) of the corresponding TFs in Tcf21 lineage-traced cardiac fibroblasts isolated from the uninjured myocardium and infarct regions at different time points after MI. Motifs were divided into uniformly enriched across all groups (a), more enriched in quiescent cardiac fibroblasts (b), more enriched in myofibroblasts (c-d), and more enriched in both myofibroblasts and matrifibrocytes (e). Data are shown as mean ± SEM (n = 2). #P < 0.1, *P < 0.05 vs uninjured, one-way ANOVA with multiple comparisons. Uninj, uninjured; D3, day 3; D7, day 7; W2, week 2; W4, week 4.
