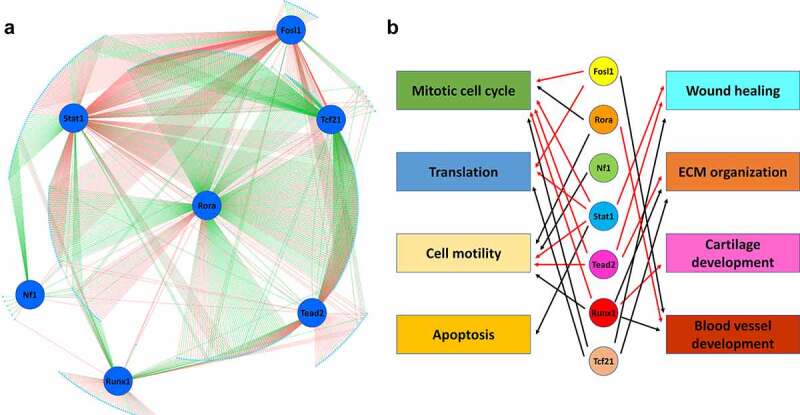
Figure 9.

Gene regulatory network in cardiac fibroblasts.
(a) Top 500 most differentially expressed genes (cyan dots) among cardiac fibroblasts in different states with at least one of the 7 motifs (Fosl1, Rora, Stat1, Nf1, Tead2, Runx1, and Tcf21; blue circles) identified in the ATAC-seq peaks ± 100 kb of their TSSs were selected for gene regulatory network (GRN) construction. Red lines indicate positive regulation. Green lines indicate negative regulation. (b) Possible functions of TFs based on GO enrichment analysis of genes positively or negatively regulated by individual TFs. Red arrows indicate positive regulation. Black arrows indicate negative regulation.
