Abstract
Purpose:
The purpose of this study was to access the ability of the natural PPAR agonist, eicosapentaenoic acid (EPA), to activate PPAR gamma (γ) signaling leading to meibocyte differentiation in human meibomian gland epithelial cell (hMGEC).
Methods:
HMGEC were exposed to EPA, alone and in combination with the specific PPARγ antagonist, T0070907, to selectively block PPARγ signaling. Expression of PPARγ response genes were evaluated by qPCR. Effect on cell cycle was evaluated using Ki-67 labelling and western blots. During differentiation, autophagy was monitored using the Autophagy Tandem Sensor (ATS) and LysoTracker. Lipid accumulation was characterized by Stimulated Raman Scattering microscopy (SRS) and neutral lipid staining in combination with ER-Tracker, LysoTracker, and ATS. Autophagy was also investigated using western blotting. Seahorse XF analysis was performed to monitor mitochondrial function.
Results:
EPA specifically upregulated expression of genes related to lipid synthesis and induced cell cycle exit through reduced cyclin D1 expression and increased p21 and p27 expression. EPA also induced accumulation of lipid droplets in a time and dose dependent manner (P < 0.05) by specific PPARγ signaling. Lipid analysis identified both de novo synthesis and extracellular transport of lipid to form lipid droplets that were localized to the ER. PPARγ signaling also induced activation of AMPK-ULK1 signaling and autophagy, while inhibition of autophagy induced mitochondrial crisis with no effect on lipid accumulation.
Conclusions:
EPA induces meibocyte differentiation through PPARγ activation that is characterized by cell cycle exit, de novo and transported lipid accumulation in the ER, and autophagy.
Keywords: PPARγ, Cell cycle exit, Autophagy, Meibocyte, Human meibomian gland epithelial cell
1. Introduction
Over the past several decades, increased interest has focused on meibomian gland dysfunction (MGD) as being the cause of an evaporative dry eye disease (EDED) that commonly afflicts older individuals [1] and patients on Accutane therapy [2]. EDED patients exhibit shortened tear film break-up time, increased tear osmolarity, and corneal epithelial damage and inflammation leading to symptoms of chronic pain and discomfort that is thought to be due to the loss or atrophy of the meibomian glands with altered quantity or quality of the lipid (meibum) excretions in the presence of a normal functioning lacrimal gland [2]. Despite heightened interest in EDED and MGD, our knowledge regarding the molecular and cellular mechanisms controlling meibocyte differentiation and holocrine secretion are limited.
Past studies have shown that during aging in the human and mouse meibomian gland there is a significant decrease in the expression and post-translational modification of the lipid sensitive nuclear receptor, peroxisome proliferator activated receptor gamma (PPARγ) [3,4]. While PPARγ is ubiquitously expressed in many cell types, it is known to play a critical role in lipid synthesis and storage in adipocytes and sebocytes [5–7]. During meibomian gland morphogenesis, expression of PPARγ coincides with the initial synthesis of lipid around post-natal day 3 [8]. Furthermore, PPARγ activation by the synthetic agonist, rosiglitazone, is associated with up-regulation of PPARγ response genes, PPARγ sumoylation, and cytoplasmic export leading to lipid accumulation in both cultured human and mouse acinar cells or meibocytes [9–11]. These observations suggest that PPARγ plays an important role in the differentiation and holocrine secretion of the meibomian gland.
Although a synthetic agonist was useful to investigate the role of PPARγ signaling, endogenous ligands may have broader specificity and activity. Unfortunately, endogenous ligands for PPARγ signaling of the meibomian gland have not been identified, although various fatty acid derivatives including eicosanoids have shown to have the ability to enhance lipid production by meibocytes in culture [12]. In this study, we hypothesized that Eicosapentaenoic acid (EPA), which belongs to omega-3 fatty acids, could serve as a PPARγ ligand in immortalized human meibomian gland epithelial cells (hMGEC). Since previous studies have shown that dietary supplementation of omega-3 fatty acids improved signs and symptoms of dry eye disease including changes in meibum quality [13,14], investigating the effect of EPA on PPARγ signaling and lipid synthesis in meibocytes would be valuable.
In this report, we establish that the natural PPARγ ligand, EPA, similar to the synthetic agonist, rosiglitazone, induces cell cycle exit mediated by decreased expression of cyclin D1 and increased expression of p21 and p27. Furthermore, both agonists lead to the accumulation of lipid that is synthesized de novo and/or transported to lipid droplets within the smooth endoplasmic reticulum (ER). PPARγ agonist also enhance autophagolysosome formation that appears critical for the maintenance of mitochondrial function and potentially meibocyte disintegration. Together these findings support the hypothesis that PPARγ signaling controls meibocyte differentiation and lipid secretion in the meibomian gland.
2. Materials and methods
2.1. Cultivation and differentiation of meibocytes
Immortalized human meibomian gland epithelial cells (hMGEC), a generous gift from Dr. Sullivan (Schepens Eye Research Institute), were grown in Keratinocyte Serum Free Media (KSFM, Invitrogen-Gibco, Grand Island, NY) as previously described [10]. At 80% confluence, differentiation was induced by culturing cells in DMEM-F12 (Gibco, Grand Island, NY) supplemented with Epidermal Growth Factor (EGF, 10 ng/ml, Sigma) and Bovine serum albumin (fatty acid free-BSA, 3 mg/ml, Sigma) with or without PPARγ agonist, rosiglitazone (30 μM, Sigma, St. Louis, MO) or EPA (20–50 μM, Sigma). EPA stock was prepared as a solution in ethanol and aliquoted at −20 °C in tightly sealed vials in the dark. Further dilutions of the stock solution into prewarmed DMEM/F12 media containing fatty acid free albumin was made prior to media change and a fresh preparation is used for experiments. For PPARγ signaling studies, a specific PPARγ antagonist, 10 μM of T0070907 (Tocris, Minneapolis, MN) was added 1 h prior to EPA treatment.
2.2. RNA isolation and lipogenic gene expression
The expression of 4 PPARγ lipogenic response genes were evaluated including Perilipin 2 (PLIN2, NM_001122), elongation of very long chain fatty acid 4 (ELOVL4, NM_022726), peroxisome proliferator activated receptor gamma (PPARγ, NM_138712), and Sterol O-acyl-transferase (SOAT1, NM_001252511). Expression was measured using the quantitative real-time PCR as previously reported [10]. Relative quantification was performed using the Comparative Ct method using GAPDH as the normalizing housekeeper gene.
2.3. Assessment of cell cycling and lipid production
For immunostaining, hMGEC were cultured on glass coverslips precoated with 10% bovine collagen I (Purecol, Advanced BioMatrix, Carlsbad, CA). After achieving 80% confluence, cells were exposed to 50 μM EPA for 4–6 days and then fixed in 2% paraformaldehyde. Cells were then stained with antibodies to Ki67 (Abcam, Cambridge, MA) to determine the effect of EPA on cell cycling, and LipidTox (Invitrogen, Carlsbad, CA) to assess lipid synthesis as previously described [8].
2.4. Protein extraction and western blotting
Cells were lysed on ice using the Pro-prep™ protein extraction kit (Intron Biotechnology, Korea), and expression of cell cycle mediators and autophagy related signaling molecules were evaluated using western blots. Briefly, 20 μg of protein lysates was resolved by 8–15% sodium dodecyl sulfate polyacrylamide gel electrophoresis and transferred to a PVDF membrane (Invitrogen). The membrane was blocked for 1 h in PBS containing 5% BSA and 0.2% Tween-20 and incubated overnight with primary antibodies. The following primary antibodies were purchased from Cell Signaling Technologies (Danvers, MA, USA): Cyclin D1 (Cat# 2978, 1:1000 dilution), P27/Kip1 (Cat# 3686, 1:1000), P21 Waf1/Cip1 (Cat# 2947, 1:1000), AMPKα (Cat#5832, 1:1000), Phospho-AMPKα (Cat#50081, 1:500), ULK1 (Cat#8054, 1:500), Phospho-ULK1(Ser555, Cat#5869, 1:500), while antibodies to LC3B were purchased from Invitrogen (Cat# PA1–16930, 1:1000). Antibody-reactive proteins were detected by means of the appropriate HRP-conjugated secondary antibodies and an enhanced chemiluminescent substrate (SuperSignal West Pico Chemiluminescent Substrate, Thermo Scientific). Immunostained bands were analyzed using ChemiDoc MP (Bio-Rad) and relative quantitation was done after normalization to GAPDH band in same blots.
2.5. Live imaging of ER, lysosome, autophagosome, and lipid droplets
To explore intracellular localization of lipid droplets with subcellular organelles, after differentiation with rosiglitazone or EPA, lipid droplets were co-stained with BODIPY 493/503 and ER-Tracker or LysoTracker following the manufacture’s (Molecular Probes) instruction. To monitor autophagic flux, hMGECs were transduced with the Premo Autophagy Tandem Sensor RFP-GFP-LC3B kit (Molecular Probes, Cat# P36239) and lipid droplets were stained with Lipi-blue (Dojindo Molecular Technologies, Rockville, MD). Briefly, hMGECs were seeded at 40,000 cells onto 35 mm glass bottom culture dishes, grown to 70% confluence and transduced with LC3B reagent followed by 48 h of incubation before imaging. This tandem RFP-GFP sensor capitalizes on the pH difference between the acidic autolysosome and the neutral autophagosome and the pH sensitivity differences exhibited by GFP (green fluorescent protein) and RFP (red fluorescent protein) to monitor progression from the autophagosome (both green and red) to autolysosome (red). Intracellular green and red dots were counted in 50 cells and an average count per cell was analyzed for relative fraction of autolysosome for analysis of autophagic flux.
2.6. Stimulated Raman spectroscopic analysis of meibocyte lipids
Stimulated Raman Scattering (SRS) microscopy was used to assess the chemical content of lipid droplets and overall lipid distribution in cultured cells [15]. Cells were seeded onto 35 mm glass bottom well plates and after reaching 80% confluence were exposed to 50 μM EPA or 30 μM Rosi for 5 days. Cells were then washed and fixed with 2% paraformaldehyde. After fixation, cell samples were imaged with a homebuilt SRS microscope discussed in detail in previous works [16,17].
Each sample was kept in saline buffer prior to and during imaging. Images were acquired with 10 μs pixel dwell times and with 10 averages to improve signal-to-noise. Once a region of the samples with many cells was identified, hyperspectral data was acquired by tuning the Raman frequencies across the 2800 cm−1 – 3050 cm−1 spectral range, the relevant range for carbon-hydrogen stretching modes. Each image in a hyperspectral stack represents the signal produced at that mode, thus the stack represents a three-dimensional data array with two spatial dimensions and one spectral dimension. Multiple image stacks were acquired from different areas of each culture sample. Image analysis was carried out in Fiji and spectral data was analyzed using Origin and Matlab [18].
2.7. Statistical analysis
All numeric results are reported as mean ± standard error. Differences between groups were assessed by Kruskal-Wallis one-way analysis of variance on ranks and Tukey multiple comparisons (Sigma Stat version 4.0, Systat Software Inc, Point Richmond, CA). All experiments were repeated at least 3 times and a P value of < 0.05 was considered statistically significant.
3. Results
3.1. EPA induced upregulation of lipogenic genes by activating PPARγ signaling
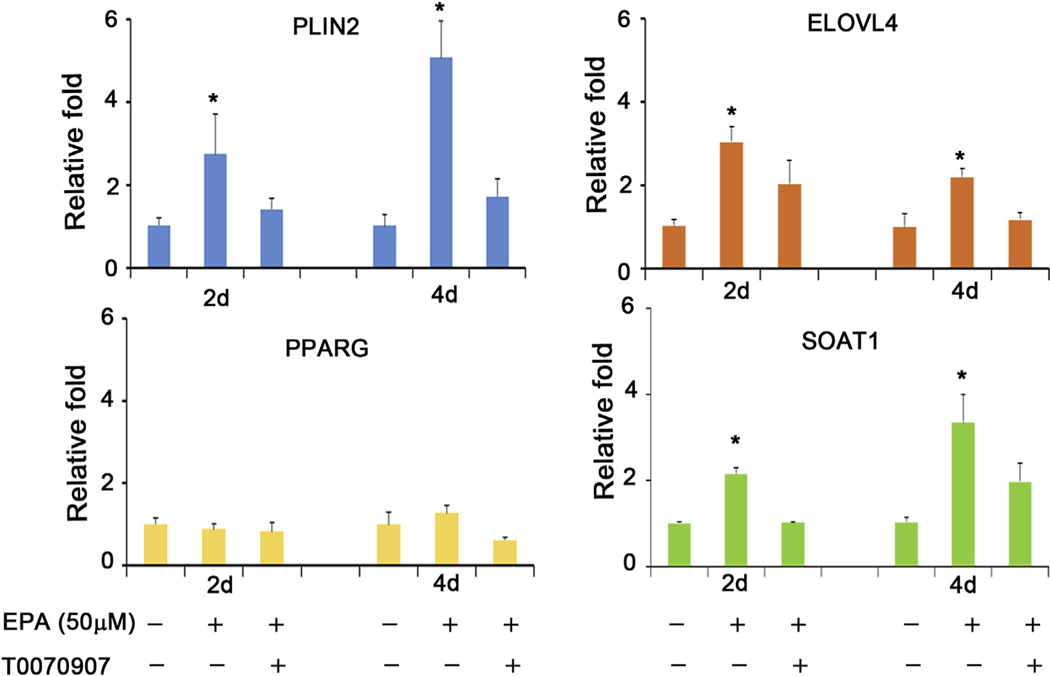
Previously we have shown that the specific, synthetic PPARγ agonist, rosiglitazone (Rosi), upregulates the expression of PPARγ response genes related to lipid synthesis at the transcriptional level [10,11]. In this experiment, we evaluated the effects of EPA, a potential PPARα, β/δ, γ agonist, on expression of PPARγ response genes. As shown in Fig. 1, EPA significantly upregulated mRNAs in hMGEC encoding PLIN2 (Fig. 1A), ELOVL4 (Fig. 1B), and SOAT1 (Fig. 1D) by 2.7, 3.0, and 2.1 folds on average after 2 days, respectively and by 4.7, 2.4, and 3.2 folds after 4 days, respectively, which was blocked by the addition of the PPARγ antagonist, T0070907 (*: P < 0.05).
Fig. 1.
Effect of PPARγ signaling on mRNA expressions of PLIN2, ELOVL4, PPARG, and SOAT1 in hMGEC (A-D). EPA significantly upregulated expression of (A) PLIN2, (B) ELOVL4, and (D) SOAT1 by 2.7, 3.0, and 2.1 folds on average after 2 days, and by 4.7, 2,4, and 3.2 folds after 4 days, respectively (*: P < 0.05) in hMGEC. A PPARγ antagonist T0070907 significantly abrogated EPA-induced upregulation of these genes to the similar level with control group.(C) PPARG mRNA expression was not significantly altered by EPA treatment.
3.2. EPA and rosiglitazone induced cell cycle exit of meibocytes
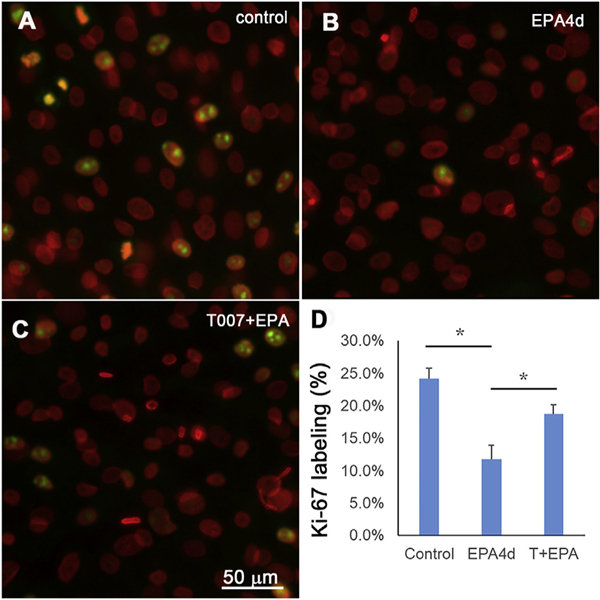
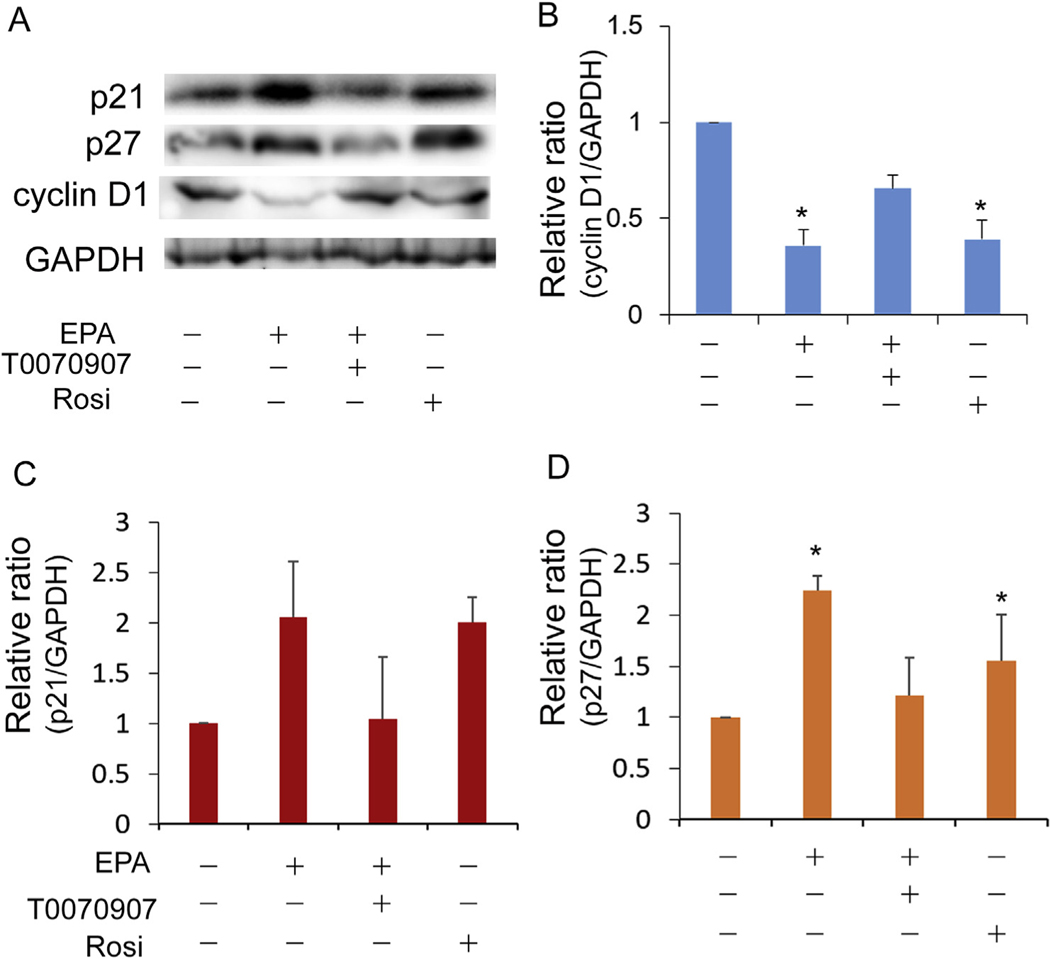
To evaluate whether EPA induces cell cycle exit similar to that previously observed for the specific synthetic PPARγ agonist we first examined Ki-67 labelling after treatment of EPA. Ki-67 is a nuclear protein that is marker of cells undergoing cell division [19,20]. As shown in Fig. 2, about 24% of hMGECs cultured in control, differentiation media containing DMEM/F12 with EGF showed positive labelling by Ki-67 (Fig. 2A). By comparison, cells treated with EPA showed significantly reduced Ki-67 labelling after 4 days in culture (Fig. 2B), and this effect was significantly reversed by the addition of the specific PPARγ antagonist, T0070907 (Fig. 2C). Together these data (Fig. 2D) indicate that EPA induces cell cycle exit mediated by PPARγ receptor signaling, a similar finding to that of the synthetic PPARγ agonist, Rosi [10]. To further confirm the effect of EPA on cell cycle exit, the effect of EPA on the expression of cell cycle proteins was investigated using western blotting (Fig. 3A). Both EPA and Rosi significantly decreased the expression of Cyclin D1 (Fig. 3B, P < 0.05) and increased expression of p27/Kip1 (Fig. 3D, P < 0.05), effects that were reversed by the addition of the specific PPARγ antagonist, T007.
Fig. 2.
Effect of EPA on Ki-67 labeling in cultured hMGEC. (A) Control cells, which were grown in DMEM/F12 with EGF for 4d showed about 24% positive labeling (green) and (B) EPA treatment induced a significant reduction of Ki67 labeling. (C) Co-treatment of PPARγ antagonist T0070907 with EPA showed a similar labelling to control. (D) Bar graph showing Ki-67 labeling index (*: P < 0.05).
Fig. 3.
Effect of rosiglitazone or EPA on cell cycle. (A) Representative western blotting for Cyclin D1, p21, and p27. (B) Relative ratio of Cyclin D1 expression normalized to GADPH. Cells treated with rosiglitazone or EPA reduced expression of Cyclin D1. (C) Relative ratio of p21 and (D) p27 normalized to GAPDH. Cells treated with rosiglitazone or EPA upregulated expression of p27 and co-treatment of T0070907 suppressed upregulation (*: P < 0.05). Expression of p21 showed similar trend but changes were not statistically significant.
While the expression of p21 Waf1/Cip1 showed a similar trend to that of p27, the changes were not statistically significant (Fig. 3C). Taken together, these results indicate that PPARγ receptor signaling in hMGEC cells mediates cell cycle exit through changes in cell cycle mediators.
3.3. EPA induced lipid accumulation via PPARγ signaling in meibocytes
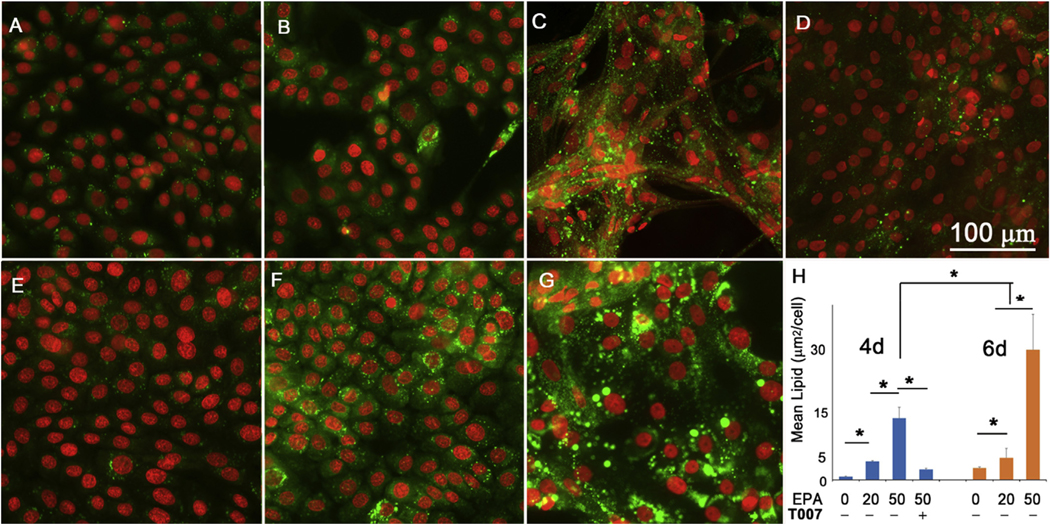
As shown in Fig. 4, a greater amount of lipid was accumulated in hMGECs as cells were exposed to EPA for longer times (6d > 4d). Furthermore, there was a dose dependent increase in lipid accumulation with increasing EPA concentration (20 μM < 50 μM). To evaluate whether this lipid accumulation was dependent on PPARγ signaling, cells were treated with a specific PPARγ antagonist, T0070907. While EPA significantly increased the production of lipid, pretreatment with T0070907 followed by EPA inhibited this response (Fig. 4D), indicating that enhanced lipid accumulation by EPA was due to activation of PPARγ signaling.
Fig. 4.
Effect of EPA on lipid synthesis in hMGEC. (A) Cultured in DMEM/F12/EGF for 4 days, (B) Cultured in DMEM/F12/EGF with 20 μM EPA, (C) with 50 μ M EPA, and (D) with 50 μM EPA plus 10 μM T0070907 for 4 days. (E) Cultured in DMEM/F12/EGF for 6 days, (F) with 20 μM EPA, and (G) with 50 μM EPA. (H) Bar graph showing a significant increase of lipid synthesis in cells cultured in DMEM/F12/EGF with EPA in time and concentration dependent manners via PPARγ signaling (*: P < 0.05).
To evaluate the chemical composition of the lipid droplets, we used stimulated Raman scattering (SRS) microscopic analysis to access the chemical profile of the lipid inside the lipid droplets. In previous works, SRS has been shown to be capable imaging lipid droplets in high detail without staining by probing the carbon-hydrogen vibrational stretching mode, ~2840 cm−1 [21–23]. By interrogating different Raman modes in each image, SRS was used to build hyperspectral data stacks that revealed chemical information about every pixel in a given spatial region of the sample. For this work, the range between 2750 cm−1 and 3050 cm−1 was of particular importance as this region includes information about lipid and protein content [23–31].
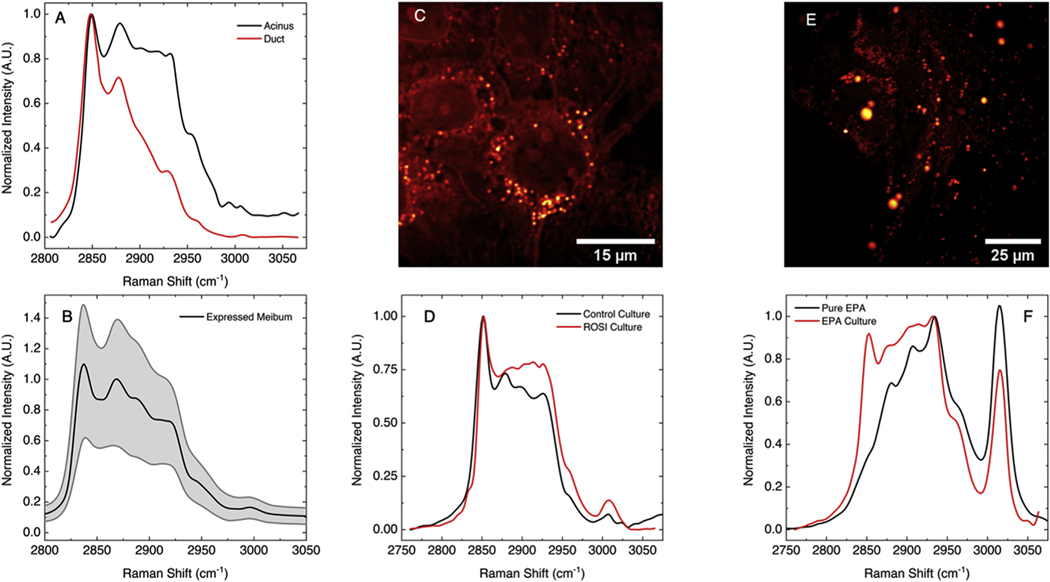
Fig. 5A shows the SRS spectrum measured at two locations in an excised human meibomian gland, one from lipid droplets in the acinus (black line) and one from the lipid in the duct (red) as reproduced previously [16]. The peak near 2850 cm−1 corresponds to the symmetric CH2 stretching mode, characteristic of all aliphatic lipids. The peak near 2880 cm−1 is present mostly in samples with a high concentration of saturated fatty acids, and is thus an indication of the presence of lipids that contain such fatty acid chains. The large shoulder near 2930 cm−1 is often interpreted as the presence of methyl stretches, which can be expected to be strong if an appreciable amount of protein is contributing to the signal collected from the focal probing volume. Comparing the SRS spectrum from lipid in the acinus and the duct, we may conclude that more protein is present at the lipid droplet locations in the acini than what can be found at the locations in the duct, i.e. lipid-rich material in the duct is virtually devoid of protein. In Fig. 5B, the mean SRS spectrum (black line) is shown from expressed human meibum obtained from a healthy patient as reported previously [16]. The grey area shows the variation in the SRS spectrum at different locations in the meibum smear. The spectrum shows the same characteristic peaks at 2850 cm−1 and 2880 cm−1, as well as a shallow shoulder near 2930 cm−1. The latter peak suggests that besides meibum lipids, non-negligible amounts of protein are present in the expressed human meibum [16,32].
Fig. 5.
Stimulated Raman Scattering (SRS) analysis of lipid droplet composition in hMGEC. (A) SRS spectrum of lipids in the acinus (black) and duct (red) of an excised human meibomian gland. Data is re-plotted from Ref. [16]. (B) Average SRS spectrum from expressed human meibum (black). Grey area shows the spatial variation in the smear. Data is re-plotted from Ref. [16] (C) SRS image at 2850 cm−1 of hMGEC cultured in DMEM/F12/EGF. (D) Average SRS spectrum obtained from 10 lipid droplets in hMGEC cultured in DMEM/F12/EGF (black) and cells exposed to Rosi (red). (E) SRS image at 2850 cm−1 of hMGEC treated with EPA. (F) Average SRS spectrum obtained from 10 lipid droplets in EPA treated cells (red) and from pure EPA (black).
A representative SRS image of hMGEC control cells taken at 2850 cm−1 is shown in Fig. 5C, where the bright spots indicate the lipid droplets. Fig. 5D depicts the spectrum of lipid droplets (black line), obtained by averaging the SRS spectrum from 10 individual droplets. Peaks at 2850 cm−1 and 2880 cm−1 are observed, although their relative ratio differs from the SRS spectrum obtained from droplets in meibocytes in the acini of the excised gland (Fig. 5A). In addition, the shoulder near 2930 cm−1 shows a different structure. Together this indicates that the exact lipid composition in the lipid droplets of cultured hMGEC control cells differs from the lipid composition found in meibocytes in the gland tissue.
An SRS spectrum of hMGECs exposed to Rosi is also presented in Fig. 5D, and shows that the peak at 2880 cm−1 is much less prominent. This is a potential indication of the lower concentration of saturated lipids. Different degrees of lipid saturation can have a profound effect on lipid fluidity, which has a strong effect on the 2870–2930 cm−1 vibrational energy range [33–35]. The peak near 3020 cm−1 is attributed to the carbon-hydrogen stretching vibration of the methine (=CH−) group, providing additional evidence that unsaturated lipids are present at higher concentrations than what has been observed in expressed human meibum.
The SRS image of EPA treated hMGECs is shown in Fig. 5E, indicating that the size and number of the lipid droplets is increased with EPA treatment. The average SRS spectrum of lipid droplets found in hMGEC cells treated with EPA is also shown by the red line in Fig. 5F. The spectrum shows some significant differences with the spectral features observed for human meibum as well as the lipid found in control and Rosi treated hMGECs. A prominent shoulder near 2950 cm−1 is observed, as well as a very strong peak near 3030 cm−1. The latter peak suggests a high degree of unsaturated lipids. The SRS spectrum of pure EPA is also shown by the black line in Fig. 5F. It can be seen that EPA exhibits a strong peak near 2950 cm−1 and 3030 cm−1, suggesting that a large amount of EPA has been absorbed by or transported to the lipid droplets following EPA treatment.
3.4. Lipid droplets were localized in ER and not lysosome
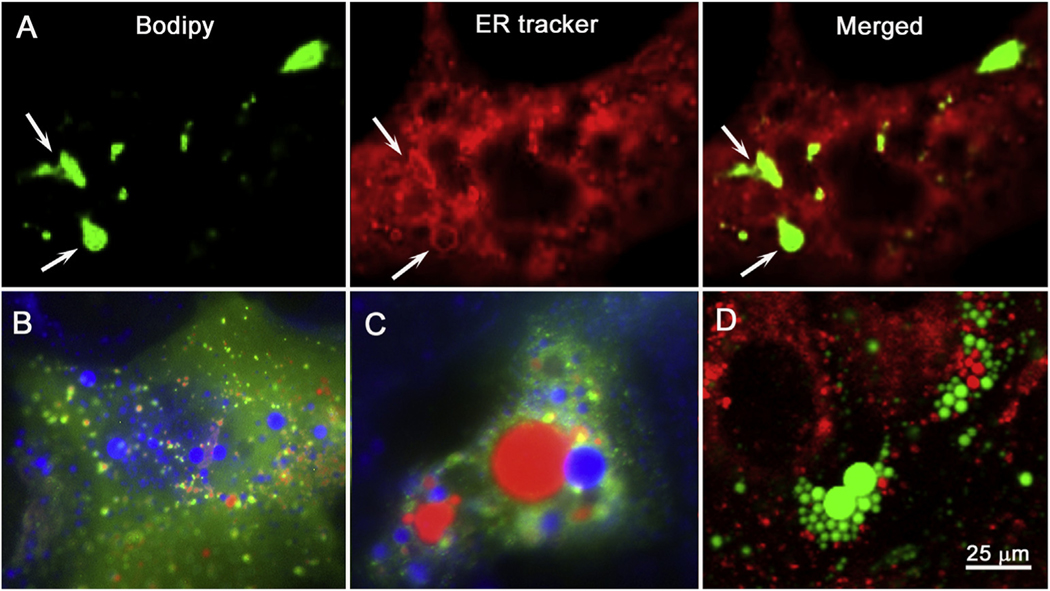
Previous reports have suggested that meibocytes accumulate lipid in lysosomes [36], while other studies suggest that lipid accumulates in smooth ER in most tissues including the meibomian gland [37,38]. To answer this question, we investigated the intracellular localization of lipid droplets using the vital lipid probe, Bodipy, and ER-Tracker in live rosi treated hMGEC (Fig. 6A). As shown, lipid appeared to co-localize within ER of the hMGEC. To assess whether lipid was potentially degraded in lysosomes before synthesis in the ER (lipophagy), live cells were transduced with RFP-GFP-LC3B to identify autophagosomes and autophagolysosomes and then co-labeled with Lipi-blue (blue) to identify lipid droplets. The tandem RFP-GFP-tagged LC3B is used to track LC3B within the cell based on the acid sensitivity of GFP fluorescence. Since the GFP signal is quenched under acidic conditions of lysosome while RFP is stable; co-localization of both GFP and RFP identify autophagosomes that are green/red, while autophagolysosome are only red. As shown in Fig. 6, treatment of cells with Rosi for 4 days (B) and 14 days (C) induced accumulation of lipid droplets (blue) as well as formation of autophagosomes (green/red) and autophagolysosome (red). Although we observed increased number and size of both lipid droplets as well as autophagosomes and autophagolysosome, there was no evidence of co-localization. To confirm these observations, we also stained Rosi treated hMGEC with LysoTracker and Bodipy (Fig. 6D, red and green respectively) and observed numerous, independently stained lysosome and lipid droplets with no apparent co-localization, suggesting PPARγ stimulated lipid accumulation does not involve lipophagy or storage in lysosomes.
Fig. 6.
Intracellular localization of lipid droplets. (A) Endoplasmic reticulum (ER) was imaged as red using ER-Tracker, while lipid droplets were imaged as green using Bodipy 493/503. A white arrow indicates a large lipid droplet entrapped with ER leaflet. Many small lipid droplets were costained with ER. (B,C) Autophagy was monitored using tandem RFP-GFP-LC3B during differentiation of hMGEC so that autophagosomes were imaged as yellowish green and autolysosomes were red. Lipid droplets were imaged as blue using Lipiblue (Dojindo). (B) HMGECs were exposed to rosiglitazone for 3 days, and (C) to rosiglitazone for 14 days. (D) HMGECs were treated with rosiglitazone for 5 days and lysosomes were imaged as red using LysoTracker and lipid droplets were imaged as green using Bodipy 493/503.
3.5. PPARγ receptor signaling activates autophagy pathway
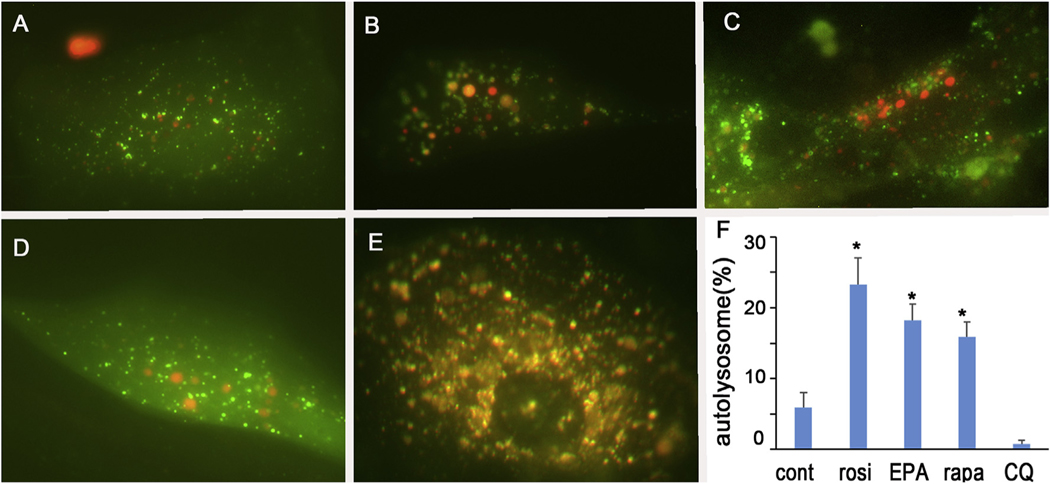
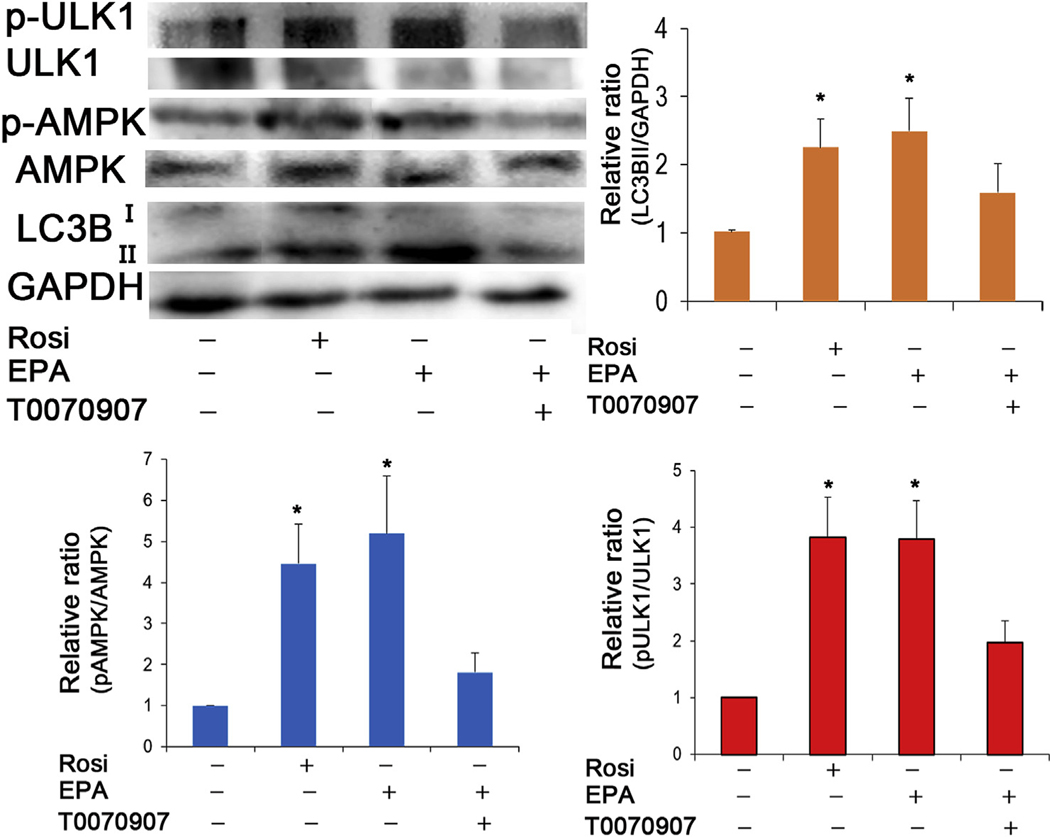
Since PPAR-induced lipid accumulation appeared to be associated with increased autophagosome and autophagolysosome formation, we next examined the effect of PPAR signaling on autophagic flux during hMGEC differentiation. As shown in Fig. 7, we observed that PPAR agonists, Rosi (B) and EPA (C) increased formation of autophagolysosome comparable to that of rapamycin treated cells (D), a well-known autophagy inducer, and greater than that observed in control cells (A) or cells treated with chloroquine, a known inhibitor of autophagic flux (E). Quantitative analysis (F) showed that autolysosomes induced by Rosi or EPA were significantly greater in number compared to control or chloroquine treated cells, and comparable to rapamycin treated cells. To further determine if PPARγ signaling induces autophagy, we performed western blotting and observed that both Rosi and EPA treatment increased expression of LC3BII and phosphorylation of ULK1(pULK1, S555) and AMPKα (pAMPK), (Fig. 8). Co-treatment of PPARγ antagonist T0070907 also reduced expression of LC3BII as well as phosphorylation of p-AMPK and p-ULK1. These data indicate that PPARγ activation induces autophagy and its inhibition suppresses autophagy at least partly.
Fig. 7.
Effect of PPARγ activation on autophagic flux in hMGEC. (A-E) Autophagy was monitored after transduction with autophagy tandem RFP-GFP-LC3B sensor. (A) hMGECs were cultivated with DMEM/F12/EGF, (B) exposed to rosiglitazone, (C) to EPA, (D) to rapamycin, and (E) to chloroquine. Autophagosomes were imaged as yellowish green, whereas autolysosomes were imaged as red. (H) Bar graph showing relative percentage of autolysosome to total LC3B dots per cell, indicating autophagic flux (*: P < 0.05).
Fig. 8.
Effect of PPARγ activation on autophagy signaling in hMGEC. (A) A representative Western blotting image for phospho (S555)-ULK1, ULK1, phospho-AMPKα, AMPKα, and LC3B (B-D). Bar graphs showing relative folds of LC3BII, phospho-AMPKα, and phospho (S555)-ULK1 expression normalized to GAPDH, AMPKα and ULK1, respectively. Rosiglitazone and EPA treatment upregulated expression of LC3BII and phosphorylation of AMPKα and ULK1. Co-treatment of T0070907 abrogated upregulation and phosphorylation (*: P < 0.05).
3.6. Suppression of autophagy did not abolish lipid production but led to mitochondrial dysfunction
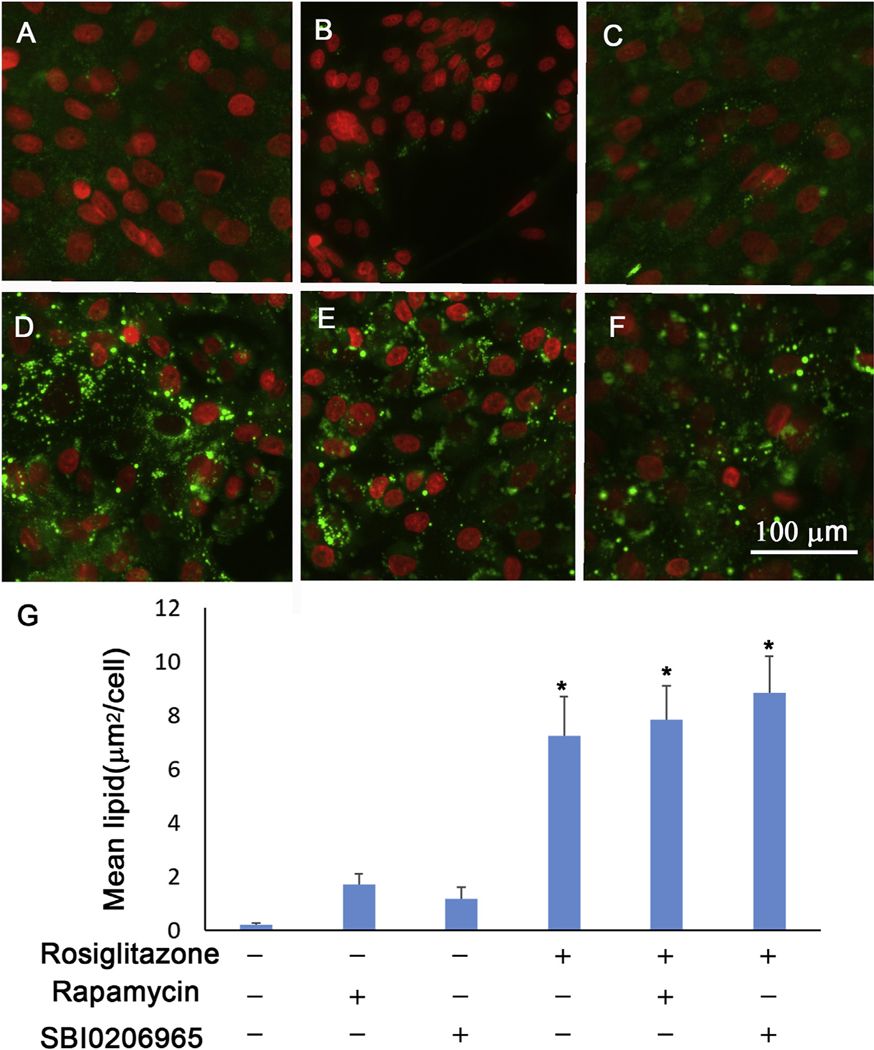
To investigate the effect of autophagy on meibocyte differentiation, we compared the effect of autophagy induction and inhibition on Rosiinduced lipid accumulation using rapamycin to stimulate autophagy and SBI-0206965 (CST, 2 μM), a potent ULK1 inhibitor, to inhibit autophagy induction. As shown in Fig. 9, neither of these two autophagy modulators alone or in combination with Rosi significantly increased lipid accumulation in hMGEC cells.
Fig. 9.
Effect of autophagy modulation on lipid production. (A) HMGECs were differentiated with DMEM-F12-EGF, (B) with rapamycin, (C) with SBI-0206965, (D) with rosiglitazone, (E) with rosiglitazone plus rapamycin, and (F) with rosiglitazone plus SBI-0206965. (G) Bar graphs showing increased lipid accumulation when cells were exposed to rosiglitazone with or without autophagy modulator (*: P < 0.05).
We further conducted Seahorse experiments to investigate the effect of autophagy on mitochondrial function during hMGEC differentiation. As shown in Fig. 10, mitochondrial function was not affected by PPARγ activation; however, inhibition of autophagy during differentiation led to severe mitochondrial crisis. We observed that mitophagy was active during differentiation of hMGEC induced by PPARγ activation by colocalization of mitochondria and lysosome (data not shown). Taken together, we concluded that autophagy or mitophagy may play a role during differentiation of hMGEC.
Fig. 10.
Mitochondrial oxygen consumption rate. Oxygen consumption rate were compared when hMGECs were differentiated under DMEM-F12-EGF media and exposed to rosiglitazone, SBI-0206965, and rosiglitazone plus SBI-0206065.
4. Discussion
This paper expands upon our previous studies of the role of PPARγ in regulating meibocyte differentiation [10], and evaluates the effect of the natural PPAR ligand, EPA, that broadly activates PPAR signaling through α, β/δ and γ isoforms [12,39]. In this study we confirm that EPA, through specific PPARγ receptor signaling induces cell cycle exit, lipogenic gene expression and the accumulation of neutral lipids, similar to that of the specific, synthetic PPARγ agonist, rosiglitazone [10]. While little is known regarding control of meibocyte cell growth and differentiation, this process has been extensively studied in adipogenesis where PPARγ agonist have been shown to induce the later stages of adipocyte differentiation through up-regulation of cyclin kinase inhibitors (CKI) and adipocyte specific genes, where these are molecularly linked to ensure irreversible terminal differentiation [40]. Our findings that EPA up-regulates p21/Kip1 and p27 Waf1/Cip1 are consistent with that of CKIs that are up-regulated by PPARγ in adipocytes. While there are unique differences between these two cell types, as one stores and the other secretes lipid, these findings suggest that there are parallels between these two cells regarding the molecular program regulating cell differentiation.
Regarding the expression of lipogenic genes by EPA, PLIN2, ELOVL4 and SOAT1 were shown to be up-regulated. PLIN2 is a lipid droplet associated protein considered to be a maker of lipid accumulation in various tissues [11,41,42]. PLIN2 stimulates the uptake of long chain fatty acids that represent a prominent component of meibum lipids. Higher level of expression has been observed in more mature meibocytes located toward the center of the acini and it was hence suggested to be a differentiation marker for mature meibocytes [43]. ELOVL4 and SOAT1 are known to play important roles in meibum lipid synthesis and are necessary to synthesize very long chain fatty acids and cholesterol ester, respectively [44]. Considering that these very long chain lipids and cholesterol esters are major meibum lipid species, modulation of ELOVL4 and SOAT1 expression by PPARγ signaling could have relevant clinical implications in the development of MGD. Overall, these findings indicate that transcriptional up-regulation of these genes are dependent on PPARγ receptor signaling. By comparison, EPA treatment did not change expression of PPARG, a different finding from rosiglitazone treatment described in our previous study [10]. This data indicates that each natural PPAR ligand may not show exactly the same response as that obtained by specific, synthetic PPARγ agonists.
Additionally, our findings regarding the effects of EPA on hMGEC are consistent with those reported by Hampel et al., who evaluated the effects of both docosahexaenoic acid (DHA) and EPA in combination, showing synergistic effects at a concentration of 100 μM each that peaked 24 h after treatment [45]. Our findings are different in that EPA alone at lower doses than those used by Hampel, produced significantly increased accumulation of neutral lipid that increase in size and number from 4 to 6 days, compared to the decreasing effect at 72 h detected by Hampel et al. This difference is likely due to the different differentiation culture conditions used [46–49]. First, serum was removed from the differentiation media to eliminate serum lipids and other factors that could influence cell differentiation. This elimination of serum required the addition of lipid free albumin to act as a lipid carrier for EPA, as fatty acids alone are cytotoxic. It is interesting to note that our more pronounced and prolonged effect on lipid synthesis suggests that serum, while showing some ability to induce differentiation of hMGEC [48,49], also contains factors that are potentially inhibitory for meibocyte differentiation. Further study of these effects may help in understanding the overall value of these cells to probing the molecular mechanisms of meibocyte differentiation.
While EPA was shown to significantly enhance lipid droplet accumulation, probing of the lipid contents using SRS microscopy failed to show a similar Raman profile to that detected in meibum from human eyelids or excreta [16]. Unfortunately, SRS cannot specifically identify individual lipid classes; however, our findings are consistent with earlier reports indicating that hMGEC lipids do not resemble those normally identified in expressed meibum [46,47,50]. As we have previously reported, several lipogenic genes are not expressed by hMGECs in culture and are not up-regulated following treatment with either rosiglitazone or EPA [11]. Of particular note is the loss of AWAT 1/2 expression, which is a critical enzyme required for the synthesis of wax esters that represent 40% of the total meibum neutral lipids [44]. The failure of PPARγ activation to induce expression of this enzyme suggests that meibum specific lipid synthesis is not fully controlled through PPARγ signaling and that additional complex signaling cascades as yet to be discovered may be involved in complete meibocyte differentiation.
SRS did show that lipids droplets accumulated in hMGEC when treated with either Rosi or EPA, indicating that there is both de novo lipid (DNL) synthesis and transport of lipid into the accumulating lipid droplets. Since treatment of hMGEC with Rosi alone was not in the presence of serum, the only source for the accumulation of lipids would be DNL through fatty acid synthesis. However, the SRS analysis of lipid droplets in EPA treated cells suggested the presence of EPA within the droplets. As SRS has a voxel resolution of 1 μm3, it is not likely that this signal was obtained from extracellular lipid. The fact that meibocytes in culture can synthesize DNL meibum was first established for bovine meibomian glands [51], and later for rabbit meibomian glands [52]. A more recent report, however, suggests that meibomian glands predominantly use circulating lipids for biosynthesis of meibum [53]. This is in distinct contrast to that of sebaceous glands that rely predominantly on DNL. Further study of lipid synthesis is needed to confirm these unique differences between meibomian and sebaceous glands.
In this study, we have also conducted live imaging of lipid droplets and subcellular organelles to identify the site of lipid droplet accumulation. Previous studies indicate that lipid biosynthesis occurs predominantly in the ER [54,55], and electron microscopy studies of meibomian glands has also localized lipid droplets to the smooth ER [37]. Our findings in this study are consistent with those of earlier studies and confirm that lipid droplets accumulate in the ER of hMGEC. This finding is in disagreement with many previous reports using the same cell line that have suggested that hMGEC synthesize and store lipid droplets in the lysosomal compartment [36,49,50,56,57]. This discrepancy may, in part, be due to the use of agents such as azithromycin that are known to induce phospholipidosis and the accumulation of phospholipids in lysosomes [36,56], while in our studies we have used synthetic and natural ligands for PPARγ.
Previous studies have found autophagy to be crucial for normal homeostasis and physiologic functioning in many cells and tissues [58,59]. To our knowledge, the role of autophagy in the meibomian gland or in the differentiation of cultured meibocytes has not been documented. Recent studies indicates that autophagy contributes to sebaceous gland function, sebum composition, and terminal differentiation [60], and abrogation of autophagy has been shown to alter both sebocyte and keratinocyte differentiation [60,61]. A recent study proposed a dual role of autophagy in differentiation of skin keratinocytes having a pro-survival, homeostatic control mechanism during differentiation and cell death-induced autophagy during terminal differentiation [62]. In parallel with recent works, we also hypothesized that autophagy may play a similar role during meibocyte differentiation perhaps involving terminal cellular disintegration.
To evaluate this hypothesis, we first examined human eyelid tissue sections with immunohistochemistry and observed a strong expression of autophagy related proteins such as LC3, BCN-1, and ULK1 in meibomian gland acini and duct Figure figs1(Supplemental figure). Our in vitro study demonstrated an increase of autophagy when cells were exposed to PPARγ ligands, rosiglitazone or EPA. While autophagy generally serves as a catabolic pathway for recycling of proteins or even lipids, our data did not support a catabolic role of autophagy modulating lipid droplet accumulation since lipid droplets did not co-localize with either autophagosome, autophagolysosomes, or even with lysosomes. Alternatively, autophagy may play a role in lipid anabolic pathway by providing fatty acid sources. Recent researches indicated an anabolic role of autophagy in adipose tissue and showed that inhibition of autophagy led to defective lipid accumulation [63]. However, our data showed that pharmacological inhibition of autophagy did not induce a significant change in lipid accumulation in the presence of rosiglitazone. This observation suggests that PPARγ signaling is a potent activator of lipid accumulation and that activation of autophagy is down stream of this process. In this regard, induction of autophagy appeared to occur much later than PPARγ gene activation as evidenced by the up-regulation of PPAR response genes at day 1 and the AMPK signaling activation occurring at day 4. Together, these findings suggest that there must be second messengers interconnecting autophagy induction and lipid synthesis initiated by PPARγ signaling in differentiating meibocytes.
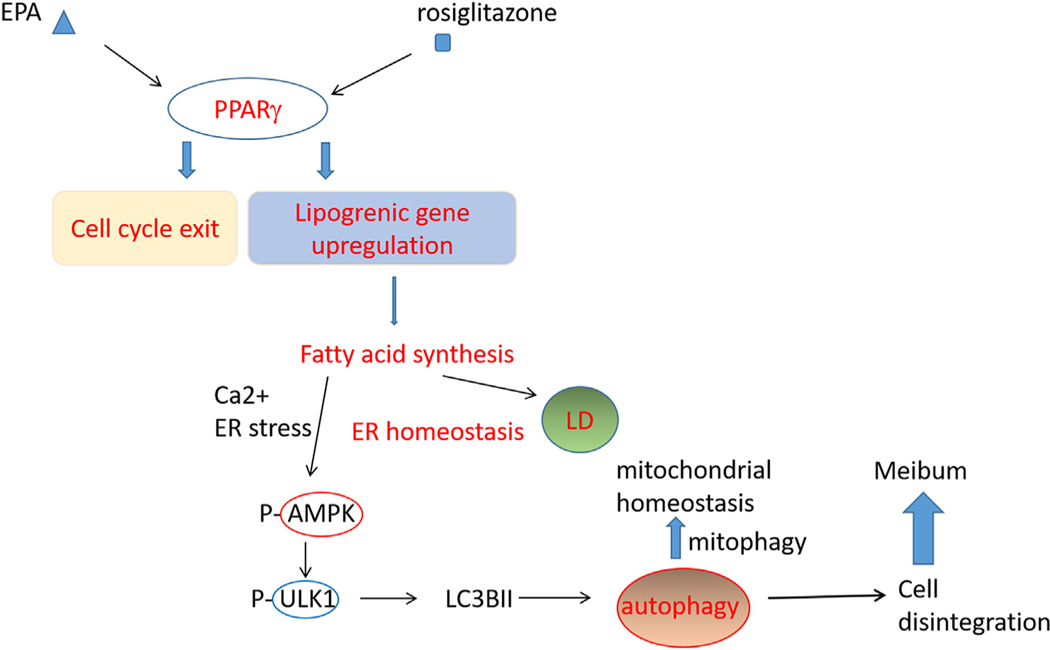
There are several alternative explanations for induction of autophagy following PPARγ activation. Previous studies indicated that Rosiglitazone increases intracytosolic Ca2+ concentration or alters the mitochondrial membrane potential, leading to autophagy induction by activating AMPK signaling cascade [64,65]. Alternatively, newly synthesized fatty acids may induce ER stress leading to activation of autophagy and lipid droplets serve as a buffer to maintain homeostasis [59]. It should be noted that many pathways could coordinate autophagy and PPARγ signaling could be one of them. Taken together, our data suggests that PPARγ activation and autophagy seems to be interrelated. Fig. 11 shows a hypothetical role of PPARγ activation based upon our data and previous researches. A second possible explanation might be its role in the maintenance of mitochondrial homeostasis. Our Seahorse data showing that mitochondria undergo severe crisis following activation of PPARγ and inhibition of autophagy suggests that autophagy may play a critical role in mitochondrial homeostasis during differentiation, fatty acid oxidation and lipogenesis in meibocytes. Finally, while we could not confirm a role of autophagy in cellular disintegration, the appearance of large autophagolysosomes with numerous autophagic vacuoles at the relatively late differential stage (14D in culture, Fig. 6) suggest subcellular organelles may be degraded using autophagic machinery before cellular disintegration and holocrine secretion.
Fig. 11.
Hypothetic role of PPARγ signaling during hMGEC differentiation. PPARγ agonists activate PPARγ signaling leading to cell cycle exit and transcriptional upregulation of lipogenic gens. As cells shift to lipid synthesis by PPARγ activation, newly synthesized fatty acids increase ER stress and lipid droplets is accumulated to maintain ER homeostasis. ER stress, cytosolic Ca2+ increase, and/or AMP/ATP imbalance activate AMPK signaling leading to autophagy during PPARγ induced differentiation. Mitophagy may be active and play a role to maintain homeostasis of mitochondria and during fatty acid synthesis overloaded stress and autophagic degradation of subcellular organelles presumably lead to cellular disintegration.
5. Conclusion
This study shows that PPARγ activation, induced by both rosiglitazone and EPA, leads to cell cycle exit, lipid production, and autophagy during differentiation. Autophagy seems to play a role for maintaining mitochondrial homeostasis and underlying mechanism how PPARγ signaling and autophagy lead to cellular disintegration need to be further studied.
Supplementary Material
Funding
This work was supported in part by NIH/NEI EY021510, NIH/NGMS GM132506, an Unrestricted Grant from Research to Prevent Blindness, Inc. RPB-203478, and the Skirball program in Molecular Ophthalmology and basic science research program through the National Research Foundation of Korea (NRF) funded by the Ministry of Education, Science and Technology (2017R1D1A3B03036549).
Footnotes
Disclosure
The authors have no commercial interest in any concept or product discussed in this article.
Appendix A. Supplementary data
Supplementary data to this article can be found online at https://doi.org/10.1016/j.jtos.2020.04.012.
References
- [1].Bron AJ, Tiffany JM. The contribution of meibomian disease to dry eye. Ocul Surf 2004;2:149–65. [DOI] [PubMed] [Google Scholar]
- [2].Mathers WD, Shields WJ, Sachdev MS, Petroll WM, Jester JV. Meibomian gland morphology and tear osmolarity: changes with Accutane therapy. Cornea 1991;10:286–90. [DOI] [PubMed] [Google Scholar]
- [3].Nien CJ, Massei S, Lin G, Nabavi C, Tao J, Brown DJ, et al. Effects of age and dysfunction on human meibomian glands. Arch Ophthalmol 2011;129:462–9. [DOI] [PMC free article] [PubMed] [Google Scholar]
- [4].Nien CJ, Paugh JR, Massei S, Wahlert AJ, Kao WW, Jester JV. Age-related changes in the meibomian gland. Exp Eye Res 2009;89:1021–7. [DOI] [PMC free article] [PubMed] [Google Scholar]
- [5].Rosen ED, Sarraf P, Troy AE, Bradwin G, Moore K, Milstone DS, et al. PPAR gamma is required for the differentiation of adipose tissue in vivo and in vitro. Mol Cell 1999;4:611–7. [DOI] [PubMed] [Google Scholar]
- [6].Rosenfield RL, Deplewski D, Greene ME. Peroxisome proliferator-activated receptors and skin development. Horm Res 2000;54:269–74. [DOI] [PubMed] [Google Scholar]
- [7].Trivedi NR, Cong Z, Nelson AM, Albert AJ, Rosamilia LL, Sivarajah S, et al. Peroxisome proliferator-activated receptors increase human sebum production. J Invest Dermatol 2006;126:2002–9. [DOI] [PubMed] [Google Scholar]
- [8].Nien CJ, Massei S, Lin G, Liu H, Paugh JR, Liu CY, et al. The development of meibomian glands in mice. Mol Vis 2010;16:1132–40. [PMC free article] [PubMed] [Google Scholar]
- [9].Jester JV. Frontiers of ocular surface regenerative medicine. Ocul Surf 2016;14:81. [DOI] [PubMed] [Google Scholar]
- [10].Kim SW, Xie Y, Nguyen PQ, Bui VT, Huynh K, Kang JS, et al. PPARgamma regulates meibocyte differentiation and lipid synthesis of cultured human meibomian gland epithelial cells (hMGEC). Ocul Surf 2018;16:463–9. [DOI] [PMC free article] [PubMed] [Google Scholar]
- [11].Kim SW, Brown DJ, Jester JV. Transcriptome analysis after PPARgamma activation in human meibomian gland epithelial cells (hMGEC). Ocul Surf 2019;17:809–16. [DOI] [PMC free article] [PubMed] [Google Scholar]
- [12].Wang L, Waltenberger B, Pferschy-Wenzig EM, Blunder M, Liu X, Malainer C, et al. Natural product agonists of peroxisome proliferator-activated receptor gamma (PPARgamma): a review. Biochem Pharmacol 2014;92:73–89. [DOI] [PMC free article] [PubMed] [Google Scholar]
- [13].Macsai MS. The role of omega-3 dietary supplementation in blepharitis and meibomian gland dysfunction (an AOS thesis). Trans Am Ophthalmol Soc 2008;106:336–56. [PMC free article] [PubMed] [Google Scholar]
- [14].Giannaccare G, Pellegrini M, Sebastiani S, Bernabei F, Roda M, Taroni L, et al. Efficacy of omega-3 fatty acid supplementation for treatment of dry eye disease: a meta-analysis of randomized clinical trials. Cornea 2019;38:565–73. [DOI] [PubMed] [Google Scholar]
- [15].Prince RC, Frontiera RR, Potma EO. Stimulated Raman scattering: from bulk to nano. Chem Rev 2017;117:5070–94. [DOI] [PMC free article] [PubMed] [Google Scholar]
- [16].Paugh JR, Alfonso-Garcia A, Nguyen AL, Suhalim JL, Farid M, Garg S, et al. Characterization of expressed human meibum using hyperspectral stimulated Raman scattering microscopy. Ocul Surf 2019;17:151–9. [DOI] [PMC free article] [PubMed] [Google Scholar]
- [17].Suhalim JL, Parfitt GJ, Xie Y, De Paiva CS, Pflugfelder SC, Shah TN, et al. Effect of desiccating stress on mouse meibomian gland function. Ocul Surf 2014;12:59–68. [DOI] [PMC free article] [PubMed] [Google Scholar]
- [18].Schindelin J, Arganda-Carreras I, Frise E, Kaynig V, Longair M, Pietzsch T, et al. Fiji: an open-source platform for biological-image analysis. Nat Methods 2012;9:676–82. [DOI] [PMC free article] [PubMed] [Google Scholar]
- [19].Verheijen R, Kuijpers HJ, Schlingemann RO, Boehmer AL, van Driel R, Brakenhoff GJ, et al. Ki-67 detects a nuclear matrix-associated proliferation-related antigen. I. Intracellular localization during interphase. J Cell Sci 1989;92(Pt 1):123–30. [DOI] [PubMed] [Google Scholar]
- [20].Verheijen R, Kuijpers HJ, van Driel R, Beck JL, van Dierendonck JH, Brakenhoff GJ, et al. Ki-67 detects a nuclear matrix-associated proliferation-related antigen. II. Localization in mitotic cells and association with chromosomes. J Cell Sci 1989;92(Pt 4):531–40. [DOI] [PubMed] [Google Scholar]
- [21].Francis A, Berry K, Chen Y, Figueroa B, Fu D. Label-free pathology by spectrally sliced femtosecond stimulated Raman scattering (SRS) microscopy. PloS One 2017;12:e0178750. [DOI] [PMC free article] [PubMed] [Google Scholar]
- [22].Fu D, Xie XS. Reliable cell segmentation based on spectral phasor analysis of hyperspectral stimulated Raman scattering imaging data. Anal Chem 2014;86:4115–9. [DOI] [PubMed] [Google Scholar]
- [23].Li J, Cheng JX. Direct visualization of de novo lipogenesis in single living cells. Sci Rep 2014;4:6807. [DOI] [PMC free article] [PubMed] [Google Scholar]
- [24].Alfonso-Garcia A, Paugh J, Farid M, Garg S, Jester JV, Potma EO. A machine learning framework to analyze hyperspectral stimulated Raman scattering microscopy images of expressed human meibum. J Raman Spectrosc 2017;48:803–12. [DOI] [PMC free article] [PubMed] [Google Scholar]
- [25].Camp CH, Cicerone MT. Chemically sensitive bioimaging with coherent Raman scattering. Nat Photon 2015;9:295–305. [Google Scholar]
- [26].Freudiger CW, Min W, Saar BG, Lu S, Holtom GR, He C, et al. Label-free biomedical imaging with high sensitivity by stimulated Raman scattering microscopy. Science 2008;322:1857–61. [DOI] [PMC free article] [PubMed] [Google Scholar]
- [27].Fu D Quantitative chemical imaging with stimulated Raman scattering microscopy. Curr Opin Chem Biol 2017;39:24–31. [DOI] [PubMed] [Google Scholar]
- [28].Min W, Freudiger CW, Lu S, Xie XS. Coherent nonlinear optical imaging: beyond fluorescence microscopy. Annu Rev Phys Chem 2011;62:507–30. [DOI] [PMC free article] [PubMed] [Google Scholar]
- [29].Saar BG, Freudiger CW, Reichman J, Stanley CM, Holtom GR, Xie XS. Video-rate molecular imaging in vivo with stimulated Raman scattering. Science 2010;330:1368–70. [DOI] [PMC free article] [PubMed] [Google Scholar]
- [30].Shi L, Zheng C, Shen Y, Chen Z, Silveira ES, Zhang L, et al. Optical imaging of metabolic dynamics in animals. Nat Commun 2018;9:2995. [DOI] [PMC free article] [PubMed] [Google Scholar]
- [31].Fu D, Holtom G, Freudiger C, Zhang X, Xie XS. Hyperspectral imaging with stimulated Raman scattering by chirped femtosecond lasers. J Phys Chem B 2013;117:4634–40. [DOI] [PMC free article] [PubMed] [Google Scholar]
- [32].Lin CY, Suhalim JL, Nien CJ, Miljkovic MD, Diem M, Jester JV, et al. Picosecond spectral cars imaging with principal component analysis of meibomian glands. J Biomed Optic 2011;16:021104. [DOI] [PMC free article] [PubMed] [Google Scholar]
- [33].Gaber BP, Peticolas WL. On the quantitative interpretation of biomembrane structure by Raman spectroscopy. Biochim Biophys Acta 1977;465:260–74. [DOI] [PubMed] [Google Scholar]
- [34].Rinia HA, Burger KN, Bonn M, Muller M. Quantitative label-free imaging of lipid composition and packing of individual cellular lipid droplets using multiplex CARS microscopy. Biophys J 2008;95:4908–14. [DOI] [PMC free article] [PubMed] [Google Scholar]
- [35].Snyder RG, Strauss HL, Elliger CA. Carbon-hydrogen stretching modes and the structure of n-alkyl chains. 1. Long, disordered chains. J Phys Chem 1982;86:5145–50. [Google Scholar]
- [36].Liu Y, Kam WR, Ding J, Sullivan DA. One man’s poison is another man’s meat: using azithromycin-induced phospholipidosis to promote ocular surface health. Toxicology 2014;320:1–5. [DOI] [PMC free article] [PubMed] [Google Scholar]
- [37].Jester JV, Nicolaides N, Smith RE. Meibomian gland studies: histologic and ultrastructural investigations. Investig Ophthalmol Vis Sci 1981;20:537–47. [PubMed] [Google Scholar]
- [38].Hwang HS, Parfitt GJ, Brown DJ, Jester JV. Meibocyte differentiation and renewal: insights into novel mechanisms of meibomian gland dysfunction (MGD). Exp Eye Res 2017;163:37–45. [DOI] [PMC free article] [PubMed] [Google Scholar]
- [39].Echeverria F, Ortiz M, Valenzuela R, Videla LA. Long-chain polyunsaturated fatty acids regulation of PPARs, signaling: relationship to tissue development and aging. Prostaglandins Leukot Essent Fatty Acids 2016;114:28–34. [DOI] [PubMed] [Google Scholar]
- [40].Morrison RF, Farmer SR. Role of PPARgamma in regulating a cascade expression of cyclin-dependent kinase inhibitors, p18(INK4c) and p21(Waf1/Cip1), during adipogenesis. J Biol Chem 1999;274:17088–97. [DOI] [PubMed] [Google Scholar]
- [41].Dahlhoff M, Camera E, Picardo M, Zouboulis CC, Chan L, Chang BH, et al. PLIN2, the major perilipin regulated during sebocyte differentiation, controls sebaceous lipid accumulation in vitro and sebaceous gland size in vivo. Biochim Biophys Acta 2013;1830:4642–9. [DOI] [PMC free article] [PubMed] [Google Scholar]
- [42].Takahashi Y, Shinoda A, Kamada H, Shimizu M, Inoue J, Sato R. Perilipin2 plays a positive role in adipocytes during lipolysis by escaping proteasomal degradation. Sci Rep 2016;6:20975. [DOI] [PMC free article] [PubMed] [Google Scholar]
- [43].Kutsuna M, Kodama T, Sumida M, Nagai A, Higashine M, Zhang W, et al. Presence of adipose differentiation-related protein in rat meibomian gland cells. Exp Eye Res 2007;84:687–93. [DOI] [PubMed] [Google Scholar]
- [44].Butovich IA. Meibomian glands, meibum, and meibogenesis. Exp Eye Res 2017;163:2–16. [DOI] [PMC free article] [PubMed] [Google Scholar]
- [45].Hampel U, Kruger M, Kunnen C, Garreis F, Willcox M, Paulsen F. In vitro effects of docosahexaenoic and eicosapentaenoic acid on human meibomian gland epithelial cells. Exp Eye Res 2015;140:139–48. [DOI] [PubMed] [Google Scholar]
- [46].Hampel U, Schroder A, Mitchell T, Brown S, Snikeris P, Garreis F, et al. Seruminduced keratinization processes in an immortalized human meibomian gland epithelial cell line. PloS One 2015;10:e0128096. [DOI] [PMC free article] [PubMed] [Google Scholar]
- [47].Kam WR, Liu Y, Ding J, Sullivan DA. Do cyclosporine A, an IL-1 receptor antagonist, uridine triphosphate, rebamipide, and/or bimatoprost regulate human meibomian gland epithelial cells? Investig Ophthalmol Vis Sci 2016;57:4287–94. [DOI] [PMC free article] [PubMed] [Google Scholar]
- [48].Liu S, Hatton MP, Khandelwal P, Sullivan DA. Culture, immortalization, and characterization of human meibomian gland epithelial cells. Investig Ophthalmol Vis Sci 2010;51:3993–4005. [DOI] [PMC free article] [PubMed] [Google Scholar]
- [49].Sullivan DA, Liu Y, Kam WR, Ding J, Green KM, Shaffer SA, et al. Serum-induced differentiation of human meibomian gland epithelial cells. Investig Ophthalmol Vis Sci 2014;55:3866–77. [DOI] [PMC free article] [PubMed] [Google Scholar]
- [50].Liu Y, Kam WR, Ding J, Sullivan DA. Can tetracycline antibiotics duplicate the ability of azithromycin to stimulate human meibomian gland epithelial cell differentiation? Cornea 2015;34:342–6. [DOI] [PMC free article] [PubMed] [Google Scholar]
- [51].Kolattukudy PE, Rogers LM, Nicolaides N. Biosynthesis of lipids by bovine meibomian glands. Lipids 1985;20:468–74. [DOI] [PubMed] [Google Scholar]
- [52].Duerden JM, Tiffany JM. Lipid synthesis in vitro by rabbit Meibomian gland tissue and its inhibition by tetracycline. Biochim Biophys Acta 1990;1042:13–8. [DOI] [PubMed] [Google Scholar]
- [53].Esler WP, Tesz GJ, Hellerstein MK, Beysen C, Sivamani R, Turner SM, et al. Human sebum requires de novo lipogenesis, which is increased in acne vulgaris and suppressed by acetyl-CoA carboxylase inhibition. Sci Transl Med 2019;11. [DOI] [PubMed] [Google Scholar]
- [54].Jacquemyn J, Cascalho A, Goodchild RE. The ins and outs of endoplasmic reticulum-controlled lipid biosynthesis. EMBO Rep 2017;18:1905–21. [DOI] [PMC free article] [PubMed] [Google Scholar]
- [55].Wang H, Airola MV, Reue K. How lipid droplets “TAG” along: glycerolipid synthetic enzymes and lipid storage. Biochim Biophys Acta Mol Cell Biol Lipids 2017;1862:1131–45. [DOI] [PMC free article] [PubMed] [Google Scholar]
- [56].Liu Y, Kam WR, Ding J, Sullivan DA. Effect of azithromycin on lipid accumulation in immortalized human meibomian gland epithelial cells. JAMA Ophthalmol 2014;132:226–8. [DOI] [PMC free article] [PubMed] [Google Scholar]
- [57].Liu Y, Kam WR, Fernandes P, Sullivan DA. The effect of solithromycin, a cationic amphiphilic drug, on the proliferation and differentiation of human meibomian gland epithelial cells. Curr Eye Res 2018;43:683–8. [DOI] [PMC free article] [PubMed] [Google Scholar]
- [58].He C, Klionsky DJ. Regulation mechanisms and signaling pathways of autophagy. Annu Rev Genet 2009;43:67–93. [DOI] [PMC free article] [PubMed] [Google Scholar]
- [59].Rashid HO, Yadav RK, Kim HR, Chae HJ. ER stress: autophagy induction, inhibition and selection. Autophagy 2015;11:1956–77. [DOI] [PMC free article] [PubMed] [Google Scholar]
- [60].Rossiter H, Stubiger G, Groger M, Konig U, Gruber F, Sukseree S, et al. Inactivation of autophagy leads to changes in sebaceous gland morphology and function. Exp Dermatol 2018;27:1142–51. [DOI] [PubMed] [Google Scholar]
- [61].Monteleon CL, Agnihotri T, Dahal A, Liu M, Rebecca VW, Beatty GL, et al. Lysosomes support the degradation, signaling, and mitochondrial metabolism necessary for human epidermal differentiation. J Invest Dermatol 2018;138:1945–54. [DOI] [PMC free article] [PubMed] [Google Scholar]
- [62].Koenig U, Robenek H, Barresi C, Brandstetter M, Resch GP, Groger M, et al. Cell death induced autophagy contributes to terminal differentiation of skin and skin appendages. Autophagy 2019:1–14. [DOI] [PMC free article] [PubMed] [Google Scholar]
- [63].Singh R, Xiang Y, Wang Y, Baikati K, Cuervo AM, Luu YK, et al. Autophagy regulates adipose mass and differentiation in mice. J Clin Invest 2009;119:3329–39. [DOI] [PMC free article] [PubMed] [Google Scholar]
- [64].Caddy J, Isa S, Mainwaring LS, Adam E, Roberts A, Lang D, et al. Rosiglitazone induces the unfolded protein response, but has no significant effect on cell viability, in monocytic and vascular smooth muscle cells. Biochem Biophys Res Commun 2010;400:689–95. [DOI] [PubMed] [Google Scholar]
- [65].Divakaruni AS, Wiley SE, Rogers GW, Andreyev AY, Petrosyan S, Loviscach M, et al. Thiazolidinediones are acute, specific inhibitors of the mitochondrial pyruvate carrier. Proc Natl Acad Sci U S A 2013;110:5422–7. [DOI] [PMC free article] [PubMed] [Google Scholar]
Associated Data
This section collects any data citations, data availability statements, or supplementary materials included in this article.


