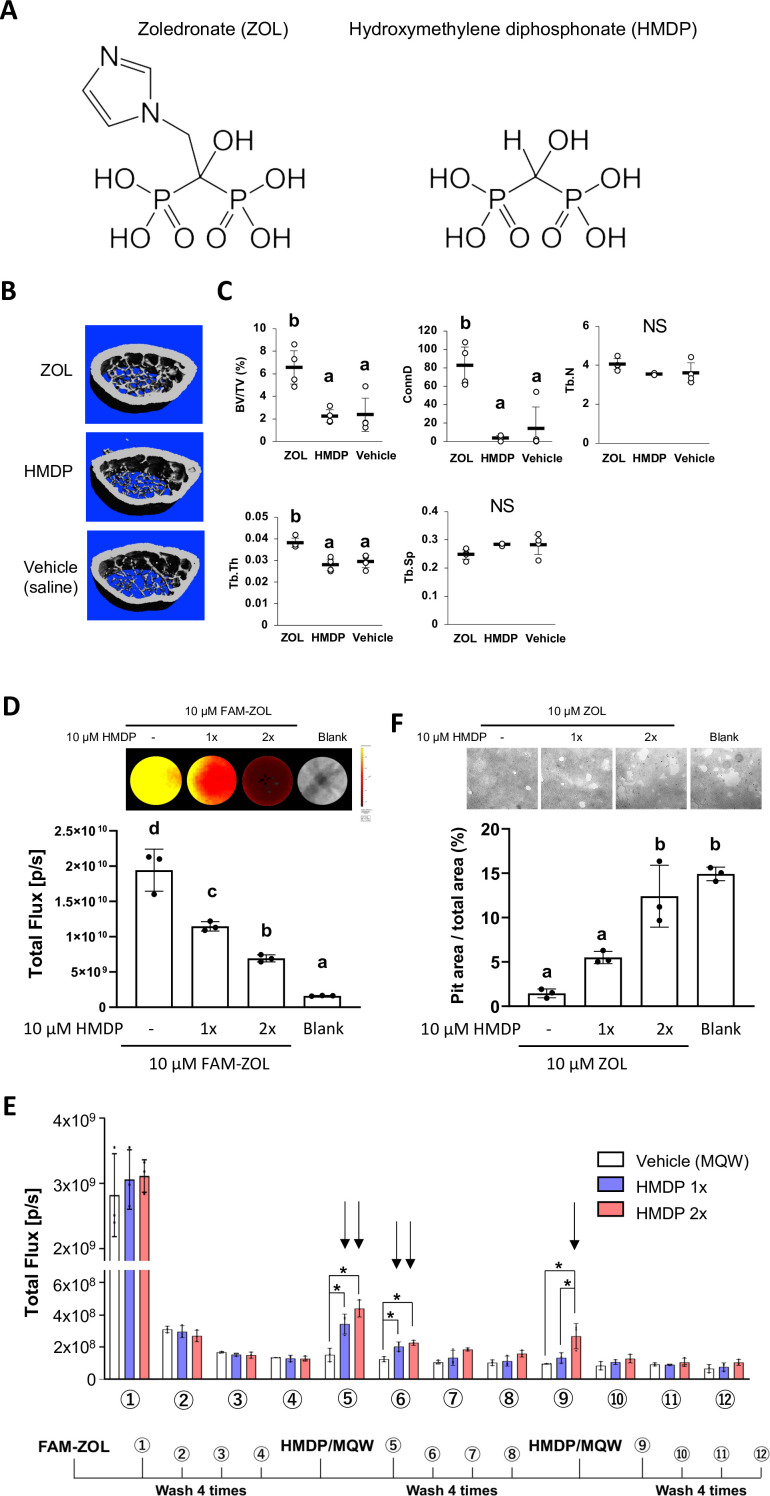
Figure 1. Competitive equilibrium-based dissociation of N-BP by low potency BP (lpBP).
(A) Chemical structures (shown as the tetraacids) of N-BP, zoledronate (ZOL) and hydroxymethylene diphosphonate (HMDP). (B) ZOL but not HMDP affects mouse femur trabecular bone architecture. Mice received a bolus intravenous injection of 100 µl ZOL (40 nmol), HMDP (40 nmol) or vehicle saline (0.9% NaCl) solutions. Femurs (n=4 per group) were harvested 3 weeks after the IV injection and subjected to Micro-CT imaging. (C) HMDP did not affect the femur trabecular bone micro-architecture, whereas ZOL increased bone volume over total volume (BV/TV), connectivity density (ConnD) and trabecular thickness (Tb.Th). Trabecular number (Tb.N) and trabecular separation (Tb.Sp) measurements were not affected by ZOL. (Figure 1—source data 1) (D) In vitro demonstration of competitive displacement of legacy N-BP. Synthetic apatite-coated wells preincubated with 10 µM of 5-carboxyfluorescein-conjugated zoledronate (FAM-ZOL) were washed with MilliQ-treated pure water (MQW), then treated with 10 µM HMDP once (1×) or twice (2×) (n=3 per group). The FAM fluorescent signal measurement indicated significant reduction of the FAM-ZOL amount on the synthetic apatite. (Figure 1—source data 2) (E) Fluorescent signal measurement of the wash solutions from the in vitro experiment in (D) demonstrated removal of FAM-ZOL by the HMDP treatments (arrows). (Figure 1—source data 3) (F) In vitro osteoclastic pit formation assay. Synthetic apatite coated wells were preincubated with 10 µM ZOL followed by 10 µM HMDP treatment 1× or 2× (n=3 per group). RAW264.7 cells (2.5×10⁴ cells per well) were then inoculated to each well in culture medium supplemented by mouse recombinant receptor activator of nuclear kappa-B ligand (RANKL). The areas of resorption pits generated by osteoclasts derived from RAW 264.7 cells were measured after 6 days of incubation and cell removal. Twice repeated HMDP treatments restored normal in vitro resorption pit formation. (Figure 1—source data 4) In (D) and (F), the graphs show the mean and SD (n=3 per group), and the Turkey test was used to analyze multiple samples. The statistical significance was determined to be at p<0.05. In (E), the graphs show the mean and SD (n=3 per group), and the Turkey test was used to analyze multiple samples within each time point. The statistical significance was determined to be at p<0.05. Different letters (e.g., a, b) are used to show statistically significant differences between multiple groups.

