Abstract
Platinum-based compounds are actively used in clinical trials as anticancer agents. In this study, two novel platinum complexes, (C1 = [PtCl2(N(SO2quin)dpa)], C2 = [PtCl2(N(SO2azobenz)dpa)]) containing quinoline and azobenzene appended dipicolylamine sulfonamide ligands were synthesized in good yield. The singlet attributable to methylene CH2 protons of the ligands of C1 and C2 appears as two doublets in 1H NMR spectra, which confirms the presence of magnetically nonequivalent protons upon coordination to platinum. Structural data of N(SO2quin)dpa (L1), N(SO2azobenz)dpa (L2) and PtCl2(N(SO2quin)dpa) confirmed the formation of the desired compounds. Time-dependent density functional theory calculations suggested that the excitation of L1 show quin-unit-based π⟶π∗ excitations (i.e., ligand-centered charge transfer, LC), while C1 shows the metal-ligand-to-ligand charge-transfer (MLLCT) character. L1 displays intense fluorescence from the 1LC excited state, while C1 gives phosphorescence from the 3LC state. Mammalian cell toxicity of ligands and complexes was assessed with NCI–H292 nonsmall-cell lung cancer cells. Further, C1 and C2 showed significantly low IC50 values compared with N(SO2azobenz)dpa and PtCl2(N(SO2quin)dpa). Fluorescence imaging data of both ligands and complexes revealed the potential fluorescence activity of these compounds for biological imaging. All four compounds are promising novel candidates that can be further investigated on their usage as potential anticancer agents and cancer cell imaging agents.
1. Introduction
The field of medicinal chemistry has paid significant attention to the design of anticancer drugs in recent years. Since the serendipitous discovery of cisplatin [1] in the 1960s, the impact of metal complexes in the treatment of cancer has been tremendous. Apart from many advantages that metal-containing complexes offer over conventional carbon-based compounds, such as the ability to coordinate ligands in a three-dimensional configuration, the interesting electronic properties that transition metals impart, enable them to serve as probes in the design of anticancer agents [2].
Platinum(II) complexes have the advantages of inertness, low coordination number and specific binding of limited centers in proteins and nucleic acids [3]. The inertness of platinum(II) complexes evades unnecessary covalent reactions with nucleotides [4]. Most platinum(II) complexes have a high affinity toward N7 of purines, specifically guanine in nucleic acids [5]. The underlying key factor of the antitumor effect of platinum-based compounds is ligand exchange kinetics. Due to slow ligand exchange behavior, the kinetic stability of the relevant platinum compounds is high; ligands oriented in the trans position are rapidly converted than those in the cis position of platinum(II) compounds [6] in complexes where cis and trans are used to designate the relative position of two identical ligands/donor atoms. Due to these important insights, platinum(II) plays a major role in the success of the antitumor activity and may perhaps still be the best single type of anticancer drug which is active against a wide range of cancers.
On the other hand, transition metal complexes have also attracted attention as intracellular sensors and bioimaging agents due to specific characteristics, such as high photostability, long-lived phosphorescence and large Stokes shifts associated with transition metals [7]. Furthermore, transition metal complexes containing π-conjugated ligands exhibit interesting two-photon absorption behavior [7]. Fluorescence probes can be widely used as visualizing agents of an individual cell or sub cellular components such as DNA [8]. When a specific fluorophore is chemically or noncovalently bound to a live cell or a sub-component of a cell, images of the behavior of the cell or the cell component may be utilized to detect the behavior of cancer cells [9].
In this study, we attempted to utilize the application of transition metal complexes both as fluorescence probes and as anticancer agents. Metal-to-ligand charge-transfer (MLCT) excitation of the transition metal complexes facilitates higher delocalization of excited electrons throughout the ligand [10]. In the presence of a heavy transition metal, Pt, for instance, spin-orbit coupling allows singlet-triplet intersystem crossing. Thus, the emission occurs from the lowest excited triplet state. Sulfonamides were chosen because sulfonamide groups are considered as a pharmacophore and are present in many biologically active molecules [11]–[15], while their most important property related to modern aspects of medicine is the ability to act as anticancer agents [16].
In designing our metal complexes, we took into consideration the lipophilic nature of dipicolylamine ligands in facilitating the uptake of metal complexes by cell membranes [17] as well as of potential characteristics that the R group (Figure 1) may impart. We note that quinoline is a pharmacologically valuable compound present in biologically active natural and synthetic compounds [18] and that interesting bioactivities, such as antibacterial, antifungal, anti-inflammatory, antimalarial as well as anticancer activities have been reported [19, 20]. The broader anticancer activity of quinoline derivatives has been used for various types of cancers, including breast, prostate, gastrointestinal tract, colon and liver [21] while quinoline-based camptothecin and its analogues have been clinically used as anticancer drugs [22].
Figure 1.
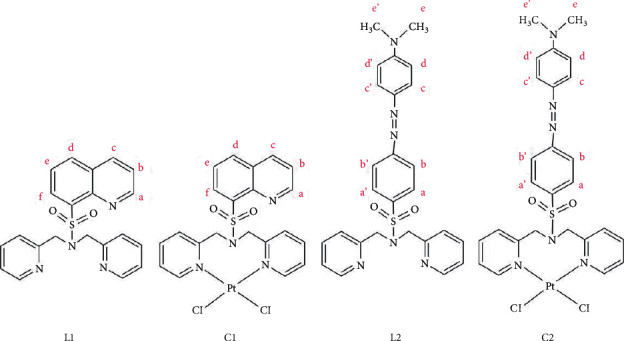
The line diagram of proposed ligands ((NSO2quin)dpa (L1), (N(SO2azobenz)dpa (L2)) and platinum complexes (PtCl2((NSO2quin)dpa) (C1), PtCl2((NSO2azobenz)dpa) (C2)).
Azobenzene shows strong electronic absorption and has thereby been used as a chromophore [23]. The most interesting property of azobenzene as a chromophore is reversible isomerization between cis and trans [23]. The important phenomena displayed by azo aromatic compounds are the incorporation of these chromophores into various molecular systems, such as polyelectrolytes, inorganics, surfaces, and biopolymers such as DNA [23]. Due to the rigid and π electrons delocalization of the aromatic ring structure of azobenzene, it can be utilized as a fluorophore.
This study explores the possibility of using Pt(II) complexes in 8-membered chelate rings toward biological applications. Herein, we report the extensive spectral characterization as well as computational studies of the compounds (Figure 1) supported by preliminary biological studies, which may guide specific research related to the dipicolylamine scaffold in the near future.
2. Experimental Section
2.1. Starting Materials
K2(PtCl4), DMSO, quinoline-8-sulfonyl chloride, 4-(dimethylamino)azobenzene-4′-sulfonyl chloride, di(2-picolyl)amine, anhydrous sodium sulfate, dioxane, methanol, dichloromethane, acetone, chromasolv water were obtained from Sigma Aldrich, USA. NCI–H292 (human nonsmall-cell lung cancer cell line) and MRC-5 (human lung fibroblast cell line) were obtained from American Type Culture Collection. All chemical compounds and solvents were of analytical grade and were used without further purification.
2.2. Methodology
1H NMR spectra were recorded in DMSO-d6 on a Bruker 400 MHz spectrometer. Peak positions are relative to tetramethylsilane (TMS) as reference. All NMR data were processed with TopSpin 3.2 and MestReNova software. Single crystals were placed in a cooled nitrogen gas stream on a Bruker Kappa Apex-II DUO diffractometer equipped with Mo Kα radiation (λ = 0.71073 Å) (N(SO2quin)dpa and [PtCl2(N(SO2quin)dpa)]) or Cu Kα (λ = 1.54184 Å) radiation (N(SO2azobenz)dpa). Refinement was performed by full-matrix least-squares methods using SHELXL (Sheldrick (2008)), with H atoms in idealized positions. Molecular graphics are drawn using ORTEP-3 for windows. Electronic spectra of the ligands and metal complexes were obtained on GENESIS 10S UV-Vis spectrophotometer. The spectral range was 190 nm–700 nm. Spectra were obtained in methanol with baseline correction. FTIR spectra were recorded on a Thermo Scientific Nicolet iS10 spectrophotometer. ATR spectra were obtained within the 4000–600 cm−1 spectral range. Spectral data were processed with OMNIC software. Emission spectra were obtained in methanol on a Thermo Scientific Lumina spectrophotometer. A 150 W Xenon lamp was used as the excitation source. Spectral data were processed with Luminous software.
2.3. Synthesis
In order to synthesize the new metal complexes, PtCl2(DMSO)2 precursor was prepared using K2[PtCl4] as the starting material according to a known procedure [24]. We followed the methods of Subasinghe et al. [25] with the sulfonyl chloride having the desired R groups in the synthesis of L1 and L2.
2.3.1. Synthesis of N(SO2quin)dpa (L1)
A solution of quinoline-8-sulfonyl chloride (0.290 g, 1.25 mmol) in 6.25 ml of dioxane was added dropwise over a period of 2 h to a solution of N(H)dpa (0.513 g, 2.5 mmol) in 25 ml of dioxane at room temperature. The reaction mixture was stirred at room temperature for 24 h and filtered to remove any precipitate. Thereafter, the dioxane was completely removed by rotary evaporation. Slightly acidic water (30 ml, pH∼5) was then added to the resulting compound, and the product was extracted into CH2Cl2 (2 × 25 ml). The CH2Cl2 extracts were combined, washed with water (2 × 25 ml) and taken to dryness to give a green color precipitate (0.417 g, 85%). FTIR (cm−1): 930 (S–N). 1H NMR signals (ppm) in DMSO-d6 are 9.01 (d, 1H), 8.48 (d, 1H), 8.38 (d, 1H), 8.24 (d, 1H), 8.21 (d, 2H, H6/H6'), 7.70–7.63 (m, 2H), 7.51 (t, 2H, H4/H4′), 7.11 (d, 2H, H3/H3'), 7.07 (t, 2H, H5/H5′), 4.81 (s, 4H, CH2). Anal. Calc. for C21H18N4O2S·CH3CN : C,64.02; H, 4.91; N, 16.23. Found: C: 64.19%, H: 4.76%, N: 15.58%. Crystals suitable for single crystal X-ray diffraction were grown by slow evaporation of the compound in acetonitrile.
2.3.2. Synthesis of PtCl2(N(SO2quin)dpa) (C1)
A solution of N(SO2quin)dpa (0.039 g, 0.1 mmol) in 10 ml of ethanol was added to a solution of PtCl2(DMSO)2 (0.042 g, 0.1 mmol) in 10 ml ethanol at room temperature. The reaction mixture was stirred at 50°C for 12–18 h and the resultant precipitate was collected on a filter paper and dried. The product was a green powder (0.035 g, 54%). FTIR (cm−1): 894 (S–N). 1H NMR signals (ppm) in DMSO-d6: 9.26 (d, 2H, H6/H6'), 9.25 (1H), 8.66–8.61 (m, 2H), 8.44 (d, 1H), 7.97 (t, 2H, H4/H4′), 7.88 (t, 1H), 7.82–7.78 (m, 1H), 7.70 (d, 2H, H3/H3'), 7.52 (t, 2H, H5/H5′), 5.95 (d, 2H, exo-H), 5.61 (d, 2H, endo-H). Anal. Calc. for C21H18Cl2N4O2PtS·H2O : C,37.4; H, 2.99; N, 8.31. Found: C: 37.59%, H: 3.23%, N: 8.48%. Crystals suitable for single-crystal X-ray diffraction were grown by mixing two solutions of the ligand and platinum precursor (12.5 mM each) in acetonitrile.
2.3.3. Synthesis of N(SO2azobenz)dpa (L2)
N(SO2azobenz) dpa ligand has been previously synthesized by a one-step reaction using THF and Et3N [26]. However, we note that the yield of the compound is significantly high in the procedure proposed herein. A solution of 4-(dimethylamino)azobenzene-4′-sulfonyl chloride (0.830 g, 2.5 mmol) in 12.5 ml of dioxane was added drop wise over a period of 2 h to a solution of N(H)dpa (1.027 g, 5 mmol) in 50 ml of dioxane at room temperature. The reaction mixture was stirred at room temperature for 24 h and then filtered to remove any precipitate. Thereafter, the dioxane was completely removed by rotary evaporation. Slightly acidic water (30 ml, pH∼5) was added to the resulting compound, and the product was extracted into CH2Cl2 (2 × 25 ml). The CH2Cl2 extracts were combined, washed with water (2 × 25 ml), and taken to dryness to give a red color precipitate (1.188 g, 98%). FTIR (cm−1): 917 (S–N). 1H NMR signals (ppm) in DMSO-d6 are 8.36 (d, 2H, H6/H6'), 7.92 (2H), 7.85–7.83 (m, 4H), 7.67 (t, 2H, H4/H4′)), 7.28 (d, 2H, H3/H3'), 7.19 (t, 2H, H5/H5′), 6.86 (d, 2H), 4.58 (s, 4H, CH2), 3.10 (s, 6H, CH3). Anal. Calc. for C26H26N6O2S : C,64.18; H, 5.39; N, 17.27. Found: C: 63.96%, H: 5.38%, N: 17.08%. Crystals suitable for single-crystal X-ray diffraction were grown by slow evaporation of the compound in methanol.
2.3.4. Synthesis of PtCl2(N(SO2azobenz)dpa) (C2)
A solution of N(SO2azobenz)dpa (0.049 g, 0.1 mmol) in 10 ml of ethanol was added to a solution of PtCl2(DMSO)2 (0.042 g, 0.1 mmol) in 10 ml ethanol at room temperature. The reaction mixture was stirred at 50 0C for 12–18 h. The resultant precipitate was collected on a filter paper and dried. The product was a dark red powder (0.046 g, 62%). FTIR (cm−1): 879 (S–N). 1H NMR signals (ppm) in DMSO-d6 are 9.26 (d, 2H, H6/H6'), 8.19 (d, 2H), 7.98 (2H), 7.97 (t, 2H, H4/H4′), 7.88 (d, 2H), 7.70 (d, 2H, H3/H3'), 7.52 (t, 2H, H5/H5′), 6.88 (d, 2H), 6.04 (d, 2H, exo-H), 5.28 (d, 2H, endo-H), 3.11 (s, 6H, CH3). Anal. Calc. for C26H26Cl2N6O2PtS·H2O : C,40.52; H, 3.66; N, 10.91. Found: C: 40.58%, H: 3.73%, N: 10.92%. Attempts to obtain crystals suitable for single-crystal X-ray diffraction were not successful.
2.4. Computational Methods
Ground state and excited state structures were fully optimized by using the Gaussian 16 program [27]. The PBE1PBE [28] functional, employing the Grimme's dispersion [29], and the Becke-Johnson damping was used for ground-state structure optimizations. The SDD [30, 31] basis set and associated effective core potentials were used for Pt. The det2-TZVP [32, 33] basis sets were applied for the remaining atoms. An implicit solvation model, specifically the polarizable continuum model (PCM) [34–36] was used with methanol (ε = 32.613) solvent. Vertical excitations and the lowest excited single and triplet states were calculated using the time-dependent density functional theory (TDDFT). For this purpose, the ωB97XD [37] functional was used. Also, the basis sets described above and the PCM were employed. The nonequilibrium PCM solvation and the equilibrium PCM solvation approaches were applied to compute the singlet vertical excitations and to optimize the excited states, respectively. For TDDFT calculations, the “UltraFine” integration grid and the two-electron integral accuracy parameter of 12 were used. Vibrational frequency calculations, at 298.15 K and 1 atm were performed to confirm that the optimized ground state or excited structures were local minima (i.e., no imaginary frequencies). Conformational analysis of L1 was performed using the GMMX method, employing the MMFF [38] force field. All located conformers were fully optimized using the PBE1PBE-D3BJ method, det2-TZVP basis sets, and the PCM in the Gaussian 16 program. The most stable conformer was used for calculating the excited states.
Drug likeness and target prediction: Predicting absorption, distribution, metabolism and excretion (ADME) is an important early step in the process of drug discovery. Structures of L1, L2, C1, and C2 were submitted to SwissADME web-based platform (https://www.swissadme.ch/) to predict the pharmacokinetics and the drug likeness of the synthesized ligands and their Pt complexes [39]. Furthermore, ligands and complexes were analyzed using SwissTargetPrediction tool (https://www.swisstargetprediction.ch/) to understand the probable macromolecular targets of them leading to their activity in vitro [40].
2.5. Biological Assays
2.5.1. Cytotoxicity Assessment
The in vitro cytotoxic effect of the synthesized novel ligands and their platinum complexes was evaluated on nonsmall-cell lung cancer cell line (NCI–H292) and human lung fibroblast cell line MRC-5 (normal lung fibroblast cells as a control) by Sulforhodamine B (SRB) assay. NCI–H292 and MRC-5 cells (5 × 10³/well) were plated in 96-well cell culture plates with Dulbecco's Modified Eagle Medium (DMEM; Sigma Aldrich D5648) supplemented with 10% fetal bovine serum (FBS) and incubated for 24 h at 37°C under 95% air with 5% CO2. The medium was then removed and replaced with the fresh medium containing different concentrations of the compound (1.25, 2.5, 5, 10, and 20 μg/ml) in triplicate. The treated plates were then incubated for 24, 48, and 72 h. After the incubation period, cells were fixed with trichloroacetic acid (TCA) solution and incubated at 4°C for 1 h. Then, the cells were washed five times with water and stained with SRB solution for 15 min at room temperature. After incubation, the dye was removed by rinsing the cells five times with 1% acetic acid and the plate was air-dried. Then unbuffered Tris-base was added to each well and the plate was placed on a shaker for 1 h at room temperature. The absorbance values were taken at 540 nm, and the result was expressed as percentage cell viability (mean of control group–mean of treated group/control group × 100%). IC50 values were calculated using the software GraphPad Prism 6.0.1.
2.5.2. Fluorescence Activity
The stained Allium cepa cells were incubated in maximum tolerable concentration (1 mg/ml) of N(SO2quin)dpa, N(SO2azobenz)dpa), and PtCl2(N(SO2azobenz)dpa in DMSO solution for 10 minutes at room temperature and observed with the aid of an Olympus BX51 epifluorescence microscope. Fluorescent micrographs were obtained with an Olympus DP70 and analyzed using Olympus Stream software.
3. Results and Discussion
3.1. Structural Results
Crystal data and structure refinement for N(SO2quin)dpa, PtCl2(N(SO2quin)dpa) and N(SO2azobenz)dpa are provided in Table 1. Key structural parameters of the ground-state optimized structures and X-ray structures are summarized in Table 2. In general, computed structures are in agreement with the X-ray structures (Figure 2). The S1-N2 bond length in the un-coordinated ligands is ∼1.62 Å (Table 2) and is comparable with the reported values in related compounds in previous studies [41, 42]. Furthermore, the S1-N2 bond length in the ligand is not significantly different from that of the platinum complex as the ligand serves as a bidentate ligand, unlike in the case of Re(CO)3 complexes having similar ligands [42] Due to the conjugation of lone pair in sulfonamide nitrogen with S=O across the S–N bond, noncoordinated or weakly coordinated sulfonamide groups show significant double bond character [43].
Table 1.
Crystal data and structure refinement for N(SO2quin)dpa (L1), PtCl2(N(SO2quin)dpa) (C1), and N(SO2azobenz)dpa (L2).
| Crystal data | N(SO2quin)dpa | PtCl2(N(SO2quin)dpa) | N(SO2azobenz)dpa |
|---|---|---|---|
| Empirical formula | C21H18N4O2S | C21H18Cl2N4O2PtS | C26H26N6O2S |
| CCDC deposition number | 2125981 | 2125982 | 2125983 |
| Formula weight | 390.45 | 689.50 | 486.59 |
| Radiation wavelength (Å) | 0.71073 | 0.71073 | 1.54184 |
| Radiation type | Mo kα | Mo kα | Cu kα |
| Crystal system | Monoclinic | Triclinic | Monoclinic |
| Space group | P21/n | P-1 | P21/c |
| Unit cell dimensions | — | — | — |
| a (Å) | 9.7633 (8) | 8.3680 (2) | 22.4999 (17) |
| b (Ǻ) | 13.3355 (11) | 10.4290 (2) | 6.0826 (5) |
| c (Ǻ) | 13.7589 (11) | 13.2551 (3) | 17.4488 (13) |
| α (deg) | — | 81.6526 (13) | — |
| β (deg) | 92.722 (2) | 88.2672 (13) | 100.973 (6) |
| γ (deg) | — | 83.0541 (13) | — |
| V (Å3) | 1789.4 | 1136.02 (4) | 2344.3 (3) |
| T (K) | 100 | 100 | 90 |
| Z | 4 | 2 | 4 |
| Density (Mg m−3) | 1.449 | 2.016 | 1.379 |
| Abs coeff (mm−1) | 0.21 | 6.54 | 1.53 |
| Crystal size (mm) | 0.43 × 0.41 × 0.12 | 0.16 × 0.15 × 0.06 | 0.17 × 0.04 × 0.01 |
| 2θmax (deg) | 72.7 | 72.9 | 128.2 |
| R[F2 > 2σ(F2)] | 0.036 | 0.031 | 0.067 |
| wR(F2) | 0.101 | 0.061 | 0.180 |
| Res. dens (e Ǻ−3) | −0.30,0.59 | −1.90, 2.84 | −0.39, 0.39 |
| Data/param | 8421/253 | 11007/280 | 3821/319 |
Table 2.
Selected bond lengths/Å and bond angles/° for N(SO2quin)dpa (L1), PtCl2(N(SO2quin)dpa) (C1), and N(SO2azobenz)dpa (L2).
| L1 | C1 | L2 | ||||
|---|---|---|---|---|---|---|
| Experimental | Calculated | Experimental | Calculated | Experimental | Calculated | |
| S1–O1 | 1.4338 (7) | 1.44 | 1.428 (2) | 1.43 | 1.432 (3) | 1.44 |
| S1–O2 | 1.4382 (6) | 1.44 | 1.433 (2) | 1.44 | 1.435 (3) | 1.44 |
| S1–N2 | 1.6225 (7) | 1.62 | 1.632(2) | 1.63 | 1.620(4) | 1.63 |
| S1–C13 | 1.7682 (8) | 1.77 | 1.763 (3) | 1.77 | 1.765 (4) | 1.76 |
| N1–C1 | 1.3398 (11) | 1.33 | 1.347 (3) | 1.34 | 1.347 (6) | 1.33 |
| N1–C5 | 1.3408 (11) | 1.33 | 1.352 (3) | 1.34 | 1.345 (5) | 1.33 |
| N2–C6 | 1.4581 (10) | 1.45 | 1.462 (3) | 1.46 | 1.469 (5) | 1.45 |
| N2–C7 | 1.4584 (10) | 1.46 | 1.469 (3) | 1.46 | 1.461 (5) | 1.45 |
| N3–C12 | 1.3412 (12) | 1.33 | 1.345 (3) | 1.34 | 1.345 (6) | 1.33 |
| N3–C8 | 1.3415 (11) | 1.33 | 1.351 (3) | 1.34 | 1.350 (5) | 1.33 |
| Pt–N1 | — | — | 2.017 (2) | 2.03 | — | — |
| Pt–N3 | — | — | 2.023 (2) | 2.03 | — | — |
| Pt–Cl2 | — | — | 2.2942 (6) | 2.32 | — | — |
| Pt–Cl1 | — | — | 2.2962 (6) | 2.32 | — | — |
| O1–S1–O2 | 118.94 (4) | 118.95 | 118.78 (13) | 118.78 | 119.19 (18) | 119.18 |
| O1–S1–N2 | 106.70 (4) | 106.70 | 106.81 (12) | 106.82 | 108.12 (19) | 108.11 |
| O2–S1–N2 | 108.44 (4) | 108.44 | 106.99 (12) | 106.98 | 106.19 (18) | 106.21 |
| C6–N2–C7 | 119.68 (6) | 119.68 | 120.80 (2) | 120.71 | 118.10 (3) | 118.07 |
| C6–N2–S1 | 119.70 (5) | 119.70 | 119.80 (17) | 119.82 | 118.90 (3) | 118.97 |
| C7–N2–S1 | 119.58 (5) | 119.59 | 117.38 (17) | 117.40 | 120.60 (3) | 120.62 |
| N1–C5–C6 | 113.19 (7) | 113.19 | 118.50 (2) | 118.51 | 116.20 (4) | 116.20 |
| C1–N1–C5 | 117.49 (8) | 117.49 | 119.30 (2) | 119.21 | 116.80 (4) | 116.85 |
| C12–N3–C8 | 117.43 (7) | 117.43 | 119.80 (2) | 119.82 | 116.50 (4) | 116.56 |
| N1–Pt1–N3 | — | — | 88.66 (8) | 88.66 | — | — |
| N3–Pt1–Cl2 | — | — | 91.02 (6) | 91.02 | — | — |
| N1–Pt1–Cl1 | — | — | 88.18 (6) | 88.18 | — | — |
Figure 2.
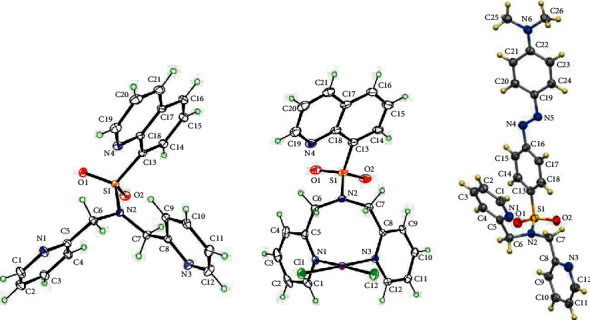
ORTEP of N(SO2quin)dpa (L1, left), PtCl2(N(SO2quin)dpa) (C1, middle), and N(SO2azobenz)dpa (L2, right). Thermal ellipsoids are drawn with 50% probability.
The structural data revealed that newly formed S–N bond has no considerable impact on existing bonds. S–O bond lengths are similar to normal sp2 hybridized S=O bond length in SO2 (∼1.43 Ǻ) [44]. Furthermore, the bond length between methylene carbon and N2 (∼1.46 Ǻ) is similar to the normal sp3 hybridized C–N bond length. The normal bond length of sulfur and carbon in sulfonamide compounds (∼1.77 Å) is similar to S–C13 bond length. The individual aromatic C–C bond length of benzene ring in quinoline group is ∼1.4 Å. Thus, the two rings in quinoline group are coplanar. Depending on the hybridization, all the other bond lengths are in normal range.
3.2. 1H NMR Characterization
The assignment of the peaks related to the dipicolylamine moiety of the novel N(SO2quin)dpa ligand was done with the aid of data from previous studies. The most downfield signal for dipicolylamine (8.21 ppm) was observed for H6/6' proton, which is adjacent to the pyridyl nitrogen. Doublets of H3/3′ and triplets of H5/5' are close to each other and the position of signals for H3/3′ and H5/5' can interchange depending on the substituent group attached to the ring. A triplet for H4/4′ was observed at 7.51 ppm due to the para position to nitrogen in pyridyl ring (Table 3).
Table 3.
Comparison of selected 1H NMR shifts of compounds in DMSO-d6.
| Product | H6/6′ | H5/5′ | H4/4′ | H3/3′ | CH2 |
|---|---|---|---|---|---|
| N(SO2quin)dpa | 8.21 | 7.07 | 7.51 | 7.11 | 4.81 |
| PtCl2(N(SO2quin)dpa) | 9.26 | 7.52 | 7.97 | 7.70 | 5.95, 5.61 |
| N(SO2azobenz)dpa | 8.36 | 7.19 | 7.67 | 7.28 | 4.58 |
| PtCl2(N(SO2azobenz)dpa) | 9.26 | 7.52 | 7.97 | 7.70 | 6.04, 5.28 |
Protons in the quinoline ring were assigned using known spectra of related compounds. More deshielded doublets for Ha proton are located in 9.01 ppm position due to Ha proton close proximity to nitrogen atom (Figure 3). The proton which is located in para position of quinoline nitrogen atom (Hc) possesses the next highest deshielded signal (8.48 ppm). Doublets of Hc and Hd are close to each other. The signal for Hf appears at 8.24 ppm, which is close to sulfur atom in sulfonyl group. In the ligand, a singlet (4.81 ppm) is observed due to protons in the methylene groups because the two methylene groups are magnetically equivalent. Peaks appearing at 3.3, 2.5, 4.8, and 3.5 ppm are due to residual solvents of water, DMSO, dichloromethane and dioxane, respectively.
Figure 3.
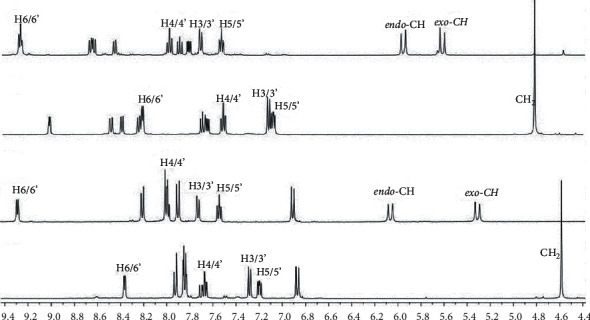
1H NMR spectra of N(SO2azobenz)dpa (a) and PtCl2 (N(SO2azobenz)dpa), (b) N(SO2quin)dpa, (c) and PtCl2 (N(SO2quin)dpa) (d) in DMSO-d6.
In 1H NMR spectra of N(SO2azobenz)dpa andPtCl2(N(SO2azobenz)dpa), doublets of Hc proton peaks appear in a more deshielded position in comparison with other protons (Figure 3). The signals for Hb and Ha protons were observed in the region of 7.85–7.83 ppm in the 1H NMR spectrum of N(SO2azobenz)dpa. In general, relatively a more upfield doublet was observed for Hd protons due to the lower effect of dimethyl groups.
3.3. FTIR Analysis
In the IR spectrum of L1, the short absorption band at 3059 cm−1 could be due to the asymmetric stretching vibration of the C–H bond in aromatic rings [45]. A narrow and short absorption band at 2856 cm−1 can be assigned to the C–H asymmetric stretching vibration of aliphatic systems. Strong absorption bands peaking at 1140 cm−1 and 1328 cm−1 correspond to the symmetric stretching vibrations and asymmetric vibrations of the O=S=O group [46], respectively. A collection of absorption peaks between 1211 cm−1 to 1590 cm−1 are due to the symmetric and asymmetric stretching vibrations of C=C bonds in aromatic rings and C=N stretching vibrations in the ligand. Stretching vibration due to the S–N bond can be obtained as a strong absorption peak at 930 cm−1 [47]. Most of the peaks in the spectrum of PtCl2(N(SO2quin)dpa) complex have slightly shifted in comparison with that of the ligand peaks. The peak due to the S–N stretching vibration of the ligand has slightly shifted to a lower frequency in the complex 894 cm−1 (Table S1, Supporting Information).
In the IR spectrum of L2, the absorption peak at 917 cm−1 was attributed to the stretching vibration of the S–N bond. The characteristic symmetric and asymmetric stretching vibrations of the O=S=O group in L2 can be observed at 1141 and 1330 cm−1, respectively. The S–N absorption peak of PtCl2(N(SO2azobenz)dpa) has shifted toward a lower frequency in comparison with that of the ligand spectrum. In a previous study where Pt is bound to dpa-sulfonamide moiety, we observed a slight shift toward lower frequency for the S–N bond upon binding to Pt [42].
3.4. UV-Visible Analysis
The spectra of N(SO2azobenz)dpa and PtCl2(N(SO2azobenz)dpa) were obtained in methanol (Figure 4). The N(SO2quin)dpa (L1) shows three absorption peaks at 215, 261, and 315 nm. Qualitatively similar absorptions bands were found for N(SO2azobenz)dpa (L2) (206, 261, and 442 nm). In the case of PtCl2(N(SO2quin)dpa) (C1) complex, three absorption peaks at 215, 275, and 314 nm were obtained. We have performed TDDFT calculations to rationalize the nature of the absorption bands.
Figure 4.
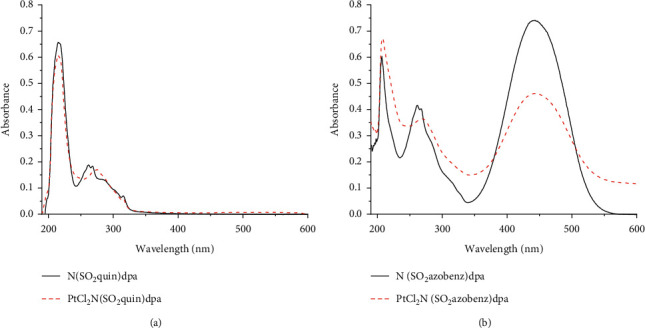
UV-visible spectra of (a) N(SO2quin)dpa (L1) and PtCl2((N(SO2quin)dpa) (C1), (b) N(SO2azobenz)dpa (L2) and PtCl2 (N(SO2azobenz)dpa) (C2) in methanol.
Kohn–Sham frontier orbitals of L1 and C1 are shown in Figure 5. HOMO of L1 is delocalized on the quin unit, while LUMO and LUMO + L are delocalized on dpa and quin units, respectively. The calculated HOMO-LUMO gap of L1 4.95 eV (250.6 nm). According to the calculated natural transition orbitals (NTOs) (see Supporting Information), the key excitation of L1 involved quin-based π⟶π∗ excitations 274 nm (f = 0.23) and 218 nm (f = 1.14), which are consistent with the experimental absorption at 261 and 215 nm. The computed dpa-based π⟶π∗ excitations occur at 229 (f = 0.16 nm), 228 (f = 0.12), 197 nm (f = 0.12), and 196 nm (f = 0.20). However, oscillator strengths of the dpa-based π⟶π∗ excitations are smaller than that of the quin-based π⟶π∗ excitations.
Figure 5.
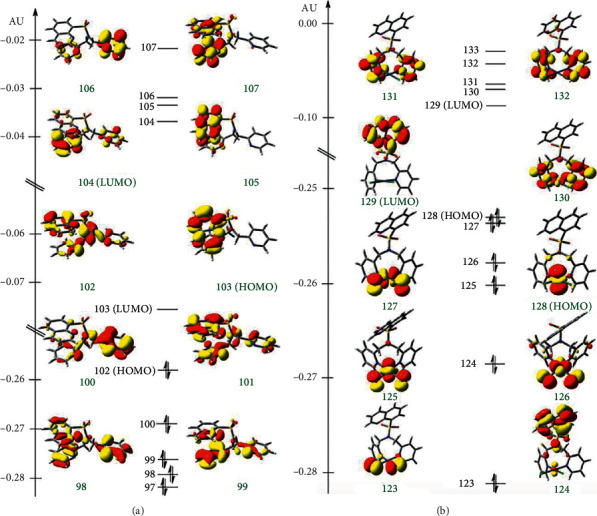
Kohn–Sham frontier orbitals of the ground-state optimized structures of (a) L1 and (b) C1.
In the case of C1, HOMO is localized on Pt and LUMO is delocalized on the quin unit. The calculated HOMO-LUMO gap of C1 is 4.71 eV (273.3 nm), and is relatively smaller than the HOMO-LUMO gap of L1. Computed NTOs suggested that the key excitation involved metal-quin to quin-π∗ charge transfer (i.e., metal-ligand-to-ligand charge transfer, MLLCT) at 228 nm (f = 1.15), which is in agreement with the experimental absorption at 215 nm.
3.5. Fluorometric Analysis
Emission spectra were obtained for N(SO2quin)dpa and PtCl2((NSO2quin)dpa) in methanol (Figure S1, Supporting Information). The concentration of the test samples was approximately 0.01 mol/dm3. The relevant excitation and emission details are summarized in Table 4. The emission of each system may be attributed to ligand-centered transitions.
Table 4.
Excitation and emission wavelengths of compounds in methanol. The excitation wavelength was 320 nm.
| Compound | Emission max. wavelength/nm |
|---|---|
| N(SO2quin)dpa (L1) | 418 |
| PtCl2(N(SO2quin)dpa) (C1) | 420 |
| N(SO2azobenz)dpa (L2) | 441 |
| PtCl2(N(SO2azobenz)dpa) (C2) | 423 |
We have optimized the lowest single excited state (S1) of L1 to obtain the emission wavelength. According to our TDDFT calculations (Supporting Information), the emission of L1 at its lowest single state occurs at 398 nm, which is in agreement with the experimental data (i.e., 418 nm). The electron density difference between the ground and the lowest singlet excited state is shown in Figure 6(a). Moreover, the charge transfer occurs at the quin unit, and therefore, the fluorescence from its lowest singlet excited state can be assigned as the ligand-centered (1LC) charge transfer.
Figure 6.
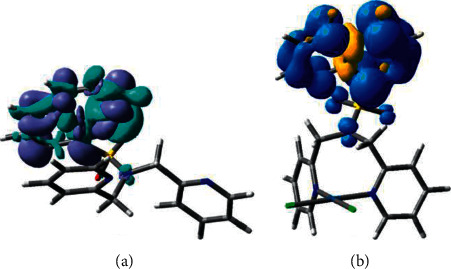
(a) The ground state and lowest singlet excited state electron density difference at the S1 optimized structure of L1. (b) Total spin density distribution of the state of C2 obtained from single-point DFT at the T1 optimized structure of C1.
In the case of C1, we have optimized the lowest excited singlet (S1) and triplet (T1) states. In C1, the presence of a heavy transition metal (i.e., Pt), the spin-orbit coupling would allow intersystem crossing between the S1 and T1 states. The calculated energy difference between the S1 and T1, 0.51 eV, is relatively large. The computed emission wavelength of the T1 state is 651 nm, which is in agreement with the experimental emission maxima (654 nm). Therefore, the emission of C1 can be assigned to phosphorescence. Starting from the T1 optimized geometry, the total spin density distribution of the triplet state, calculated as the single-point DFT (Figure 6(b)), where the two unpaired electrons are delocalized at quinoline unit. Thus, the phosphorescence of C1 is occurred as the ligand-centered (3LC) charge transfer.
Drug-likeness analysis shows that ligands obey the Lipinski's rule of five while the complexes fail only in their size factor (Supporting Information, Figure S2). Probable targets were predicted as voltage-gated potassium channel for L1 and L2 while C1 and C2 targets were predicted as Epidermal growth factor receptor and Vanilloid receptor, respectively (Supporting Information, Figures S3–S6). These predictions may explain the antiproliferative activity shown by the synthesized compounds as the targets given were experimentally shown before to lead in the anticancer drug development path [48–50].
3.6. Biological Studies
3.6.1. Emission Activity
In order to study the potential of ligands and platinum complexes as fluorophores, fluorescence microscopy images were obtained with plant cells (Allium cepa). The stained Allium cepa cells were observed under Olympus BX51 epifluorescence microscope. The obtained micrographs are shown in Figure 7.
Figure 7.
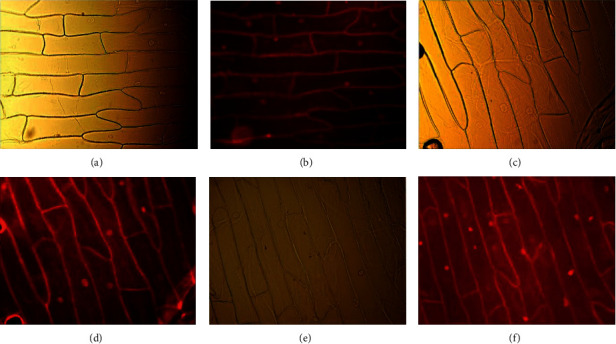
(a) Allium cepa cells incubated with (N(SO2quin)dpa) in PBS-BSA solution under the optical microscope. (b) Fluorescence micrograph of same cells excited at 550 nm. (c) Allium cepa cells incubated with (N(SO2azobenz)dpa) in PBS-BSA solution under the optical microscope. (d) Fluorescence micrograph of same cells excited at 550 nm. (e) Fluorescence micrograph of Allium cepa cells incubated with PtCl2 (N(SO2azobenz)dpa) in PBS-BSA solution, and (f) excited at 550 nm.
According to the obtained results for N(SO2quin)dpa, N(SO2azobenz)dpa ligand systems and PtCl2(N(SO2azobenz)dpa) metal complex, the cell wall and the nuclei are prominently stained after incubation with the compound. The compounds show emission under the microscope after binding with cells. This can be due to the alternation of compounds structure, such as increased in conjugation or structural rigidity.
According to fluorescence imaging results on plant cells, these compounds can interact with the nucleus of cells. Due to this reason, we can assume that these compounds may elicit cytotoxicity via genotoxic mechanisms. However, further studies are warranted to explore this mechanism of action.
3.6.2. Anticancer Activity
Sulforhodamine B assay was conducted for the synthesized compounds. NCl–H292 human lung cancer cells were exposed to compounds in a concentration gradient, and cytotoxicity was measured (Figure 8). The half-maximal inhibitory concentration (IC50) values were calculated for tested compounds (Table 5), which is a measure of the effectiveness of a tested substance in inhibiting a specific biological activity. Platinum complexes show a significant cytotoxicity compared with their respective ligands. PtCl2(N(SO2quin)dpa elicits ∼6-fold higher cytotoxic activity against NCl–H292 cells compared with N(SO2quin)dpa at 24 hours. Morphological analysis through phase contrast microscopy shows cell shrinkage, irregular cell shapes and reduction in cell volume which is indicative of apoptotic cell death (Supporting Information, Figures S7–S10). Triggering apoptotic cell death is a significant advantage for a drug lead as it reduces inflammation and damage to peripheral cells.
Figure 8.
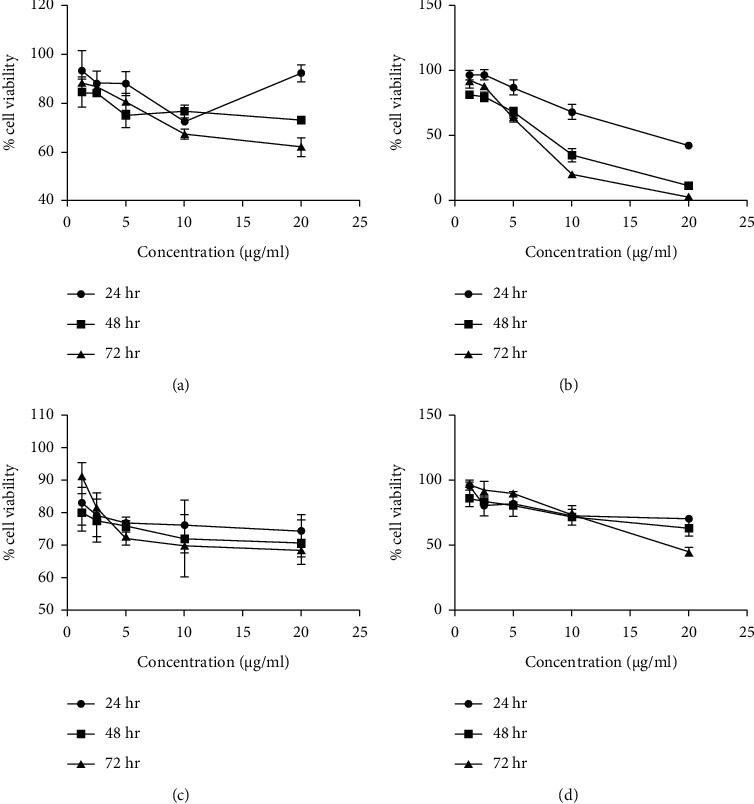
(a) The plot of percentage cell viability vs. the concentration of the compounds of (N(SO2quin)dpa), (b) PtCl2 (N(SO2quin)dpa), (c) (N(SO2azobenz)dpa), (d) PtCl2(N(SO2azobenz)dpa).
Table 5.
IC50 values reported for ligands and the complexes at 24, 48, and 72 h incubation period.
| Sample | IC50 values in μg/mL (mM) | ||
|---|---|---|---|
| 24 h | 48 h | 72 h | |
| N(SO2quin)dpa | 225 (0.58 mM) | 31.82 (0.08 mM) | 36.49 (0.09 mM) |
| PtCl2(N(SO2quin)dpa) | 37.83 (0.06 mM) | 15.94 (0.02 mM) | 9.01 (0.01 mM) |
| N(SO2azobenz)dpa | 612.4 (1.26 mM) | 17.88 (0.04 mM) | 13.95 (0.03 mM) |
| PtCl2(N(SO2azobenz)dpa) | 112.8 (0.15 mM) | 26.21 (0.03 mM) | 12.13 (0.02 mM) |
Cisplatin is a widely used anticancer drug often used to compare the potency of novel drug leads. The website https://www.cancerrxgene.org (accessed on 05/Jul/2022) provides constantly updated data on toxicity of compounds against different cell lines [51] and it reports Cisplatin as having an IC50 of 88.18 μM against NCI–H292. Comparing the IC50 values at 24 h, C1 exhibited higher toxicity than the reported value for Cisplatin, whereas C2 exhibited a 1.7-fold lower activity. This is indicative of the promising potency of the newly synthesized compounds as novel anticancer drug leads. However, L1 ligand-treated cells appear to have started recovering at 72 h. This is not observed with its Pt complex (C1) or the other two compounds (L2 and C2), which further shows their potential to act as anticancer drug leads.
4. Conclusions
Two novel platinum complexes as well a novel ligand and a previously studied ligand of which we report a better yield, were synthesized in good yield and characterized using 1H NMR, UV-visible, FTIR and fluorescence spectroscopy. The compounds N(SO2quin)dpa), [PtCl2(N(SO2quin)dpa)], and N(SO2azobenz)dpa were characterized using single-crystal X-ray diffraction. All compounds were evaluated for their fluorescent imaging ability.
Based on our computational data, we concluded that the quinolene unit-based charge transfer of L1 leads to fluorescence, and quinolene unit-based charge transfer of C1 gives rise to phosphorescence. The fluorescence imaging studies on plant cells revealed that the compounds might be good candidates to be utilized in fluorescence imaging applications, where they clearly associate with the cell nucleus. The metal complexes demonstrated to have high cytotoxicity in comparison with the relevant ligand systems. Reported ligands and their Pt complexes show promising potential to be further studied as potential anticancer drug leads.
Acknowledgments
This work was supported by Grant no. ASP/01/RE/SCI/2018/21 of the University of Sri Jayewardenepura with the support for instrumentation from the Instrument Center and the Material Center of the University of Sri Jayewardenepura. Supercomputing resources at the Academic Center for Computing at Media Studies at Kyoto University in Japan and the Institute of Molecular Science in Japan are also acknowledged. Youhei Takada of Osaka University is acknowledged for carrying out elemental analysis data.
Data Availability
The data used to support the findings of this study are included within the article.
Conflicts of Interest
The authors declare that they have no conflicts of interest.
Authors' Contributions
CM carried out the synthesis, purification, and characterization of the compounds. TD carried out the fluorescence studies and initial writing of manuscript together with CM. WMCS carried out the computational study. FRF carried out the X-ray data collection and structure determination. ICP designed and SRS carried out the biological experiments. TP designed and conceived the study and finalized the manuscript. All authors read and approved the final manuscript.
Supplementary Materials
Supporting information for this article is available with the submitted manuscript; tabulated IR peaks of ligands and their metal complexes, emission spectra of L1, L2, C1, and C2 obtained in methanol, TDDFT results, SwissADME predictions of pharmacokinetic properties and predicted targets of L1, L2, C1, and C2, and morphology of MRC-5 cells and human lung cancer cells (NCl–H292) after 24, 48, and 72 h incubating with L1, C1, L2, and C2 in increasing concentrations are available.
References
- 1.Rosenberg B., Vancamp L., Trosko J. E., Mansour V. H. Platinum compounds a new class of potent antitumour agents. Nature . 1969;222(5191):385–386. doi: 10.1038/222385a0. [DOI] [PubMed] [Google Scholar]
- 2.Michael Frezza1 S. H., Davenport1 A., Schmitt S., Dajena T., Dou Q. P. Novel Metals and Metal Complexes as Platforms for Cancer Therapy. Current Pharmaceutical Design . 2010;16 doi: 10.2174/138161210791209009. [DOI] [PMC free article] [PubMed] [Google Scholar]
- 3.Maheshwari V., Bhattacharyya D., Fronczek F. R., Marzilli P. A., Marzilli L. G. Chemistry of HIV-1 virucidal pt complexes having neglected bidentate sp2 N-donor carrier ligands with linked triazine and pyridine rings. synthesis, NMR spectral features, structure, and reaction with guanosine. Inorganic Chemistry . 2006;45(18) doi: 10.1021/ic060605h. [DOI] [PubMed] [Google Scholar]
- 4.Cusumano M., Di Pietro M. L., Giannetto A., Vainiglia P. A. The intercalation to DNA of bipyridyl complexes of platinum (II) with thioureas. Journal of Inorganic Biochemistry . 2005;99(2):560–565. doi: 10.1016/j.jinorgbio.2004.11.002. [DOI] [PubMed] [Google Scholar]
- 5.Wang D., Lippard S. J. Cellular processing of platinum anticancer drugs. Nature Reviews Drug Discovery . 2005;4(4):307–320. doi: 10.1038/nrd1691. [DOI] [PubMed] [Google Scholar]
- 6.Coluccia M., Natile G. Trans-platinum complexes in cancer therapy. Anti-Cancer Agents in Medicinal Chemistry . 2007;7(1):111–123. doi: 10.2174/187152007779314080. [DOI] [PubMed] [Google Scholar]
- 7.Lo K. K.-W. Luminescent rhenium (I) and iridium (III) polypyridine complexes as biological probes, imaging reagents, and photocytotoxic agents. Accounts of Chemical Research . 2015;48(12) doi: 10.1021/acs.accounts.5b00211. [DOI] [PubMed] [Google Scholar]
- 8.Amoroso A. J., Coogan M. P., Dunne J. E., et al. Rhenium fac tricarbonyl bisimine complexes: biologically useful fluorochromes for cell imaging applications. Chemical Communications . 2007;29 doi: 10.1039/b706657k. [DOI] [PubMed] [Google Scholar]
- 9.Zhang R. R., Schroeder A. B., Grudzinski J. J., et al. Beyond the margins real-time detection of cancer using targeted fluorophores. Nature Reviews Clinical Oncology . 2017;14(6):347–364. doi: 10.1038/nrclinonc.2016.212. [DOI] [PMC free article] [PubMed] [Google Scholar]
- 10.McPhie P. Principles of fluorescence dpectroscopy. 2000. https://link.springer.com/book/10.1007/978-0-387-46312-4 .
- 11.Drews J. Drug discovery a historical perspective. Science . 2000;287(5460) doi: 10.1126/science.287.5460.1960. [DOI] [PubMed] [Google Scholar]
- 12.Owa T., Nagasu T. Novel sulphonamide derivatives for the treatment of cancer. Expert Opinion on Therapeutic Patents . 2000;10(11) doi: 10.1517/13543776.10.11.1725. [DOI] [Google Scholar]
- 13.Supuran C. T., Scozzafava A. Applications of carbonic anhydrase inhibitors and activators in therapy. Expert Opinion on Therapeutic Patents . 2002;12(2):217–242. doi: 10.1517/13543776.12.2.217. [DOI] [Google Scholar]
- 14.Supuran C. T., Scozzafava A., Casini A. Carbonic anhydrase inhibitors. Medicinal Research Reviews . 2003;23(2):146–189. doi: 10.1002/med.10025. [DOI] [PubMed] [Google Scholar]
- 15.Ogden R. C., Flexner C. W. Protease inhibitors in AIDS therapy. 2001. https://books.google.co.in/books/about/Protease_Inhibitors_in_AIDS_Therapy.html?id=Oqx0L0gKXKIC&redir_esc=y .
- 16.Scozzafava A., Owa T., Mastrolorenzo A., Supuran C. Anticancer and antiviral sulfonamides. Current Medicinal Chemistry . 2003;10(11):925–953. doi: 10.2174/0929867033457647. [DOI] [PubMed] [Google Scholar]
- 17.Desbouis D., Struthers H., Spiwok V., Kuster T., Schibli R. Synthesis, in vitro, and in silico evaluation of organometallic technetium and rhenium thymidine complexes with retained substrate activity toward human thymidine kinase type 1. Journal of Medicinal Chemistry . 2008;51(21) doi: 10.1021/jm800530p. [DOI] [PubMed] [Google Scholar]
- 18.Eicher T., Hauptmann S., Speicher A. The Chemistry of Heterocycles: Structures, Reactions, Synthesis, and Applications . Spring Garden Philadelphia: John Wiley & Sons; 2013. [Google Scholar]
- 19.Chen Y.-L., Huang C. J., Huang Z. Y., et al. Synthesis and antiproliferative evaluation of certain 4-anilino-8-methoxy-2-phenylquinoline and 4-anilino-8-hydroxy-2-phenylquinoline derivatives. Bioorganic and Medicinal Chemistry . 2006;14(9) doi: 10.1016/j.bmc.2005.12.017. [DOI] [PubMed] [Google Scholar]
- 20.Chen Y.-L., Zhao Y. L., Lu C. M., Tzeng C. C., Wang J. P. Synthesis, cytotoxicity, and anti-inflammatory evaluation of 2-(furan-2-yl)-4-(phenoxy) quinoline derivatives. Part 4. Bioorganic and Medicinal Chemistry . 2006;14(13) doi: 10.1016/j.bmc.2006.02.039. [DOI] [PubMed] [Google Scholar]
- 21.Adsule S., Barve V., Chen D., et al. Novel Schiff base copper complexes of quinoline-2 carboxaldehyde as proteasome inhibitors in human prostate cancer cells. Journal of Medicinal Chemistry . 2006;49(24) doi: 10.1021/jm060712l. [DOI] [PubMed] [Google Scholar]
- 22.Wall M. E., Wani M. C., Cook C. E., Palmer K. H., McPhail A. T., Sim G. A. Plant antitumor agents. I. The isolation and structure of camptothecin, a novel alkaloidal leukemia and tumor inhibitor from camptotheca acuminata. Journal of the American Chemical Society . 1966;88(16) doi: 10.1021/ja00968a057. [DOI] [Google Scholar]
- 23.El Halabieh R. H., Mermut O., Barrett C. J. Using light to control physical properties of polymers and surfaces with azobenzene chromophores. Pure and Applied Chemistry . 2004;76(7-8) doi: 10.1351/pac200476071445. [DOI] [Google Scholar]
- 24.Bharti N. Synthesis, crystal structure, and enhancement of the efficacy of metronidazole against Entamoeba histolytica by complexation with palladium (II), platinum (II), or copper (II) Helvetica Chimica Acta . 2002;85(9) [Google Scholar]
- 25.Subasinghe A., Perera I. C., Pakhomova S., Perera T. Synthesis, characterization, and biological studies of a piperidinyl appended dipicolylamine ligand and its rhenium tricarbonyl complex as potential therapeutic agents for human breast cancer. Bioinorganic Chemistry and Applications . 2016;2016:10. doi: 10.1155/2016/2675937.2675937 [DOI] [PMC free article] [PubMed] [Google Scholar]
- 26.Jose D. A., Mishra S., Ghosh A., Shrivastav A., Mishra S. K., Das A. Colorimetric sensor for ATP in aqueous solution. Organic Letters . 2007;9(10) doi: 10.1021/ol0705797. [DOI] [PubMed] [Google Scholar]
- 27.Frisch M. J., Schlegel H. B., Scuseria G. E., et al. Gaussian, Gaussian 16 (RevC.01) Wallingford CT: Inc; 2016. [Google Scholar]
- 28.Perdew J. P., Burke K., Ernzerhof M. Generalized gradient approximation made simple. Physical Review Letters . 1996;77(18) doi: 10.1103/physrevlett.77.3865. [DOI] [PubMed] [Google Scholar]
- 29.Grimme S., Ehrlich S., Goerigk L. Effect of the damping function in dispersion corrected density functional theory. Journal of Computational Chemistry . 2011;32(7) doi: 10.1002/jcc.21759. [DOI] [PubMed] [Google Scholar]
- 30.Dunning T. H., Hay P. J. Methods of Electronic Structure Theory . Spring New York NY: Plenum Press; 1977. [Google Scholar]
- 31.Fuentealba P., Preuss H., Stoll H., Von Szentpaly L. A proper account of core-polarization with pseudopotentials: single valence-electron alkali compounds. Chemical Physics Letters . 1982;89(5):418–422. doi: 10.1016/0009-2614(82)80012-2. [DOI] [Google Scholar]
- 32.Weigend F., Ahlrichs R. Balanced basis sets of split valence, triple zeta valence and quadruple zeta valence quality for H to Rn: design and assessment of accuracy. Physical Chemistry Chemical Physics . 2005;7(18) doi: 10.1039/b508541a. [DOI] [PubMed] [Google Scholar]
- 33.Weigend F. Accurate Coulomb-fitting basis sets for H to Rn. Physical Chemistry Chemical Physics . 2006;8(9) doi: 10.1039/b515623h. [DOI] [PubMed] [Google Scholar]
- 34.Miertuš S., Scrocco E., Tomasi J. Electrostatic interaction of a solute with a continuum. A direct utilizaion of AB initio molecular potentials for the prevision of solvent effects. Chemical Physics . 1981;55(1):117–129. doi: 10.1016/0301-0104(81)85090-2. [DOI] [Google Scholar]
- 35.Pascual‐Ahuir J.-L., Silla E., Tunon I. GEPOL: An improved description of molecular surfaces. III. A new algorithm for the computation of a solvent‐excluding surface. Journal of Computational Chemistry . 1994;15(10) doi: 10.1002/jcc.540151009. [DOI] [Google Scholar]
- 36.Miertus S., Tomasi J. Approximate evaluations of the electrostatic free energy and internal energy changes in solution processes. Chemical Physics . 1982;65(2):239–245. doi: 10.1016/0301-0104(82)85072-6. [DOI] [Google Scholar]
- 37.Chai J.-D., Head-Gordon M. Long-range corrected hybrid density functionals with damped atom–atom dispersion corrections. Physical Chemistry Chemical Physics . 2008;10(44) doi: 10.1039/b810189b. [DOI] [PubMed] [Google Scholar]
- 38.Halgren T. A., Nachbar R. B. Merck molecular force field. IV. Conformational energies and geometries for MMFF94. Journal of Computational Chemistry . 1996;17(5-6):587–615. doi: 10.1002/(sici)1096-987x(199604)17:5/6<587::aid-jcc4>3.0.co;2-q. [DOI] [Google Scholar]
- 39.Daina A., Michielin O., Zoete V. SwissADME a free web tool to evaluate pharmacokinetics, drug-likeness and medicinal chemistry friendliness of small molecules. Scientific Reports . 2017;7(1) doi: 10.1038/srep42717. [DOI] [PMC free article] [PubMed] [Google Scholar]
- 40.Daina A., Michielin O., Zoete V. SwissTargetPrediction updated data and new features for efficient prediction of protein targets of small molecules. Nucleic Acids Research . 2019;47(W1) doi: 10.1093/nar/gkz382. [DOI] [PMC free article] [PubMed] [Google Scholar]
- 41.Darshani T., Thushara N., Weerasuriya P., Fronczek F. R., Perera I. C., Perera T. Fluorescent di-(2-picolyl) amine based drug-like ligands and their Re (CO) 3 complexes towards biological applications. Polyhedron . 2020;185 doi: 10.1016/j.poly.2020.114592.114592 [DOI] [Google Scholar]
- 42.Thushara N., Darshani T., Samarakoon S. R., et al. Synthesis, characterization and biological evaluation of dipicolylamine sulfonamide derivatized platinum complexes as potential anticancer agents. RSC Advances . 2021;11(29) doi: 10.1039/d1ra00842k. [DOI] [PMC free article] [PubMed] [Google Scholar]
- 43.Perera T., Abhayawardhana P., Marzilli P. A., Fronczek F. R., Marzilli L. G. Formation of a metal-to-nitrogen bond of normal length by a neutral sufonamide group within a tridentate ligand. A new approach to radiopharmaceutical bioconjugation. Inorganic Chemistry . 2013;52(5) doi: 10.1021/ic302180t. [DOI] [PMC free article] [PubMed] [Google Scholar]
- 44.Allen F. H., Kennard O., Watson D. G., Brammer L., Orpen A. G., Taylor R. Tables of bond lengths determined by X-ray and neutron diffraction. Part 1. Bond lengths in organic compounds. Journal of the Chemical Society, Perkin Transactions . 1987;2(12) doi: 10.1039/p298700000s1. [DOI] [Google Scholar]
- 45.Lambert J. B. Group Frequencies: Infrared and Raman. Introduction to Organic Spectroscopy . Stuttgart Germany: Macmillan Publishing Company; 1987. [Google Scholar]
- 46.Socrates G. Infrared and Raman Characteristic Group Frequencies: Tables and Charts . Spring Garden Philadelphia: John Wiley & Sons; 2004. [Google Scholar]
- 47.Tanaka Y., Tanaka Y. Infrared absorption spectra of organic sulfur compounds. II. Studies on SN stretching bands of methanesulfonamide derivatives. Chemical and Pharmaceutical Bulletin . 1965;13(7):858–861. doi: 10.1248/cpb.13.858. [DOI] [PubMed] [Google Scholar]
- 48.Serrano-Novillo C., Capera J., Colomer-Molera M., Condom E., Ferreres J., Felipe A. Implication of voltage-gated potassium channels in neoplastic cell proliferation. Cancers . 2019;11(3):p. 287. doi: 10.3390/cancers11030287. [DOI] [PMC free article] [PubMed] [Google Scholar]
- 49.Yewale C., Baradia D., Vhora I., Patil S., Misra A. Epidermal growth factor receptor targeting in cancer: a review of trends and strategies. Biomaterials . 2013;34(34) doi: 10.1016/j.biomaterials.2013.07.100. [DOI] [PubMed] [Google Scholar]
- 50.Li L., Chen C., Chiang C., et al. The impact of TRPV1 on cancer pathogenesis and therapy: a systematic review. International Journal of Biological Sciences . 2021;17(8) doi: 10.7150/ijbs.59918. [DOI] [PMC free article] [PubMed] [Google Scholar]
- 51.Yang W., Soares J., Greninger P., et al. Genomics of Drug Sensitivity in Cancer (GDSC): a resource for therapeutic biomarker discovery in cancer cells. Nucleic Acids Research . 2012;41(D1) doi: 10.1093/nar/gks1111. [DOI] [PMC free article] [PubMed] [Google Scholar]
Associated Data
This section collects any data citations, data availability statements, or supplementary materials included in this article.
Supplementary Materials
Supporting information for this article is available with the submitted manuscript; tabulated IR peaks of ligands and their metal complexes, emission spectra of L1, L2, C1, and C2 obtained in methanol, TDDFT results, SwissADME predictions of pharmacokinetic properties and predicted targets of L1, L2, C1, and C2, and morphology of MRC-5 cells and human lung cancer cells (NCl–H292) after 24, 48, and 72 h incubating with L1, C1, L2, and C2 in increasing concentrations are available.
Data Availability Statement
The data used to support the findings of this study are included within the article.


