Abstract
The vascular function curve (VFC) in cardiovascular physiology describes the relationship between the steady state venous return (VR in L/min, in the Y-axis) and the steady state right atrial pressure (RAP in mmHg, in the X-axis). However, in some literature, the RAP is considered the independent variable (IV) and the VR the dependent variable (DV), whereas in other literature, the VR is the IV and the RAP the DV. Because of this confusion, when the VFC is combined with the cardiac function curve (CFC), which describes the relationship between the steady state cardiac output and the RAP, it is not strange that the interpretations of the combination are problematic. Hence, in this article, we will trace the origin of the inconsistency, differentiate the VFC into two types based on who created them, and differentiate the RAP into RAP as the IV and DV respectively. Through these in-depth analyses, the confusion will be clarified and new insights into the combination of a VFC with the CFC will develop.
Keywords: Vascular function curve, cardiac function curve, right atrial pressure, cardiac cycle, preload, afterload
Introduction
The vascular function curve (VFC) was first plotted and introduced by Guyton in the 1950s [1-3]. With the assumption that the right atrial pressure (RAP) might exert a back pressure to venous return (VR), they created their experimental setting to study how the steady state VR (measured in L/min) changes in response to the increases in the steady state RAP. In order to manipulate the steady state RAP as the independent variable (IV), they used an artificial pump to replace the right ventricle of experimental dogs and inserted a horizontal, collapsible thin rubber tubing between the right atrium and the artificial pump such that the thin tubing was downstream to the right atrium but upstream to the artificial right ventricle (the artificial pump). In this way, the VR to the right atrium was artificially pumped into the pulmonary artery. The pumping rate was adjusted to make the thin tubing in a semi-collapsed condition, which made the blood pressure in the tubing to be zero mmHg. By elevating or lowering the horizontal tubing, the steady state RAP could be made to increase or decrease. Corresponding to the increases or decreases in the RAP, the pumping rate was always re-adjusted to make the tubing semi-collapsed. What they observed was that along with the elevation of the RAP, the steady state VR decreased [1-3]. The VFC was plotted based on their experimental data to illustrate this relationship: The steady-state VR (L/min) was plotted in the Y-axis and the steady state RAP (measured in mmHg) in the X-axis. By convention, the steady state RAP is the IV and the steady state VR the dependent variable (DV). Hence, Guyton’s results seemed to suggest the following: The higher the steady state RAP, the less the steady state VR. However, the way Guyton manipulated the RAP to be the IV by changing the height of the thin tubing was confusing; and repeatedly adjusting the pumping rate makes it more difficult to figure out which one was their IV. Was it the RAP, VR (equal to the pumping rate), or the adjustable height of the thin tubing?
Guyton also plotted the cardiac function curve (CFC), with which the steady state cardiac output (CO in L/min) is the function of the steady state RAP [1,2]. Furthermore, they combined their VFC and CFC in the same coordinates and considered the intersection of the two curves the operating point of the heart [1-3].
In 1979, Levy simplified Guyton’s experimental setting by removing the thin tubing Guyton used and replotted the VFC [4]. Levy plotted the VFC by changing the pumping rate of the artificial pump to various steady states and then measuring the steady state RAP that corresponded to each steady state CO. When the CO is in steady state, the VR must also be in steady state, and steady state VR = steady state CO. Similar to Levy’s paper [4], in this article, Q is used to represent the steady state blood flow measured in L/min in the cardiovascular loop, which equals the steady state VR or steady state CO. According to Levy, the Q should be the IV of the VFC and the steady state RAP the DV. Levy’s argument about the IV and DV was supported by Beard and Feigl in 2011 [5]. These two authors also suggested to remove the content of the VFC and its combination with the CFC from textbooks.
Based on both Guyton’s and Levy’s experiments, it is clear now that in order to manipulate the RAP to be the IV, a third variable (such as the height of the thin tubing) must be used. Without the third variable, RAP can only serve as the DV as shown in Levy’s experiment. In our opinion, 1) the height of the thin tubing in the Guyton’s experiment was the IV, whereas the RAP was the DV of this height; and 2) the role of pumping rate is confounding thus unclear because it was manipulated after a change in the height of the thin tubing.
Because of the history above, great inconsistency exits in the literature despite Beard and Feigl’s’ suggestion to remove this content from textbooks: Some express the RAP as the IV of the VFC by convention possibly because it is plotted in the X-axis [6-10], others explicitly [11,12] or implicitly introduced the RAP as the DV [13]. Overall, because of different understandings about the role of the RAP in the VFC, the current interpretations of the VFC and its combination with the CFC in the literature are inconsistent and confusing.
In this article, we will analyze the causal relationship between the Q and RAP in depth by 1) differentiating Guyton’s VFC and Levy’s VFC, 2) differentiating the RAP into RAP as the IV and DV respectively. By so doing, confusion will be clarified and new insights into the combination of the VFC with the CFC will develop.
Differentiating Guyton’s VFC and Levy’s VFC
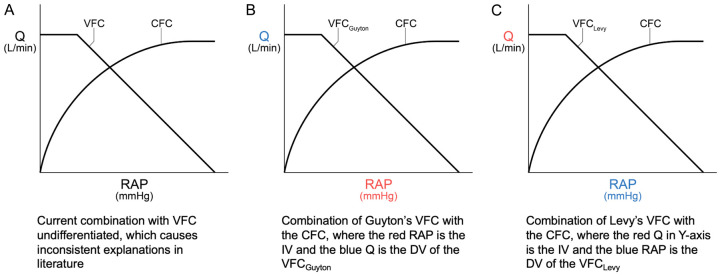
In our opinion, Levy did not simplify Guyton’s experiment as he initially thought, but instead conducted a different experiment altogether. Thus, if we assume that Guyton’s experiment indeed has the RAP as the IV, then Guyton’s and Levy’s VFCs need to be differentiated and combined with the CFC respectively (Figure 1).
Figure 1.
Differentiation of the vascular function curves (VFCs) by their creators and their combination with the cardiac function curve (CFC) respectively. Q = steady state cardiac output = steady state venous return measured in L/min. RAP in each X-axis is steady state RAP.
It is obvious that in a closed cardiovascular circuit, the two different IV-DV (or cause-effect) relationships of the VFCs can both stand independently. The rationale for combining each with the CFC respectively will be discussed in the next section.
Differentiating the RAP into RAP as the IV and DV respectively
Facing the confusion outlined above, we must determine under what circumferences the RAP serves as the IV (RAPIV) and DV (RAPDV) respectively by exploring what factors may cause changes (such as an increase) in the RAP. Obviously, either an increase in preload of the RAP (i.e., an increase in the VR) or an increase in afterload (e.g., a weak or failing right heart, tricuspid stenosis, left-to-right shunt) may cause an increase in the RAP. Hence, RAPIV needs to be further differentiated into RAPIV(preload) and RAPIV(afterload). We can then analyze the following three cause-effect relationship pairs during cardiac cycles: RAPIV(preload)-SVDV, SVIV-RAPDV, and RAPIV(afterload)-SVDV, where SV refers to stroke volume measured in ml per beat, not the Q measured in L/min. Understanding these three relationships is pivotal to understanding when and how the RAP serves as RAPIV(preload), RAPDV, and RAPIV(afterload) respectively.
RAPIV(preload)-SVDV relationship
This relationship is illustrated logically in Figure 2: In response to increases in the steady state RAP (due to increases in the steady state VR) during cardiac cycles, the steady state right ventricular pressure (RVP) increases, which leads to increases in the left atrial pressure and left ventricular pressure (LVP), followed by the increases in the steady state SV in both right and left heart. Obviously, it is the Frank-Starling mechanism that mainly underlies this relationship in both right and left heart. While an increase in the RAPIV(preload) may also cause an increase in the heart rate reflexively, i.e., Bainbridge reflex [14], in this article, for the convenience of logic reasoning and comparison, we assume that the heart rate remains constant irrespective of whether we are dealing with the Q (L/min) or SV (ml per beat).
Figure 2.
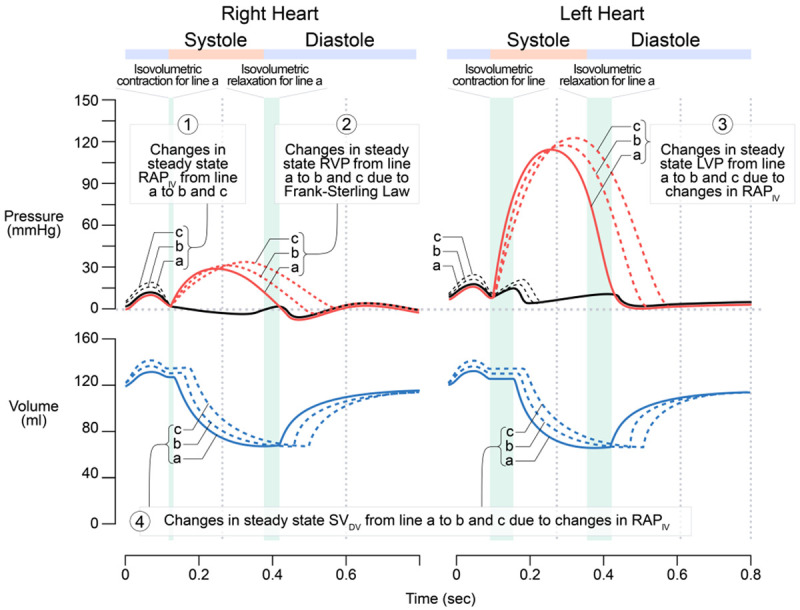
The relationship between the steady state stroke volume (SV) as the dependent variable (DV) and the steady state right atrial pressure (RAP) as the independent variable (IV) during cardiac cycles. Based on the Frank-Starling mechanism, the greater the RAP (i.e., the preload), the greater the left ventricular pressure, thus the greater the SV. In order to show that the left atrial pressure (LAP) is slightly higher than that of the right atrial pressure (RAP), the drawing of the LAP from a to b, and c is exaggeratedly higher than their normal values.
SVIV-RAPDV relationship
This can be reasoned out according to Levy’s experiments and results (Figure 3). In response to the increases in the steady state SV due to the increases in the steady state LVP and RVP (i.e., positive inotropism), the steady state RAP decreases.
Figure 3.
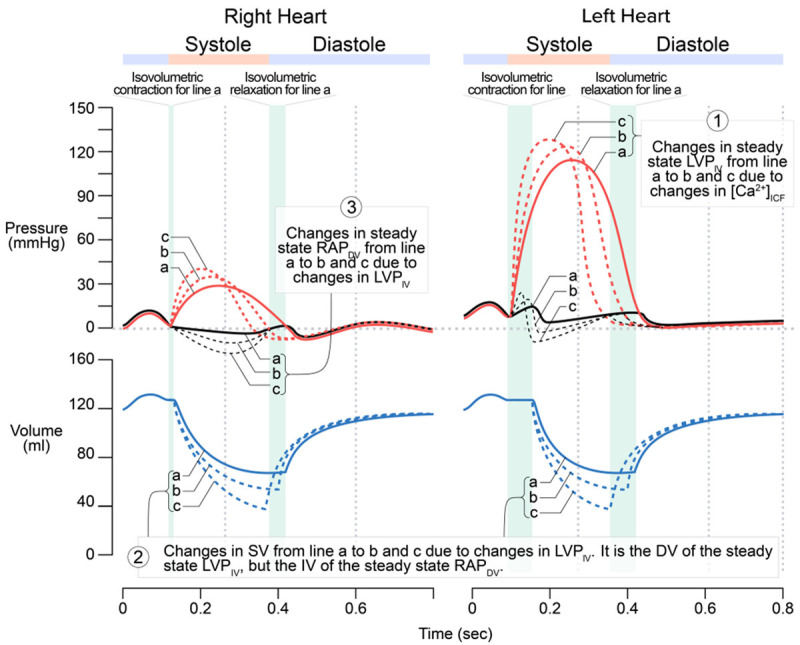
The relationship between the steady state RAP as the dependent variable (DV) and the steady state LVP representing steady state SV as the independent variable (IV). The greater the LVP (as well as the RVP) due to positive inotropism, the greater the SV, and the lower the RAP. Similar to that in Figure 2, the changes in LAP (lines a, b, and c) are exaggerated. A secondary effect may result due to the greater SV or VR (not shown), which increases the preload to both right and left heart, thus leads to the shift of the right and left ventricular pressure curves upward and right-ward. It should be noted that in both Guyton’s and Levy’s experiments, the left heart was not stimulated as shown in Figure 3; the right heart was replaced by an artificial pump. Hence, manipulating the pumping rate to increase SV is equivalent to a positive inotropic effect on the right heart (not left heart) only.
Based on Figures 2 and 3, the following three points become clear:
● If the RAP serves as the IV (RAPIV(preload)), it must be prior to the ventricular contraction, i.e., RAPIV(preload) ≈ RAPt0.1 in Figure 2, where the subscript t0.1 refers to that the positive peak time of RAPIV is about 0.1 s in the cardiac cycle. In the normal physiological conditions, only an increase in the VR can cause an increase in the RAPt0.1.
● If the RAP serves as the DV (RAPDV), it must be after the ventricular isovolumetric contraction and before the isovolumetric relaxation, i.e., RAPDV ≈ RAPt0.25, where the subscript t0.25 refers to 0.25 s (the negative peak time) in the X-axis of the cardiac cycle in Figure 3. In other words, the negative peak of RAPDV has about 0.1 to 0.3 seconds delay to the positive peak of RAPIV(preload).
● The RAP can serve as the IV (t = 0.1 s) and DV (t = 0.25 s) successively during the same cardiac cycle, but cannot serve as both concurrently.
RAPIV(afterload)-SVDV relationship
This relationship can be understood from the physiological and pathophysiological perspectives respectively. Physiologically, the cardiovascular system is composed of a closed circuit with two pumps in series: the left heart and the right heart. From the aorta to the right atrium, blood pressure decreases from about 100 mmHg (high energy) to around 2 mmHg (low energy). If the lowest pressures during ventricular filling in the ventricles (~0 mmHg) is not taken into account, the RAP is the lowest in the entire cardiovascular loop. Meanwhile, about 80% of the ventricular filling is due to ventricular suction of the blood, whereas the atrial contraction only contributes 20% [15]. Hence, in normal conditions, by logic, the RAP (the lowest pressure) is less likely to exert a back pressure to the VR with higher pressure. If the RAP does exert a back pressure to the VR, it should not be significant in normal conditions. This is true in real life according to Guyton and Jones [16]. As the RAP is the lowest pressure, it is most likely to be passively influenced by other factors rather than actively causing changes in another variable. This explains why in Guyton’s experiment, the RAP could not serve as the IV directly, but was manipulated by another variable (the height of the thin tubing) and why in Levy’s experiment, the RAP could only be the DV. Considering the RAP to be the IV seems inappropriate in the epistemology and methodology in the study of the relationship between Q and the RAP.
Pathophysiologically, several chronic conditions may increase the afterload of the right atrium (such as a weak or failing right heart, tricuspid stenosis, left-to-right shun etc.), thus abnormally increasing the RAP. For example, the increase in the RAP in a patient with tricuspid stenosis could cause a significant pressure gradient between the right atrium and right ventricle (Figure 4). There is no way and no meaning to plot a VFC for any chronic conditions mentioned above.
Figure 4.
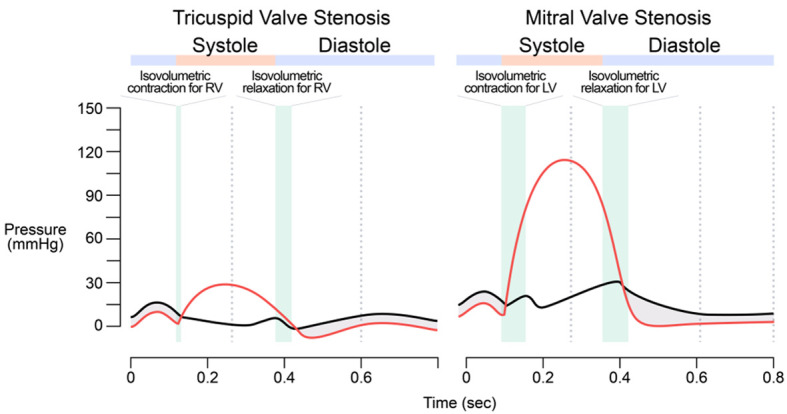
Wigger’s diagrams showing changes from Tricuspid Valve Stenosis and Mitral Valve Stenosis. The pressure gradient (shaded areas) between the right atrial pressure (RAP) and the right ventricular pressure (RVP) during a cardiac cycle in a patient with tricuspid stenosis is inferred from and compared to the pressure gradient in mitral stenosis.
The role of the thin tubing in Guyton’s experiment, downstream to the right atrium but upstream to the artificial pump (equivalent to the right ventricle), was to immediately increase the afterload of the right atrium (an acute pathophysiological condition that is not likely to occur in a dog or a human without experimental intervention). Theoretically, the RAPIV(afterload)-SVDV relationship (where SVDV refers to the steady state VR measured in ml per beat, not Q in L/min) can be reasoned out, but practically, it is not easy to plot experimentally if the new variable (the height of the thin tubing) was not introduced and the rate of the artificial pump was not adjusted to maintain the tubing in a semi-collapsed state as in Guyton’s experiments.
But to plot the VFC, the RAP right before the ventricular filling should be used as RAPIV(afterload), which is about RAPt4.2 in Figure 4. It should be noted that it is the reduced size of the pressure gradient between the large veins and the right atrium that reduces the VR, as opposed to the RAP exerting a back pressure as Guyton originally thought. In order to plot their VFC, it was acceptable to use the RAP (rather than the pressure gradient) as the IV, i.e., RAPIV(afterload).
Figure 5 summarizes the three relationships analyzed above.
Figure 5.
A comparison of the three types of IV-DV (cause-effect) relationships. The three relationships are portrayed with the differentiated steady state right atrial pressure (RAP) and differentiated steady-state stroke volume (SV), where an independent variable (IV) is in red and dependent variable in blue.
Hence, the three relationships in Figure 5 have no common variable that can be shared in the same X-axis and logically, none of them can be combined with each other.
If the steady state SV (ml per beat) in the Y-axis is replaced by Q (L/min), Figure 5A-C becomes the CFC, Levy’s VFC, and Guyton’s VFC respectively assuming the heart rate remains constant. Each VFC can be combined with the CFC technically and mathematically, but not logically: Q is measured in L/min, with which, the less than one second variations among the RAPt0.1, RAPt0.25, and RAPt0.42 are ignored and mean RAP was used in both Guyton’s [1-3] and Levy’s experiments [4]. Is it necessary to combine a VFC with the CFC?
New insights into the combination of a VFC with the CFC
If Guyton’s VFC is combined with the CFC (Figure 1B), the CFC manifests the function of a healthy heart, whereas the VFC reflects some aspect of a different heart with acutely and abnormally increased afterload of the right atrium (i.e., something acutely wrong with the right ventricle). Such a combination has the following two problems:
● The combination itself is irrational.
● If combined, it cannot be explained. As such, current explanations of this combination in the literature [1-3,7,10,11] are hard to stand.
Thinking that the RAP has the lowest pressure in the cardiovascular loop if the ventricular pressures are not considered and least likely to influence other factors as a causal IV, we cannot exclude out the possibility that in Guyton’s experiments, the RAP in fact served the DV, but it was inappropriately interpretated to be the IV because it was plotted in the X-axis.
If Levy’s VFC is combined with the CFC, the interpretations of the combination have no problem (Figure 6).
Figure 6.
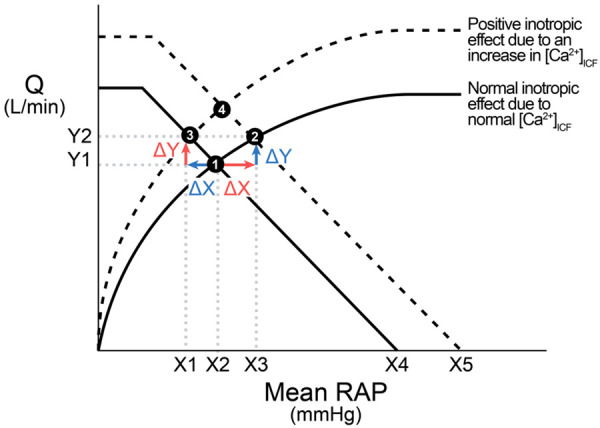
Interpretation of the combination of the Levy’s vascular function curve (VFC) and the cardiac function curve (CFC). From ❶ to ❷: An increase in the mean RAP as the IV (the red ∆X) causes two changes: an in-line increase (blue ∆Y as the DV) in the CFC due to Frank-Starling mechanism and a shift of the VFC from the solid VFC to the dashed VFC. The blue ∆Y does not cause any decrease in the mean RAP. This method of analysis can be applied to the change from ❸ to ❹. From ❶ to ❸: In contrast, the red ∆Y (i.e., ∆Y as the IV, an in-line change in the VFC) causes a decrease in the mean RAP and the shift of the CFC upward. This method of analysis can be applied to the change from ❷ to ❹.
From Figure 6:
● The mean RAP can serve as either the IV of the CFC (the red ∆X) or DV of the VFC (the blue ∆X) sequentially, not concurrently.
● The VFC and CFC are combined by default, i.e., an increase in the RAP as the IV is simultaneously reflected in both curves; and an increase in the Q as the IV is also reflected in both curves simultaneously.
Conclusions
In the literature, the combination of an undifferentiated VFC with the CFC serves two functions [1-3,7,10,11]: 1) explain how the heart’s operating point is maintained if there is a change in the RAP; and 2) explain how the heart’s operating point shifts to a new steady state in response to a change in another cardiac function or vascular function-related variable. The logical reasoning in this article indicates the following:
● Guyton’s VFC stood in his experimental setting as an acute increase in the afterload of the right atrium (an unusual situation that does not occur in real life). The rationale to combine it with the CFC is questionable and the combination itself cannot be interpreted convincingly if the RAP was indeed the IV.
● The combination of Levy’s VFC with the CFC can be explained sequentially following a change in the mean RAP or a change in the Q, and serves the second function only. In other words, the X and Y axes serve as the IV and DV alternatively. However, it is important to point out that this combination is a technical manipulation that is of practical use as opposed to a logical combination.
● Neither Guyton’s combination nor Levy’s combination can serve the first function.
The authors welcome and appreciate empirical data that can prove the logic in this article, or correct it if any essential point is missed.
Acknowledgements
The authors would like to express their appreciation to our medical illustrator, Audrey Bell, for her professional drawing of all figures in this article.
Disclosure of conflict of interest
None.
References
- 1.Guyton AC, Lindsey AW, Kaufmann BN. Effect of mean circulatory filling pressure and other peripheral circulatory factors on cardiac output. Am J Physiol. 1955;180:463–8. doi: 10.1152/ajplegacy.1955.180.3.463. [DOI] [PubMed] [Google Scholar]
- 2.Guyton AC, Lindsey AW, Abernathy B, Richardson T. Venous return at various right atrial pressures and the normal venous return curve. Am J Physiol. 1957;189:609–15. doi: 10.1152/ajplegacy.1957.189.3.609. [DOI] [PubMed] [Google Scholar]
- 3.Guyton AC, Jones CE, Coleman TG. Cardiac output and its regulation. 2nd ed. Philadelphia: Saunders; 1973. [Google Scholar]
- 4.Levy MN. The cardiac and vascular factors that determine systemic blood flow. Circ Res. 1979;44:739–47. doi: 10.1161/01.res.44.6.739. [DOI] [PubMed] [Google Scholar]
- 5.Beard DA, Feigl EO. Understanding Guyton’s venous return curves. Am J Physiol Heart Circ Physiol. 2011;301:H629–33. doi: 10.1152/ajpheart.00228.2011. [DOI] [PMC free article] [PubMed] [Google Scholar]
- 6.Hall JE. Guyton and hall textbook of medical physiology. 14th ed. Philadelphia: Elsevier; 2020. [Google Scholar]
- 7.Boron WF, Boulpaep EL, editors. Medical physiology. Third edition. Philadelphia: Elsevier; 2017. Regulation of arterial pressure and cardiac output; pp. 548–52. [Google Scholar]
- 8.Klabunde RE. Cardiovascular physiology concepts. 2nd edition. Philadelphia: Lippincott Williams & Wilkins/Wolters Kluwer; 2012. [Google Scholar]
- 9.Katz AM. Physiology of the heart. 5th edition. Philadelphia: Wolters Kluwer Health/Lippincott Williams & Wilkins Health; 2011. [Google Scholar]
- 10.Costanzo LS. Physiology. 6th edition. Philadelphia: Elsevier; 2018. Cardiovascular Physiology; pp. 158–63. [Google Scholar]
- 11.Berne RM, Koeppen BM, Stanton BA. Berne & Levy physiology. 6th ed, updated edition. Philadelphia: Mosby/Elsevier; 2010. Integrated Control of the Cardiovascular System; p. 398. [Google Scholar]
- 12.Pappano AJ, Wier WG. Cardiovascular physiology. Eleventh edition. Philadelphia: Elsevier; 2019. [Google Scholar]
- 13.Preston RR. Lippincott’s Illustrated Reviews: Physiology. 1e. Baltimore: Lippincott, Williams & Wilkins; [Google Scholar]
- 14.Pakkam ML, Brown KN. Physiology, Bainbridge Reflex. StatPearls, Treasure Island (FL): StatPearls Publishing; 2022. [PubMed] [Google Scholar]
- 15.Kurapati R, Heaton J, Lowery DR. Atrial Kick. StatPearls, Treasure Island (FL): StatPearls Publishing; 2022. [PubMed] [Google Scholar]
- 16.Guyton AC, Jones CE. Central venous pressure: physiological significance and clinical implications. Am Heart J. 1973;86:431–7. doi: 10.1016/0002-8703(73)90132-4. [DOI] [PubMed] [Google Scholar]


