

Abstract
Background and purpose:
With the progressive increase in the prevalence of type 2 diabetes mellitus (T2DM), diabetic nephropathy (DN) – one of the most common chronic microvascular complications – has evolved into a significant cause of death worldwide among end-stage renal disease patients. Academic researchers have for decades focused on the development of DN and recently found that free fatty acids (FFAs) constituted an independent risk factor for vascular complications in T2DM patients. It is therefore critical to determine whether the metabolic profile of FFAs is related to DN.
Methods:
This study comprised 611 research subjects in Dalian, a city in northeast China: 52 DN patients, 115 T2DM patients, and 444 healthy controls. We determined 15 forms of serum FFAs, including arachidonic acid (AA, C20:4), docosahexaenoic acid (DHA, C22:6), erucic acid (C22:1), nervonic acid (NA, C24:1), estimated total omega-3s, total omega-6s, the omega-3/omega-6 ratio, and total FFA content by liquid chromatography–mass spectrometry (LC-MS).
Results:
The levels of NA (mean = 45.27, range = 0.84–76.57) and DHA (mean = 324.58, range = 205.38–450.03) in DN patients were slightly lower than those in T2DM patients or healthy controls. The serum omega-3 polyunsaturated fatty acid (PUFA) DHA (C22:6) was significantly negatively correlated with microalbuminuria (MAU), the albumin/creatinine ratio (ACR), body mass index (BMI), fasting plasma glucose (FPG), and glycosylated hemoglobin (HbA1c). The serum monounsaturated fatty acid (MUFA) NA (C24:1) was significantly negatively correlated with BMI, FPG, and HbA1c. After adjustment of variables, multiple logistic regression analysis revealed significant odds ratios (ORs) [with confidence intervals (CIs)] for DHA (0.991, 0.985–0.997; p = 0.002) and NA (0.978, 0.958–0.999; p = 0.037).
Conclusion:
In this study, we ascertained that the contents of NA and DHA in patients with DN were relatively low, and that DHA was negatively correlated with MAU and the ACR. However, large-scale, population-based studies focusing on the role of NA and DHA in the pathogenesis of DN are still required in the future.
Keywords: diabetic nephropathy, docosahexaenoic acid, nervonic acid, polyunsaturated fatty acid, type 2 diabetes mellitus
Introduction
The global prevalence of diabetes was estimated at 9.3% (463 million people) in 2019 and is expected to increase to 10.2% (578 million) by 2030 and 10.9% (700 million) by 2045. 1 Type 2 diabetes mellitus (T2DM) is usually present for many years before it appears clinically, and complications such as diabetic nephropathy (DN) may have already developed by the time of diagnosis. 2
The onset and development of DN are related to many factors that include age, obesity, atherosclerosis, hypertension, and chronic inflammation, 3 and this gradually leads to clinically progressive proteinuria, kidney damage, and renal dysfunction. DN is the principal cause of renal fibrosis and end-stage renal disease (ESRD), 4 and with the decline in kidney function caused by diabetes and the manifestation of renal atherosclerosis, the number of ESRD patients worldwide continues to rise. 5 In addition, ESRD caused by the progressive loss of renal function has resulted in substantial health and economic pressures in both less and more developed countries. 6 Therefore, it is paramount that in-depth investigation and a greater understanding of ESRD diseases be pursued. 4
Free fatty acids (FFAs) have been proven to be closely related to pathologic changes in the body such as chronic inflammation, obesity, and insulin resistance. 7 Mozaffarian and Wu 8 demonstrated that the risk of cardiovascular disease (CVD) (the key cause of mortality among DN patients) might be lower in patients who consumed omega-3 polyunsaturated fatty acids (PUFAs). 9 The previous studies have also shown that PUFAs were related to reduced albuminuria in diabetic patients, but there was little evidence to support their obvious influence on inhibiting kidney globulin malfunction.9–11 A longitudinal study of older individuals found that high concentrations of PUFAs in plasma were negatively related with the decline in renal function associated with aging. 12 Consumption of omega-3 PUFAs has also been depicted to be negatively correlated with kidney fibrosis, inflammation, and oxidative stress in animal models. 13 Other fatty acids such as linoleic acid (LA) and monounsaturated fatty acids (MUFAs) have gradually attracted the attention of scholars, and the authors of one study that encompassed 20 countries have discerned a negative correlation between LA and T2DM. 14 Compared with Europeans and Americans, Asians display different lifestyles and metabolic characteristics, 15 and thus, results may not be completely consistent among studies.
Kidney disease continues to constitute a crucial determining factor in the deaths of individuals with type 1 or type 2 diabetes. Studies are currently underway to distinguish biomarkers (in addition to the determination of proteinuria and renal globulin filtration rates) that can assist in monitoring kidney disease in diabetic patients. With a gradually heightened understanding of the potential pathophysiology underlying DN, we posit that novel regimens will be introduced into clinical practice over the next several years. 16 The aim of this study, then, was to uncover appropriate FFA biomarkers in DN patients, to ascertain their impact on DN, and to unravel novel interactions between FFAs and DN.
Materials and methods
Study population
This study was performed at Zhongshan Hospital, and we received ethics approval from the Ethics Committee of Zhongshan Hospital Affiliated with Dalian University (ethics approval ID: 2019271); all participants signed an informed consent form. Our information collectors conducted face-to-face interviews with the participants and collected blood biochemical indicators after admission. To minimize discrepancies in data collection, all collectors were trained to standardize the method of conducting interviews and to track missing information from patients. The study sample comprised 52 DN patients, 115 T2DM patients, and 444 healthy controls who were enrolled in the Department of Metabolic Nutrition.
The individuals enrolled in this study were all older than 18 years and acted autonomously in self-administering lipid-lowering drugs (such as atorvastatin calcium) over the past 3 months, and they experienced no recent history of acute infection, surgery, or trauma. DN is generally described as clinically decreased renal function, an increased urinary albumin/creatinine ratio (UACR ⩾30 mg/g), an elevated plasma creatinine concentration, and diminished immunoglobulin and glomerular filtration rate (GFR; estimated glomerular filtration rate [eGFR] <80 ml/min). 17 Renal dysfunction owing to other diseases was ruled out, and recently adopted drugs that could exert an impact on liver and kidney function were excluded. Diabetes was diagnosed based on plasma glucose criteria, employing an FPG value or two-h plasma glucose (2-h PG) value during a 75-g oral glucose tolerance test (OGTT) or using HbA1c criteria. 18
The inclusion criteria were as follows: (1) For DN, (i) a 2-h PG ⩾200 mg/dl (11.1 mmol/) during an OGTT OR an FPG ⩾126 mg/dl (7.0 mmol/l) OR HbA1c ⩾6.5% (48 mmol/mol), (ii) a UACR ⩾30 mg/g, and (iii) an eGFR <80 ml/min; (2) for T2DM, (i) a 2-h PG ⩾200 mg/dl (11.1 mmol/l) during an OGTT OR an FPG ⩾126 mg/dl (7.0 mmol/l) OR HbA1c ⩾6.5% (48 mmol/mol), (ii) a UACR <30 mg/g, and (iii) an eGFR ⩾80 ml/min; and (3) for the control, (i) a 2-h PG <200 mg/dl (11.1 mmol/l) during OGTT AND an FPG <126 mg/dl (7.0 mmol/l) AND a HbA1c <6.5% (48 mmol/mol), (ii) a UACR <30 mg/g, and (iii) an eGFR ⩾80 ml/min. The exclusion criteria were as follows: (1) type 1 diabetes and other specific types of diabetes; (2) acute metabolic disorders such as severe infection, diabetic ketoacidosis, and hyperosmolar coma; (3) heart and liver dysfunction unrelated to diabetes, including patients recently adopting medications that may affect liver and kidney function, and who have malignant tumors; (4) clinical proteinuria caused by other reasons or renal biopsy suggestive of kidney disease not caused by diabetes; (5) repeated urinary or reproductive tract infections; and (6) pregnancy or lactation or a history of serious mental disorders.
Measurements
We evaluated medical history – including smoking history, alcohol consumption history, cardiovascular disease, heart failure, cerebral vascular disease, age, sex, height, body fat, systolic blood pressure (SBP), diastolic blood pressure (DBP), retinal lesions, neuropathy, and large vascular lesions; we measured height and weight; and we calculated patient body mass index (BMI) (kg/m2). Blood was collected from the antecubital vein after participants had fasted for longer than 8 h, and serum separation was performed using Roche’s fully automatic biochemical analyzer (Roche Holding AG, Basel, Switzerland) to measure FPG, glycosylated hemoglobin (HbA1c), total cholesterol (TC), triglycerides (TGs), high-density lipoprotein-cholesterol (HDL-c), low-density lipoprotein-cholesterol (LDL-c), uric acid (UA), serum creatinine (SCR), blood urea nitrogen (BUN), apolipoprotein A (Apo A), apolipoprotein B (Apo B), vitamin D (VD), vitamin D2 (VD2), and vitamin D3 (VD3).
Over 10 ml of urine was collected from each participant and analyzed using a Roche automatic biochemical analyzer to measure urine creatinine (UCR), microalbuminuria (MAU), and the UACR. We calculated GFR based upon the following equation that entailed Cr level, age, and sex: eGFR (ml/min/1.73 m2) = 194 × creatinine (−1.094) × age in years (0.287) (for females, ×0.739). The use of statins, calcium channel blockers, beta-blockers, angiotensin-converting enzyme inhibitors, angiotensin II blockers, and hypoglycemic agents was also assessed.
Serum fatty acids
Liquid chromatography–mass spectrometry (LC-MS) is an exceptional technique for detecting and quantifying small molecular metabolites (including fatty acids) with high sensitivity and resolution owing to the extreme complexity of basal cells and the rich traces of metabolites. Moreover, LC-MS is a common technique for differentiating and defining fatty acids; it does not require chemical derivatization but makes full use of separation and sensitivity techniques. 19
The detection process was as follows. First, 50 μl of internal standard working solution, 1 ml of hydrolysis solution, and 5 μl of covalent working solution were combined, vortexed for 10 s, and shaken at 90°C for 20 min. Then, 80 μl of neutralization solution was added, and the sample was allowed to incubate for 10 s. Next, 1 ml of extract solution was added, followed by a 5-min incubation. Then, 700 μl of supernatant was dried in a nitrogen atmosphere at 50°C, 400 μl of complex solution was added, and the mixture was vortexed for 5 min. Finally, 200 μl of sample was collected for analysis.
For this analysis, we ultimately employed an AB SCIEX Triple Quad 4500MD (Framingham, MA, USA) for LC-MS with an ACQUITY ultra-performance liquid chromatography (UPLC) BEH C18 1.7-µm column at the Institute of Metal Research Chinese Academy of Sciences (located at Dalian city). The parameters were as follows: mobile phase (A) comprised an aqueous solution of 2 mM ammonium formate, and for mobile phase (B), we used a 2-mM ammonium formate methanol solution; column temperature was 40°C, sample chamber temperature was 8°C, and our sample volume was 2 μl. 20 We measured 15 types of serum FFAs by LC-MS, including the saturated fatty acids (SFAs) stearic acid (C18:0), arachidic acid (C20:0), behenic acid (C22:0), and lignoceric acid (C24:0); the MUFAs eicosenoic acid (C20:1), erucic acid (C22:1), and nervonic acid (NA, C24:1); the omega-3 PUFAs linolenic acid (LA, C18:3), docosahexaenoic acid (DHA, C22:6), and docosapentaenoic acid (DPA, C22:5); the omega-6 PUFAs linoleic acid (C18:2), eicosadienoic acid (C20:2), arachidonic acid (AA, C20:4); and the omega-3/omega-6 ratio.
Statistical data analyses
Ultra-performance liquid chromatography–tandem quadrupole mass spectrometry (UPLC-MS/MS) was used to analyze serum from the three groups. We applied MetaboAnalyst (an online metabolic data analysis software) to conduct integrity detection, missing-value processing, data filtering, normalization, and other preprocessing of the original data for the 150 metabolites. All metabolites in the three groups were analyzed by partial least-squares discriminant analysis (PLS-DA), and a variable importance in projection (VIP) value chart was constructed. Different markers were preliminarily screened according to a VIP cutoff greater than 1.
SPSS (version 20.0; SPSS Inc., Chicago, IL, USA) was used in our comparative analysis. Attribute data were analyzed with the chi-square test, and normality of the variable data distribution was tested using the Kolmogorov–Smirnov (K-S) test. The mean value ± standard deviation (SD) was provided for those data following a normal distribution, and the median (lower quartile to upper quartile) was provided for non-normally distributed data. If the results of the three groups of data were all normally distributed after the K-S test, we executed one-way analysis of variance (ANOVA) for comparisons among the three groups and performed pairwise comparisons. For data that were not normally distributed, the Kruskal–Wallis (K-W) non-parametric test was used to analyze differences among the three groups. The fatty acid data all exhibited a non-normal distribution, and we therefore used the K-W test to analyze the differences between groups, making pairwise comparisons. A p-value of <0.05 indicated the statistical significance. We used GraphPad Prism 8 (GraphPad Software Inc., San Diego, CA, USA) to construct the box diagrams and also calculated the odds ratios (ORs) and 95% confidence intervals (CIs). The recognized confounding variables such as age, hypertension, dyslipidemia, BMI, and eGFR were adjusted and included in our multiple logistic regression analysis; based upon a previously published method, we exploited the adjusted multiple logistic regression to assess the impact of fatty acids on patients with DN.21–23
Results
Characteristics of the study population and assessment of fatty acids
As shown in Table 1, compared with the healthy control group, the DN group reflected a significantly higher age, BMI, SBP, FPG, HbA1c, and UACR; augmented levels of SCR, BUN, MAU, and TG; and elevated rates of heart failure, cerebral vascular disease, retinal lesions, neuropathy, and large vascular lesions. Relative to the healthy control group, however, the T2DM group exhibited a significantly lower eGFR and reduced concentrations of TC, HDL, LDL, Apo A, C24:1, and C22:6 (Table 2). The T2DM group also exhibited significantly higher age, BMI, SBP, DBP, eGFR, and UACR, and increased levels of FPG and HbA1c compared with the healthy control group, and the number of patients with neuropathy was significantly higher. We noted that SCR, UCR, and Apo A levels were significantly lower in the T2DM group (Table 1).
Table 1.
Baseline characteristics of the study population (n = 611).
| DN (n = 52) | T2DM (n = 115) | Healthy controls (n = 444) | p | |
|---|---|---|---|---|
| Demographic characteristics | ||||
| Age (years) | 66.65 ± 12.068* | 60.54 ± 12.3** | 55.98 ± 12.07 | <0.001 |
| Body mass index (kg/m2) | 26.17 ± 2.95* | 25.51 ± 3.54** | 24.37 ± 3.46 | <0.001 |
| Sex (n) | 33 (63.5%) | 55 (47.8%) | 203 (45.7%) | 0.053 |
| Smoking (n) | 13 (25%) | 28 (24.3%) | 79 (17.8%) | 0.172 |
| Alcohol consumption (n) | 14 (26.9%) | 27 (23.5%) | 86 (19.4%) | 0.327 |
| Systolic blood pressure (mmHg) | 140 (126.25~160)* | 130 (120~150)** | 120 (120~140) | <0.001 |
| Diastolic blood pressure (mmHg) | 80 (80~90) | 80 (80~90)** | 80 (70~88) | 0.003 |
| Biological features | ||||
| Fasting blood glucose (mmol/l) | 8.71 (6.7~10.47)* | 7.63 (6.23~10.1)** | 4.89 (4.54~5.24) | <0.001 |
| HbA1c (%) | 8.19 ± 1.57* | 8.03 ± 1.81** | 5.58 ± 0.44 | <0.001 |
| Serum creatinine (μmol/l) | 82.97 ± 64.79* | 53.86 ± 14.27** | 60.09 ± 13.25 | <0.001 |
| eGFR (ml/min per 1.73 m2) | 96.74 ± 42.44* | 129.16 ± 43.16** | 115.34 ± 33.6 | <0.001 |
| Urine creatinine (μmol/l) | 9324.04 ± 6334.4 | 8175.97 ± 4534.39** | 9592.86 ± 4895.85 | 0.018 |
| Blood urea nitrogen (mmol/l) | 5.74 (4.93~6.87)* | 5.015 (4.02~6.16) | 4.95 (4.18~5.82) | 0.001 |
| Microalbuminuria (mg/l) | 111.03 (49.54~310.8)* | 6.11 (3.82~13.41) | 6.26 (3.88~11.99) | <0.001 |
| Urinary albumin/creatinine ratio (mg/μmol) | 118.64 (51.63~335.75)* | 9.8 (6.72~15.81)** | 6.88 (4.81~11.89) | <0.001 |
| Uric acid (μmol/l) | 347.78 ± 119.68 | 328.06 ± 94.07 | 340.3 ± 96.92 | 0.435 |
| Total cholesterol (mmol/l) | 4.93 ± 1.15* | 5.04 ± 1.11 | 5.31 ± 1.52 | 0.015 |
| Triglycerides (mmol/l) | 1.85 (1.29~2.46)* | 1.61 (1.08~2.38) | 1.44 (1.02~2.15) | 0.013 |
| HDL cholesterol (mmol/l) | 1.2 ± 0.38* | 1.37 ± 0.31 | 1.48 ± 0.48 | <0.001 |
| LDL cholesterol (mmol/l) | 2.59 (2.07~3.21)* | 2.81 (2.25~3.31) | 2.95 (2.47~3.48) | 0.018 |
| Apolipoprotein A (g/l) | 1.01 (0.89~1.17)* | 1.09 (0.99~1.24)** | 1.12 (0.98~1.31) | 0.002 |
| Apolipoprotein B (g/l) | 1.12 ± 0.29 | 1.08 ± 0.32 | 1.11 ± 0.31 | 0.447 |
| VD (ng/ml) | 16.45 (10.98~22.54) | 17.11 (12.7~22.96) | 16.8 (12.28~22.26) | 0.855 |
| VD2 (ng/ml) | 0.7 (0.46~1.8) | 0.66 (0.3975~1.725) | 0.62 (0.41~1.06) | 0.167 |
| VD3 (ng/ml) | 15.4 (10.1~21.9) | 15.8 (10.68~21.03) | 15.85 (11.5~21.03) | 0.963 |
| Past medical history | ||||
| Coronary heart disease (n) | 11 (21.2%)* | 11 (9.6%) | 14 (3.2%) | <0.001 |
| Heart failure (n) | 2 (3.8%)* | 1 (0.9%) | 2 (0.5%) | 0.039 |
| Cerebral vascular disease (n) | 12 (23.1%)* | 10 (8.7%) | 13 (2.9%) | <0.001 |
| Retinal lesions (n) | 8 (15.7%) | 5 (4.4%) | 0 (0%) | <0.001 |
| Neuropathy (n) | 35 (68.6%)* | 58 (50.9%)** | 1 (0.3%) | <0.001 |
| Large vascular lesions (n) | 40 (76.9%)* | 70 (60.9%) | 167 (38.6%) | <0.001 |
DN, diabetic nephropathy; HDL, high-density lipoprotein; LDL, low-density lipoprotein; T2DM, type 2 diabetes mellitus; VD, vitamin D.
Data are presented as the mean value ± SD for normally distributed data or as median (interquartile range) for data with a skewed distribution.
p < 0.05, for the DN group versus the control group.
p < 0.05, for the T2DM group versus the control group.
Table 2.
Serum phospholipid fatty acid composition in the study patients.
| DN (n = 52) | T2DM (n = 115) | Healthy controls (n = 444) | p | |
|---|---|---|---|---|
| SFAs | ||||
| C18:0 (μmol/l) | 1146.96 (871.73~1647.95) | 1173.29 (957.03~1597.62) | 1314.18 (976.52~1731.34) | 0.042 |
| C20:0 (μmol/l) | 18.64 (3.76~33.03) | 14.13 (5.526~29.97) | 21.71 (5.6~38.2) | 0.144 |
| C22:0 (μmol/l) | 33.69 (0.96~59.25) | 15.1 (0.91~55.61) | 39.05 (1.24~66.35) | 0.15 |
| C24:0 (μmol/l) | 15.74 (1.1~48.05) | 4.59 (1.04~46.34) | 31.49 (1.11~55.7) | 0.174 |
| MUFAs | ||||
| C20:1 (μmol/l) | 15.53 (12.33~23.55) | 15.49 (12.36~19.74) | 16.25 (12.02~21.79) | 0.576 |
| C22:1 (μmol/l) | 2.98 (0.38~4.26) | 2.95 (0.28~4.41) | 3.16 (0.27~4.98) | 0.615 |
| C24:1 (μmol/l) | 45.27 (0.84~76.57)* | 15.63 (1.0~93.71) | 67.9 (1.09~112.04) | 0.004 |
| Omega-3 PUFAs | ||||
| C18:3; ALA (μmol/l) | 128.31 (85.72~194.93) | 132.25 (89.77~180.10) | 134.24 (95.1~202.35) | 0.488 |
| C20:5; EPA (μmol/l) | 84.72 (52.56~159.36) | 100.7 (55.43~156.92) | 105.47 (62.22~177.69) | 0.208 |
| C22:6; DHA (μmol/l) | 324.58 (205.38~450.03)* | 367.05 (247.88~513.05) | 390.81 (255.85~565.19) | 0.037 |
| C22:5; DPA (μmol/l) | 100.17 (69.06~130.8) | 96.17 (74.19~129.04) | 98.02 (73.33~131.38) | 0.857 |
| Omega-6 PUFAs | ||||
| C18:2; LA (μmol/l) | 5069.53 (4042.82~5922.71) | 5124.62 (4109.46~6008.55) | 5115.18 (4082.04~6250.01) | 0.567 |
| C20:2; (μmol/l) | 30.21 (23.20~38.13) | 29.44 (23.11~35.40) | 29.32 (23.05~37.67) | 0.739 |
| C20:4; AA (μmol/l) | 975.81 (739.43~1378.19) | 987.69 (739.05~1430.91) | 1154.58 (817.37~1570.46) | 0.097 |
AA, arachidonic acid; ALA, alpha-linolenic acid; DHA, docosahexaenoic acid; DN, diabetic nephropathy; DPA, docosapentaenoic acid; EPA, eicosapentaenoic acid; LA, linoleic acid; MUFAs, monounsaturated fatty acids; PUFAs, polyunsaturated fatty acids; SFAs, saturated fatty acids; T2DM, type 2 diabetes mellitus.
Data are given as a number (percentage) for categorical variables and (mean value ± standard deviation) or median (IQR) for continuous variables. Italic values indicate a significant p-value (p < 0.05).
p < 0.05, for the DN group versus the control group.
Fatty acid metabonomics
After these data were normalized using the MetaboAnalyst and shown to present a normal distribution, we conducted PLS-DA and one-way ANOVA (Supplementary Figure 1 and Supplementary Table 1). Via PLS-DA, the three groups of data were distinguishable as the DN group (A), T2DM group (B), and healthy control group (C).
The following variables with VIP scores >1 were selected (Figure 1): C24:1, C22:0, C24:0, C22:0, C20:0, C20:5, and C22:6. Compared with the same indices in the healthy control group, the values for C20:0, C20:5, and C22:6 in the DN group (group A) were significantly lower, and the values for C24:1, C22:0, C24:0, and C22:1 in the T2DM group (group B) were also significantly lower than controls. Therefore, the results of this analysis combined with the results from one-way ANOVA of the three groups indicated significantly lower DHA and NA in the DN group, and thereby revealing close correlations between DHA/NA and DN.
Figure 1.
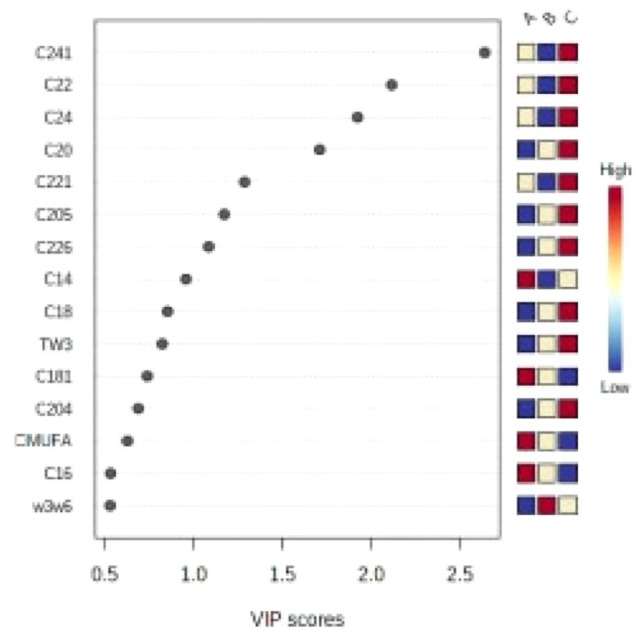
Variable importance for the projection (VIP) scores.
Correlations between serum fatty acids and metabolic parameters
Figure 2 shows that C22:6 and C24:1 serum FFA levels were low and significantly different in the DN group compared with the healthy control group. DHA concentrations in the T2DM group did not differ from those in the other two groups, and the NA concentrations in the DN group were slightly lower than those in the T2DM group. In addition, FPG and HbA1c levels were significantly augmented in the DN and T2DM groups relative to the healthy control group.
Figure 2.

Distribution of serum fatty acids C24:1, C22:6, FPG, and HbA1c in three groups.
As shown in the hierarchical clustering heatmap (Figure 3), group A (i.e. the DN group) exhibited a significantly higher MAU and ACR, and significantly attenuated C22:6 and C24:1 concentrations; group B (i.e. the T2DM group) showed lower FPG and HbA1c levels; and group C (i.e. the healthy control group) showed elevated C22:6 and C24:1 levels. A heatmap of Spearman’s correlation (Figure 4) for the 611 participants revealed that serum C22:6 was significantly negatively correlated with MAU, UACR, BMI, FPG, and HbA1c. With the elevation in MAU, the UACR, BMI, and FPG were reduced; HbA1c, DHA, and NA levels declined significantly (Supplementary Tables 2 and 3); serum C24:1 showed a significant negative correlation with BMI, FPG, and HbA1c (i.e. with increasing BMI, FPG, HbA1c, and DHA levels); and NA levels decreased significantly.
Figure 3.
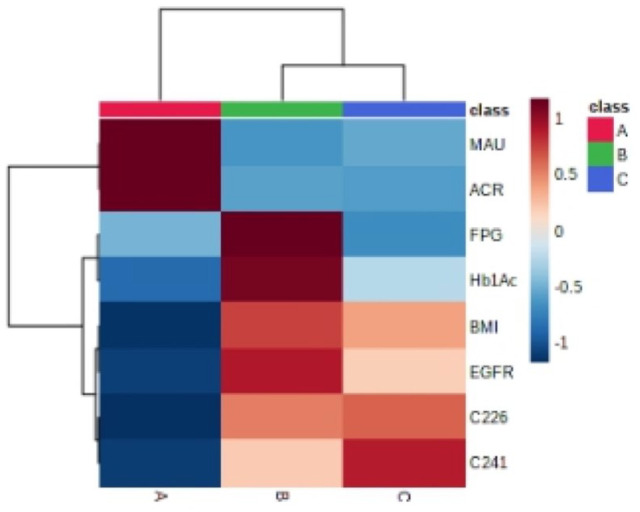
Hierarchical cluster heatmap of diabetic nephropathy group, simple diabetic group, and healthy control group.
Figure 4.

Spearman heatmap of C24:1, C22:6 fatty acids, and metabolic parameters.
Multiple logistic regression of adjusted factors and receiver operating characteristic curve analysis of DN
Some risk factors such as elevated blood sugar levels, a long diabetes duration, elevated blood pressure, obesity, and hyperlipidemia can lead to the onset and development of DN. These risk factors can, however, be modified by antidiabetic, antihypertensive, or lipid-lowering regimens and lifestyle changes. 24 Single-factor logistic regression analysis (Table 3) showed that age, BMI, SBP, FPG, HbA1c, SCR, UACR, TG, HDL, coronary heart disease, heart failure, cerebral vascular disease, neuropathy, and large vascular lesions were associated with C22:6 and C24:1. We then conducted multiple logistic regression analysis after adjusting for confounding factors that included age, BMI, SBP, FPG, TG, and HDL (Table 4); our results indicated that DHA and NA played a role in DN (C22:6 OR = 0.991; 95% CI = 0.985–0.997; p = 0.002 and C24:1 OR = 0.978; 95% CI = 0.958–0.999; p = 0.037).
Table 3.
Univariate logistic regression analysis of DN in the study patients.
| Variable | Univariate | p-value |
|---|---|---|
| Age | 1.084 (1.054~1.114) | <0.001 |
| Body mass index | 1.151 (1.065~1.244) | 0.001 |
| Systolic blood pressure | 1.036 (1.021~1.051) | <0.001 |
| Fasting blood glucose | 4.412 (3.335~5.835) | <0.001 |
| HbA1c (%) | 4.886 (3.566~6.695) | <0.001 |
| Serum creatinine | 1.033 (1.017~1.049) | 0.001 |
| Urinary albumin/creatinine ratio | 1.055 (1.040~1.070) | <0.001 |
| Triglycerides | 1.114 (0.991~1.252) | 0.07 |
| HDL cholesterol | 0.103 (0.04~0.268) | <0.001 |
| Coronary heart disease | 8.24 (3.514~19.322) | <0.001 |
| Heart failure | 8.72 (1.202~63.264) | 0.032 |
| Cerebral vascular disease | 9.877 (4.226~23.083) | <0.001 |
| Neuropathy | 859.687 (110.71~6675.656) | <0.001 |
| Large vascular lesions | 5.309 (2.707~10.412) | <0.001 |
| C22:6 | 0.999 (0.997~1) | 0.089 |
| C24:1 | 0.992 (0.987~0.998) | 0.005 |
HDL, high-density lipoprotein.
Italic values indicate a significant p-value (p < 0.05).
Table 4.
Multiple adjusted logistic regression of diabetic nephropathy in the study patients.
| Model 1 | Model 2 | Model 3 | Model 4 | |||||
|---|---|---|---|---|---|---|---|---|
| OR (95% CI) | p | OR (95% CI) | p | OR (95% CI) | p | OR (95% CI) | p | |
| C24:1 | 0.980 (0.965~0.995) | 0.01 | 0.978 (0.961~0.996) | 0.018 | 0.980 (0.961~0.999) | 0.040 | 0.978 (0.958~0.999) | 0.037 |
| C22:6 | 0.994 (0.991 ~0.998) | 0.002 | 0.993 (0.989 ~0.998) | 0.002 | 0.993 (0.989 ~0.997) | 0.005 | 0.991 (0.985~0.997) | 0.002 |
CI, confidence interval; OR, odds ratio.
Model 1: unadjusted odds ratio (OR); Model 2: adjusted for age, FPG, TG, and HDL; Model 3: adjusted for age, BMI, FPG, TG, and HDL; Model 4: adjusted for age, BMI, SBP, FPG, TG, and HDL.
Italic values indicate a significant p-value (p < 0.05).
As shown in Figure 5, the area under the ROC curve (AUC) for serum DHA was 0.599 (p < 0.05), and the AUC for NA was 0.6172 (p < 0.05), indicating that DHA and NA manifest potential in exploring the diagnostic value of DN.
Figure 5.

ROC curve of serum fatty acids (C22:6 and C24:1) predicted DN.
Discussion
We have perused the literature and maintain that ours is one of the few studies on the correlation between DN and fatty acids. Through the combination of PLS-DA and one-way ANOVA, we determined that fatty acids such as DHA and NA were related; the serum omega-3 PUFA C22:6 (DHA) showed a significant negative correlation with MAU, ACR, BMI, FPG, and HbA1c; and the serum MUFA C24:1 (NA) showed a significant negative correlation with BMI, FPG, and HbA1c. Our ROC curve analysis also suggested that DHA and NA may act as potential predictive indicators in the diagnosis of DN.
The aim of this study was to investigate potential FFAs that could discriminate among patients with DN, T2DM, and healthy controls, and to explore the correlation between FFAs and DN to enable the future investigation of whether these indicators possess diagnostic value. This study may also reflect some relevance of microvascular and macrovascular complications of diabetes with respect to the emergence of meaningful indicators of DN.
Correlation between fatty acids and DN
Abnormal serum lipids and renal heterolipid build-up are connected to the development of kidney diseases, especially DN. 4 Specific metabolic, vascular, and inflammatory diseases associated with diabetes frequently contribute to aggressive albuminuria, kidney damage, and impairment (DN). While fatty acids constitute the body’s primary energy supply, too many (particularly FFAs) can cause lipid toxicity. 10 Lipid components in the blood and liver precipitate lipid toxicity by activating inflammatory cytokines and cellular proliferation, and not only generate an increase in FFAs but also cause kidney damage by inducing glomerular and tubular damage. 4
SFAs have been shown in most studies to be a detrimental factor in metabolic diseases such as diabetes.25–27 SFAs are involved in the pathophysiologic development of DN in patients via mechanisms such as lipotoxicity and renal cell damage. 4 As the classifications of FFAs are complex and numerous, however, further improvement in studies such as ours is necessitated. For example, it is necessary to evaluate a larger number of different ethnic and racial groups to analyze biomarkers of FFAs in DN. A few DN biomarkers can be used to guide accurate interventions into the disease, however. In this study, a novel metabolic mass spectrometric technique at the Dalian Institute of Chemical Technology was employed to assess serum FFA levels using LC-MS. The execution of least-squares multiple discriminant analysis then allowed different groups to be distinguished. We expect that the results will facilitate the differentiation of DN 28 and present distinctions among the various types of FFAs in DN patients.
Omega-3 PUFA (DHA) correlation with DN
Researchers previously observed that patients with T2DM who had elevated levels of PUFAs and omega-3s, or higher ratios of omega-3/omega-6 PUFAs, were associated with improved renal function. 29 Omega-3 PUFAs also contain the properties of lowering blood lipids, lowering blood pressure, anti-inflammation, and improving coronary artery diseases (the leading cause of death among patients with DN). However, there is a paucity of information on DN patients. In summary, the measurement of fatty acids is critical to the management of DN, and further research is therefore needed to elucidate its association with fatty acids. 30
The potential benefits of supplementation with omega-3 PUFAs are well established for numerous diseases.31–35 There is limited evidence for an association between omega-3 fatty acid supplementation and DN, however. Han et al. 36 demonstrated that serum TC and TG levels and the UACR were significantly reduced after supplementation with omega-3 PUFAs. The level of omega-3 PUFAs in the diet was also negatively linked to type 1 diabetes but not to the incidence of proteinuria. These findings need to be further evaluated in future prospective studies. 37
Correlation between MUFAs (NA) and DN
MUFAs are also associated with diabetes or DN, and constitute an emerging marker associated with acute coronary artery syndrome in DN patients, low renal cystic filtration, and vascular calcification that can be modified by supplementation with omega-3 PUFAs. 30 Current examinations of NA chiefly involve the mortality risk of patients with chronic kidney disease (CKD) and coronary heart disease, 38 and thus, scrutiny of the relationship between NA and kidney disease as caused by diabetes needs to be fostered. Szczuko et al., 39 however, observed that a higher NA (C24:1) level in DN patients was associated with a higher level of demyelination and axonal loss, and this might be related to the body’s stress-protection mechanism.
In addition, researchers have ascertained that NA attenuates risk factors for coronary heart disease, and they hypothesize that it could exert a protective impact on metabolic diseases associated with obesity. 40 Follow-up data from patients with Stage-5 CKD confirmed that NA was a component of membrane lipids and that phosphatidylethanolamine was a significant predictor of all-cause mortality. 41 Prospective studies on DN are still lacking at present, and additional analyses are needed in the future to clarify its relation to other pathologies.
There were multiple limitations to our analysis. First, as dietary fat intake was not accurately assessed, we could not explicitly rule out the effects of diet on our observations. Second, our sample size for the DN patients was limited relative to that of the healthy controls. Third, it was obvious that analyses of related trends in dietary fat intake and the development of insulin resistance and DN are sorely needed. Finally, as this study was cross-sectional in design, we were not able to propose a causal relationship between FFAs and DN. Additional well-designed prospective studies are therefore needed to further confirm this relationship, for example, investigations on whether supplemental dietary fatty acid analysis might improve disease. It will also be critical in the future to assess the influence of PUFAs on glucose metabolism, diabetes-related lipid defects, and coronary heart disease.
In conclusion, LC-MS detection of the spectrum of serum fatty acids revealed that omega-3 PUFAs (C22:6, DHA) were significantly negatively correlated with MAU and the ACR, and that MUFAs (C24:1, NA) and DHA were significantly negatively correlated with BMI, FPG, and HbA1c.
Supplemental Material
Supplemental material, sj-docx-1-tae-10.1177_20420188221118750 for Association between the metabolic profile of serum fatty acids and diabetic nephropathy: a study conducted in northeastern China by Yazhuo Liu, Yingying Li, Hui Shen, Yike Li, Yanbing Xu, Mi Zhou, Xinghai Xia and Binyin Shi in Therapeutic Advances in Endocrinology and Metabolism
Acknowledgments
The authors wish to acknowledge the contributions of the participants who volunteered their time for this study. Dr Simiao Tian contributed to the concept and design of the work, and Dr Cheng Han made a substantial contribution to the manuscript’s content, reviewed and edited the manuscript prior to submission, and contributed to the review and editing of the final version of the manuscript.
Footnotes
ORCID iD: Yingying Li  https://orcid.org/0000-0003-2590-1166
Supplemental material: Supplemental material for this article is available online.
Contributor Information
Yazhuo Liu, Department of Endocrinology, The First Affiliated Hospital, Xi’an Jiaotong University, Xi’an, China.
Yingying Li, Department of Clinical Nutrition and Metabolism, Dalian University Affiliated Zhongshan Hospital, Dalian, China.
Hui Shen, Department of Clinical Nutrition and Metabolism, Dalian University Affiliated Zhongshan Hospital, Dalian, China.
Yike Li, Department of Clinical Nutrition and Metabolism, Dalian University Affiliated Zhongshan Hospital, Dalian, China.
Yanbing Xu, Department of Clinical Nutrition and Metabolism, Dalian University Affiliated Zhongshan Hospital, Dalian, China.
Mi Zhou, Department of Ophthalmology, Penn State Hershey Medical Center, Hershey, PA, USA.
Xinghai Xia, Department of Ophthalmology, Penn State Hershey Medical Center, Hershey, PA, USA.
Binyin Shi, Department of Endocrinology, The First Affiliated Hospital, Xi’an Jiaotong University, Xi’an 710000, China.
Declarations
Ethics approval and consent to participate: The studies involving human participants were reviewed and approved by Ethics Committee of the Affiliated Zhongshan Hospital of Dalian University. The patients/participants provided their written informed consent to participate in this study.
Consent for publication: All authors consented for publication in its present form.
Author contributions: Yazhuo Liu: Conceptualization; Funding acquisition; Methodology; Project administration; Resources; Software; Writing – original draft.
Yingying Li: Data curation; Formal analysis; Methodology; Project administration; Validation; Visualization; Writing – review & editing.
Hui Shen: Data curation; Investigation; Software; Validation; Writing – original draft.
Yike Li: Data curation; Investigation; Validation; Writing – original draft.
Yanbing Xu: Conceptualization; Data curation; Visualization; Writing – original draft.
Mi Zhou: Investigation; Project administration; Supervision; Writing – original draft.
Xinghai Xia: Investigation; Software; Validation; Writing – review & editing.
Binyin Shi: Formal analysis; Funding acquisition; Investigation; Project administration; Resources; Validation; Writing – review & editing.
Funding: The authors received no financial support for the research, authorship, and/or publication of this article.
Competing interests: The authors declare that there is no conflict of interest.
Availability of data and materials: Data are available from the corresponding author upon request.
References
- 1. Saeedi P, Petersohn I, Salpea P, et al. Global and regional diabetes prevalence estimates for 2019 and projections for 2030 and 2045: results from the International Diabetes Federation Diabetes Atlas, 9th edition. Diabetes Res Clin Pract 2019; 157: 107843. [DOI] [PubMed] [Google Scholar]
- 2. Lu Y, Wang Y, Ong C-N, et al. Metabolic signatures and risk of type 2 diabetes in a Chinese population: an untargeted metabolomics study using both LC–MS and GC–MS. Diabetologia 2016; 59: 2349–2359. [DOI] [PubMed] [Google Scholar]
- 3. Cumbie BC, Hermayer KL. Current concepts in targeted therapies for the pathophysiology of diabetic microvascular complications. Vasc Health Risk Manag 2007; 3: 823–832. [PMC free article] [PubMed] [Google Scholar]
- 4. Opazo-Rios L, Mas S, Marín-Royo G, et al. Lipotoxicity and diabetic nephropathy: novel mechanistic insights and therapeutic opportunities. Int J Mol Sci 2020; 21: 2632. [DOI] [PMC free article] [PubMed] [Google Scholar]
- 5. Gansevoort RT, van der Heij B, Stegeman CA, et al. Trends in the incidence of treated end-stage renal failure in The Netherlands: hope for the future. Kidney Int Suppl 2004: S7–S10. [DOI] [PubMed] [Google Scholar]
- 6. Collins AJ, Foley RN, Herzog C, et al. United States renal data system 2008 annual data report. Am J Kidney Dis 2009; 53: S1–S374. [DOI] [PubMed] [Google Scholar]
- 7. Li N, Qiu Y, Wu Y, et al. Association of serum total fatty acids with type 2 diabetes. Clin Chim Acta 2020; 500: 59–68. [DOI] [PubMed] [Google Scholar]
- 8. Mozaffarian D, Wu JH. Omega-3 fatty acids and cardiovascular disease: effects on risk factors, molecular pathways, and clinical events. J Am Coll Cardiol 2011; 58: 2047–2067. [DOI] [PubMed] [Google Scholar]
- 9. Shapiro H, Theilla M, Attal-Singer J, et al. Effects of polyunsaturated fatty acid consumption in diabetic nephropathy. Nat Rev Nephrol 2011; 7: 110–121. [DOI] [PubMed] [Google Scholar]
- 10. Lee CC, Adler AI. Recent findings on the effects of marine-derived n-3 polyunsaturated fatty acids on urinary albumin excretion and renal function. Curr Atheroscler Rep 2012; 14: 535–541. [DOI] [PubMed] [Google Scholar]
- 11. Miller ER, 3rd, Juraschek SP, Appel LJ, et al. The effect of n-3 long-chain polyunsaturated fatty acid supplementation on urine protein excretion and kidney function: meta-analysis of clinical trials. Am J Clin Nutr 2009; 89: 1937–1945. [DOI] [PMC free article] [PubMed] [Google Scholar]
- 12. Lauretani F, Semba RD, Bandinelli S, et al. Plasma polyunsaturated fatty acids and the decline of renal function. Clin Chem 2008; 54: 475–481. [DOI] [PMC free article] [PubMed] [Google Scholar]
- 13. An WS, Kim HJ, Cho KH, et al. Omega-3 fatty acid supplementation attenuates oxidative stress, inflammation, and tubulointerstitial fibrosis in the remnant kidney. Am J Physiol Renal Physiol 2009; 297: F895–F903. [DOI] [PubMed] [Google Scholar]
- 14. Wu JHY, Marklund M, Imamura F, et al. Omega-6 fatty acid biomarkers and incident type 2 diabetes: pooled analysis of individual-level data for 39 740 adults from 20 prospective cohort studies. Lancet Diabetes Endocrinol 2017; 5: 965–974. [DOI] [PMC free article] [PubMed] [Google Scholar]
- 15. Chan JC, Malik V, Jia W, et al. Diabetes in Asia: epidemiology, risk factors, and pathophysiology. JAMA 2009; 301: 2129–2140. [DOI] [PubMed] [Google Scholar]
- 16. Fineberg D, Jandeleit-Dahm KA, Cooper ME. Diabetic nephropathy: diagnosis and treatment. Nat Rev Endocrinol 2013; 9: 713–723. [DOI] [PubMed] [Google Scholar]
- 17. Reutens AT, Atkins RC. Epidemiology of diabetic nephropathy. Contrib Nephrol 2011; 170: 1–7. [DOI] [PubMed] [Google Scholar]
- 18. American Diabetes Association. 2. Classification and diagnosis of diabetes: standards of medical care in diabetes-2021. Diabetes Care 2021; 44: S15–S33. [DOI] [PubMed] [Google Scholar]
- 19. Hellmuth C, Weber M, Koletzko B, et al. Nonesterified fatty acid determination for functional lipidomics: comprehensive ultrahigh-performance liquid high-performance liquid chromatography-tandem mass spectrometry quantitation, qualification, and parameter prediction. Anal Chem 2012; 84: 1483–1490. [DOI] [PubMed] [Google Scholar]
- 20. Zheng F, Zhao X, Zeng Z, et al. Development of a plasma pseudotargeted metabolomics method based on ultra-high-performance liquid chromatography–mass spectrometry. Nat Protoc 2020; 15: 2519–2537. [DOI] [PubMed] [Google Scholar]
- 21. Poreba M, Rostoff P, Siniarski A, et al. Relationship between polyunsaturated fatty acid composition in serum phospholipids, systemic low-grade inflammation, and glycemic control in patients with type 2 diabetes and atherosclerotic cardiovascular disease. Cardiovasc Diabetol 2018; 17: 29. [DOI] [PMC free article] [PubMed] [Google Scholar]
- 22. Abbott KA, Burrows TL, Thota RN, et al. Association between plasma phospholipid omega-3 polyunsaturated fatty acids and type 2 diabetes is sex dependent: the Hunter Community Study. Clin Nutr 2020; 39: 1059–1066. [DOI] [PubMed] [Google Scholar]
- 23. Li K, Wu K, Zhao Y, et al. Interaction between marine-derived n-3 long chain polyunsaturated fatty acids and uric acid on glucose metabolism and risk of type 2 diabetes mellitus: a case–control study. Mar Drugs 2015; 13: 5564–5578. [DOI] [PMC free article] [PubMed] [Google Scholar]
- 24. Tziomalos K, Athyros VG. Diabetic nephropathy: new risk factors and improvements in diagnosis. Rev Diabet Stud 2015; 12: 110–118. [DOI] [PMC free article] [PubMed] [Google Scholar]
- 25. Fretts AM, Jensen PN, Hoofnagle AN, et al. Plasma ceramides containing saturated fatty acids are associated with risk of type 2 diabetes. J Lipid Res 2021; 62: 100119. [DOI] [PMC free article] [PubMed] [Google Scholar]
- 26. Huang L, Lin JS, Aris IM, et al. Circulating saturated fatty acids and incident type 2 diabetes: a systematic review and meta-analysis. Nutrients 2019; 11: 998. [DOI] [PMC free article] [PubMed] [Google Scholar]
- 27. Fretts AM, Imamura F, Marklund M, et al. Associations of circulating very-long-chain saturated fatty acids and incident type 2 diabetes: a pooled analysis of prospective cohort studies. Am J Clin Nutr 2019; 109: 1216–1223. [DOI] [PMC free article] [PubMed] [Google Scholar]
- 28. Han LD, Xia J-F, Liang Q-L, et al. Plasma esterified and non-esterified fatty acids metabolic profiling using gas chromatography–mass spectrometry and its application in the study of diabetic mellitus and diabetic nephropathy. Anal Chim Acta 2011; 689: 85–91. [DOI] [PubMed] [Google Scholar]
- 29. Chung HF, Long KZ, Hsu CC, et al. Association of n-3 polyunsaturated fatty acids and inflammatory indicators with renal function decline in type 2 diabetes. Clin Nutr 2015; 34: 229–234. [DOI] [PubMed] [Google Scholar]
- 30. Kim OY, Lee SM, An WS. Impact of blood or erythrocyte membrane fatty acids for disease risk prediction: focusing on cardiovascular disease and chronic kidney disease. Nutrients 2018; 10: 1454. [DOI] [PMC free article] [PubMed] [Google Scholar]
- 31. Maki KC, Palacios OM, Bell M, et al. Use of supplemental long-chain omega-3 fatty acids and risk for cardiac death: an updated meta-analysis and review of research gaps. J Clin Lipidol 2017; 11: 1152–1160. [DOI] [PubMed] [Google Scholar]
- 32. Sharma T, Mandal CC. Omega-3 fatty acids in pathological calcification and bone health. J Food Biochem 2020; 44: e13333. [DOI] [PubMed] [Google Scholar]
- 33. Walker CG, Jebb SA, Calder PC. Stearidonic acid as a supplemental source of ω-3 polyunsaturated fatty acids to enhance status for improved human health. Nutrition 2013; 29: 363–369. [DOI] [PubMed] [Google Scholar]
- 34. Wang H, Li Q, Zhu Y, et al. Omega-3 polyunsaturated fatty acids: versatile roles in blood pressure regulation. Antioxid Redox Signal 2021; 34: 800–810. [DOI] [PubMed] [Google Scholar]
- 35. Bauer I, Hughes M, Rowsell R, et al. Omega-3 supplementation improves cognition and modifies brain activation in young adults. Hum Psychopharmacol 2014; 29: 133–144. [DOI] [PubMed] [Google Scholar]
- 36. Han E, Yun Y, Kim G, et al. Effects of omega-3 fatty acid supplementation on diabetic nephropathy progression in patients with diabetes and hypertriglyceridemia. PLoS ONE 2016; 11: e0154683. [DOI] [PMC free article] [PubMed] [Google Scholar]
- 37. Lee CC, Sharp SJ, Wexler DJ, et al. Dietary intake of eicosapentaenoic and docosahexaenoic acid and diabetic nephropathy: cohort analysis of the diabetes control and complications trial. Diabetes Care 2010; 33: 1454–1456. [DOI] [PMC free article] [PubMed] [Google Scholar]
- 38. Li Q, Chen J, Yu X, et al. A mini review of nervonic acid: source, production, and biological functions. Food Chem 2019; 301: 125286. [DOI] [PubMed] [Google Scholar]
- 39. Szczuko M, Kaczkan M, Drozd A, et al. Comparison of fatty acid profiles in a group of female patients with chronic kidney diseases (CKD) and metabolic syndrome (MetS) – similar trends of changes, different pathophysiology. Int J Mol Sci 2019; 20: 1719. [DOI] [PMC free article] [PubMed] [Google Scholar]
- 40. Oda E, Hatada K, Kimura J, et al. Relationships between serum unsaturated fatty acids and coronary risk factors: negative relations between nervonic acid and obesity-related risk factors. Int Heart J 2005; 46: 975–985. [DOI] [PubMed] [Google Scholar]
- 41. Shearer GC, Carrero JJ, Heimbürger O, et al. Plasma fatty acids in chronic kidney disease: nervonic acid predicts mortality. J Ren Nutr 2012; 22: 277–283. [DOI] [PubMed] [Google Scholar]
Associated Data
This section collects any data citations, data availability statements, or supplementary materials included in this article.
Supplementary Materials
Supplemental material, sj-docx-1-tae-10.1177_20420188221118750 for Association between the metabolic profile of serum fatty acids and diabetic nephropathy: a study conducted in northeastern China by Yazhuo Liu, Yingying Li, Hui Shen, Yike Li, Yanbing Xu, Mi Zhou, Xinghai Xia and Binyin Shi in Therapeutic Advances in Endocrinology and Metabolism