

Abstract
Objective
To evaluate the performance of a UK based prediction model for estimating fat-free mass (and indirectly fat mass) in children and adolescents in non-UK settings.
Design
Individual participant data meta-analysis.
Setting
19 countries.
Participants
5693 children and adolescents (49.7% boys) aged 4 to 15 years with complete data on the predictors included in the UK based model (weight, height, age, sex, and ethnicity) and on the independently assessed outcome measure (fat-free mass determined by deuterium dilution assessment).
Main outcome measures
The outcome of the UK based prediction model was natural log transformed fat-free mass (lnFFM). Predictive performance statistics of R2, calibration slope, calibration-in-the-large, and root mean square error were assessed in each of the 19 countries and then pooled through random effects meta-analysis. Calibration plots were also derived for each country, including flexible calibration curves.
Results
The model showed good predictive ability in non-UK populations of children and adolescents, providing R2 values of >75% in all countries and >90% in 11 of the 19 countries, and with good calibration (ie, agreement) of observed and predicted values. Root mean square error values (on fat-free mass scale) were <4 kg in 17 of the 19 settings. Pooled values (95% confidence intervals) of R2, calibration slope, and calibration-in-the-large were 88.7% (85.9% to 91.4%), 0.98 (0.97 to 1.00), and 0.01 (−0.02 to 0.04), respectively. Heterogeneity was evident in the R2 and calibration-in-the-large values across settings, but not in the calibration slope. Model performance did not vary markedly between boys and girls, age, ethnicity, and national income groups. To further improve the accuracy of the predictions, the model equation was recalibrated for the intercept in each setting so that country specific equations are available for future use.
Conclusion
The UK based prediction model, which is based on readily available measures, provides predictions of childhood fat-free mass, and hence fat mass, in a range of non-UK settings that explain a large proportion of the variability in observed fat-free mass, and exhibit good calibration performance, especially after recalibration of the intercept for each population. The model demonstrates good generalisability in both low-middle income and high income populations of healthy children and adolescents aged 4-15 years.
Introduction
The high global prevalence of obesity in childhood poses a major global public health challenge. The World Health Organization recently estimated that about 18% of children and adolescents aged 5-19 years worldwide (>340 million individuals) are affected by overweight or obesity.1 However, the most widely used marker of high childhood adiposity, body mass index (BMI), has serious limitations.2 3 4 BMI is poorly correlated with fat mass in childhood and, crucially, as a weight-for-height index, BMI is unable to discriminate between fat mass and fat-free mass, which can both vary markedly in individuals with a given BMI.3 This is important, as fat mass in children has been shown to be more strongly associated with long term risk of type 2 diabetes than markers of body fatness based on overall weight (of which BMI is such a marker).5 The availability of simple, accurate methods for assessment of fat mass could represent an important advance in the assessment of adiposity over the use of BMI.4 6 In vivo techniques for the assessment of fat mass do exist, such as bioelectrical impedance analysis, dual energy x ray absorptiometry, and magnetic resonance imaging (MRI), but may lack accuracy,4 7 8 and, in the case of dual energy x ray absorptiometry and MRI are inappropriate for general use. An alternative accurate method for assessment of fat mass, which has been developed and validated within the UK population of children and adolescents,6 9 is based on the prediction of fat-free mass (and indirectly fat mass, as fat mass=weight−fat-free mass) using simple assessments of height, weight, sex, age, and ethnicity. Ethnicity was also included as a predictor within the developed model to allow for established differences in body fatness in children between ethnicities.10 11 12 To maximise the accuracy of the predictions obtained from this approach, the model was developed using data on fat mass in children obtained from the deuterium dilution approach, a reference standard method of adiposity assessment, which provides accurate, safe, and minimally invasive measurements of total body water (and fat-free mass) with an error of less than 1%.13 14 The developed model was also shown to predict fat mass levels as accurately as dual energy x ray absorptiometry and bioelectrical impedance analysis in UK children.9 However, the predictive performance of the model has not so far been examined in children and adolescents outside the UK.15 We therefore performed an external validation of the UK based fat mass prediction model to assess its predictive performance in a wide range of non-UK populations of children and adolescents aged 4-15 years with comparable fat mass assessment from the reference standard deuterium dilution method.
Methods
Data sources and study population
We carried out a Medline literature search through PubMed to identify all published studies that used the deuterium dilution method13 14 to assess fat-free mass and fat mass in at least 100 healthy children or adolescents aged between 4 and 15 years and also included measurements of weight and height and basic personal information on age and sex (search dates: May 2020, search terms: “deuterium dilution”, “study”, “children” or “adolescents”). Twenty four relevant studies were identified; study authors were contacted and invited to contribute data to this investigation. Fourteen agreed to participate, four were unable to participate owing to data sharing restrictions, and the remaining six did not respond. Study collaborators provided data from a further four studies (of which, one contained unpublished deuterium dilution data16 and two were small17 18). Further information is available in the Preferred Reporting Items for Systematic Reviews and Meta-analyses individual participant data (PRISMA-IPD) flow diagram (see supplementary file). Each of the 18 studies provided data on weight, height, age, sex, ethnicity, and deuterium dilution assessed total body water, fat mass, and fat-free mass. The earliest study was conducted in 1981-8219 and the latest in 2017-1920; most studies (83%) were carried out from 2000 (see supplementary table 1). In total, 5715 generally healthy children and adolescents aged 4-15 years were included from 18 studies spanning 19 countries: Australia,17 Austria,19 Bangladesh,21 Brazil,22 China,23 Mexico,24 25 Namibia,20 Nepal,26 the Netherlands,27 New Zealand,10 the Philippines,23 Peru,18 Poland,16 Russia,23 South Africa,20 23 Spain,28 Sri Lanka,29 Tunisia,30 and the US31 32 (see supplementary table 1). Although five of these countries (Peru n=56, Spain n=92, China n=95, Philippines n=80, and Australia n=42) had smaller participant numbers than anticipated,17 18 23 28 the data were included to avoid data wastage.
Outcome and predictor assessment
The outcome was natural log transformed fat-free mass (lnFFM), ascertained using the deuterium dilution reference method,13 14 which was also used as the outcome for the previously developed UK based prediction model.6 Five individuals with missing information on the outcome (lnFFM), one individual with an implausible weight value, and 16 individuals with implausible fat-free mass values (ie, fat-free mass greater than weight) were excluded. No other data were missing on the predictors of weight, height, age, sex, or ethnicity (classified as either white, black, South Asian, other Asian, or other). After these exclusions, 5693 children and adolescents aged 4-15 years were included in analyses.
Statistical analysis
All statistical analyses were conducted in Stata (version 17). We followed the Transparent Reporting of a multivariable model for Individual Prognosis Or Diagnosis (TRIPOD) guideline for the reporting of studies validating a multivariable prediction model.15
Evaluation of overall performance of UK based prediction model equation
We applied the UK based model equation6 (fig 1) to all children and adolescents within this external validation dataset to obtain a prediction of lnFFM from weight, height, age, sex, and ethnicity.
Fig 1.
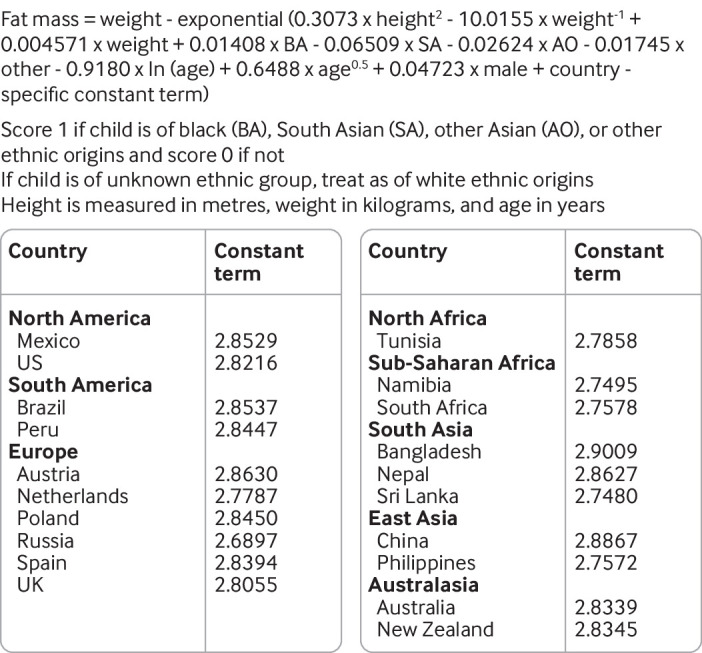
Recalibrated country specific model equations for prediction of natural log transformed fat-free mass in children and adolescents. Country specific constant term for UK obtained from equation provided in Hudda et al6
The predictive performance of the model equation was assessed within each country by comparing the deuterium dilution assessed lnFFM value with the predicted lnFFM value obtained from the UK based model. Model performance was assessed by examining established predictive performance measures of:
R2—the percentage of variance in deuterium dilution observed lnFFM explained by predicted lnFFM estimated by the UK based prediction model.
Root mean square error—the average difference between predicted lnFFM from the UK based model and the deuterium dilution observed lnFFM. Root mean square error indicates the absolute fit of the model to the data (ie, how close the model’s predicted values of lnFFM are to the deuterium dilution observed values of lnFFM).
-
Model calibration—assessed collectively by means of three measures: slope, calibration-in-the-large, and calibration plot.
Slope—obtained from the model regressing deuterium dilution observed values of lnFFM on model predicted values of lnFFM. The calibration slope reports on the accuracy of the predictions across the range of lnFFM values by evaluating the spread of the predicted values, and the slope has a target value of 1. A slope <1 suggests that predicted values are too high for children and adolescents with low observed values and too low for those with high observed values. A slope >1 suggests the opposite.
Calibration-in-the-large—intercept term obtained from a linear regression model of deuterium dilution observed values of lnFFM on model predicted values of lnFFM, where the slope is constrained to be the ideal of 1 (with a calibration-in-the-large of 0 being ideal). Calibration-in-the-large measures the overall agreement between average model predicted values of lnFFM and average deuterium dilution observed values of lnFFM (ie, it tells you about the systematic bias of predicted lnFFM obtained from the model when compared with the deuterium dilution observed values of lnFFM).
Calibration plot—graph of deuterium dilution observed lnFFM plotted against model predicted values of lnFFM with a local regression (loess) smoother fitted across all individuals to produce a flexible calibration curve (created using pmcalplot on Stata).
To summarise results across all countries, we pooled the country specific performance measures of R2, calibration slope, and calibration-in-the-large through a random effects meta-analysis to obtain an estimate of average performance and between country heterogeneity. The random effects meta-analysis model was fitted using the restricted maximum likelihood method33 using the Hartung-Knapp34 approach to adjust the standard error of the pooled performance measures. Heterogeneity was summarised for each of the performance measures of R2, calibration slope, and calibration-in-the-large using the estimate of between study variance (τ2) and a 95% prediction interval, which provides a range of values that the performance measure would be expected to fall within for a new individual setting.35 For the random effects meta-analysis, the variance and confidence interval for R2 was estimated using the Wald-type method outlined elsewhere,36 and 95% prediction intervals were capped at the maximum values of 100%. The model performance was also assessed within subgroups of sex, three year age groups (4-6, 7-9, 10-12, and 13-15 years), and ethnic origin. Additionally, the model performance was assessed separately in low-middle income and high income populations of children and adolescents, categorised using the World Bank income classification.37 The country specific classifications were obtained for the year of study commencement such that Australia, Austria, the Netherlands, New Zealand, Spain, the US, and Poland were classified as high income and the remaining 12 countries were classified as low-middle income.
Although the primary results focus on the model performance measures assessed comparing deuterium dilution observed values of lnFFM with model predicted lnFFM, as the UK based model was developed to predict fat-free mass on the log scale, root mean square error and calibration plots are also presented on the fat-free mass scale to improve the interpretability of the results.
Country specific recalibration of UK based prediction model equation
When systematic error in the UK based model’s prediction of lnFFM was observed across countries, we recalibrated the intercept term of the UK based equation to provide updated country specific equations. Within each country, we first estimated the linear predictor portion of the UK based model for all individuals before fitting a linear regression model with deuterium dilution observed values of lnFFM as the dependent variable and the linear predictor as the independent variable. The slope of this model was constrained to be 1, and the constant term from the model was used as the updated intercept term for that country. We re-examined the performance of the country specific recalibrated equations to assess the predictive performance of the updated model equations.
Patient and public involvement
For this external validation study based on secondary data analysis, no patients were directly involved in setting the research question, outcome measures, study design, or implementation. However, previous focus groups including members of the public had indicated the need to develop and validate new methods for body fatness assessment in children, which informed the development of this work. No patients were involved in the interpretation or writing up of results.
Results
Table 1 summarises the key characteristics of the 5693 children and adolescents included in the analysis, by country. The median age was 10.8 years—slightly higher than in the development population6 (median age 9.6 years). All studies included both boys and girls, except for one study that included only boys.19 Average levels of deuterium dilution assessed fat mass and fat-free mass were, as expected, higher in studies of older children, who were also generally taller and heavier than younger children (table 1). Median fat mass in this validation dataset (8.5 kg) was similar to that of the development population6 (8.4 kg), although fat-free mass was higher in this external validation dataset (27.8 kg) than in the development population (24.8 kg).6 The representation of different ethnic groups varied across the settings, with 15 countries including data from a single ethnic group (table 1).
Table 1.
Basic summary statistics of the analysis population, by country. Values are median (25th to 75th centile) unless stated otherwise
| Region and country (No of participants) | Age (years) | Height (m) | Weight (kg) | DD fat mass (kg)* | DD fat-free mass (kg)* | No (%) boys | Ethnic group (No, %) | ||||||
|---|---|---|---|---|---|---|---|---|---|---|---|---|---|
| White | Black | South Asian | Other Asian | Other | |||||||||
| North America | |||||||||||||
| Mexico (n=330) | 8.4 (7.4-9.9) | 1.30 (1.25-1.40) | 31.6 (24.6-40.8) | 7.6 (5.2-12.4) | 22.7 (19.6-28.4) | 170 (51.5) | 0 (0) | 0 (0) | 0 (0) | 0 (0) | 330 (100) | ||
| US (n=1810) | 10.6 (8.3-13.0) | 1.44 (1.30-1.58) | 39.2 (28.2-53.6) | 9.1 (5.7-15.0) | 28.5 (21.3-38.8) | 867 (47.9) | 571 (32) | 457 (25) | 2 (0.1) | 283 (16) | 497 (27) | ||
| South America | |||||||||||||
| Brazil (n=450) | 13.3 (13.1-13.6) | 1.58 (1.52-1.63) | 49.5 (42.5-56.3) | 10.1 (6.6-15.2) | 38.1 (34.0-43.4) | 236 (52.4) | 0 (0) | 0 (0) | 0 (0) | 0 (0) | 450 (100) | ||
| Peru (n=56) | 11.0 (8.5-13.5) | 1.46 (1.32-1.55) | 40.2 (32.4-50.6) | 9.4 (5.8-14.6) | 30.9 (23.9-35.5) | 25 (44.6) | 0 (0) | 0 (0) | 0 (0) | 0 (0) | 56 (100) | ||
| Europe | |||||||||||||
| Austria (n=107) | 12.0 (11.1-13.6) | 1.49 (1.42-1.60) | 40.1 (34.0-48.0) | 5.5 (4.2-8.5) | 33.2 (28.5-40.6) | 107 (100.0) | 107 (100) | 0 (0) | 0 (0) | 0 (0) | 0 (0) | ||
| Netherlands (n=716) | 13.5 (12.8-14.1) | 1.62 (1.57-1.68) | 51.3 (44.9-58.9) | 11.9 (8.8-16.9) | 38.6 (34.0-43.6) | 342 (47.8) | 716 (100) | 0 (0) | 0 (0) | 0 (0) | 0 (0) | ||
| Poland (n=174) | 7.3 (6.1-8.7) | 1.25 (1.18-1.34) | 24.6 (21.0-28.0) | 4.3 (3.3-5.8) | 20.0 (17.5-22.8) | 81 (46.6) | 174 (100) | 0 (0) | 0 (0) | 0 (0) | 0 (0) | ||
| Russia (n=197) | 10.8 (8.9-13.7) | 1.47 (1.34-1.62) | 37.9 (28.8-51.5) | 11.3 (8.3-17.3) | 25.8 (20.0-33.1) | 97 (49.2) | 0 (0) | 0 (0) | 0 (0) | 0 (0) | 197 (100) | ||
| Spain (n=92) | 14.0 (13.0-15.2) | 1.61 (1.55-1.68) | 55.8 (48.1-63.0) | 13.7 (8.8-17.9) | 42.7 (37.0-49.2) | 46 (50.0) | 89 (97) | 2 (2) | 0 (0) | 0 (0) | 1 (1) | ||
| North Africa | |||||||||||||
| Tunisia (n=155) | 9.0 (8.0-10.0) | 1.38 (1.31-1.44) | 32.0 (27.0-36.0) | 8.0 (6.4-11.1) | 23.1 (20.2-27.0) | 80 (51.6) | 0 (0) | 0 (0) | 0 (0) | 0 (0) | 155 (100) | ||
| Sub-Saharan Africa | |||||||||||||
| Namibia (n=151) | 10.0 (9.0-11.0) | 1.38 (1.33-1.46) | 33.3 (27.2-43.4) | 8.6 (6.1-14.5) | 23.6 (20.6-28.1) | 66 (43.7) | 0 (0) | 114 (76) | 0 (0) | 0 (0) | 37 (25) | ||
| South Africa (n=411) | 8.0 (7.0-8.8) | 1.24 (1.17-1.31) | 23.7 (20.4-28.3) | 5.5 (4.4-7.6) | 17.6 (15.3-21.2) | 175 (42.6) | 0 (0) | 411 (100) | 0 (0) | 0 (0) | 0 (0) | ||
| South Asia | |||||||||||||
| Bangladesh (n=187) | 5.1 (5.0-7.1) | 1.10 (1.02-1.17) | 15.8 (14.1-18.4) | 2.0 (1.4-2.8) | 13.6 (12.2-16.2) | 93 (49.7) | 0 (0) | 0 (0) | 187 (100) | 0 (0) | 0 (0) | ||
| Nepal (n=100) | 8.6 (8.3-9.0) | 1.23 (1.16-1.29) | 21.8 (18.0-25.8) | 4.2 (3.3-5.8) | 17.6 (14.6-20.2) | 49 (49.0) | 0 (0) | 0 (0) | 100 (100) | 0 (0) | 0 (0) | ||
| Sri Lanka (n=288) | 10.0 (7.6-12.2) | 1.37 (1.24-1.49) | 31.5 (23.0-41.1) | 9.1 (5.2-15.3) | 21.5 (16.2-27.1) | 162 (56.3) | 0 (0) | 0 (0) | 288 (100) | 0 (0) | 0 (0) | ||
| East Asia | |||||||||||||
| China (n=95) | 10.0 (9.4-10.6) | 1.38 (1.33-1.43) | 32.2 (27.4-37.0) | 6.2 (3.9-8.7) | 25.6 (22.8-28.2) | 48 (50.5) | 0 (0) | 0 (0) | 0 (0) | 95 (100) | 0 (0) | ||
| Philippines (n=80) | 15.4 (15.1-15.7) | 1.57 (1.52-1.64) | 48.9 (43.4-54.5) | 13.8 (9.5-17.2) | 34.9 (31.3-40.8) | 32 (40.0) | 0 (0) | 0 (0) | 0 (0) | 80 (100) | 0 (0) | ||
| Australasia | |||||||||||||
| Australia (n=42) | 8.2 (7.0-10.9) | 1.33 (1.19-1.43) | 27.2 (23.1-37.1) | 6.6 (4.2-11.0) | 21.9 (16.7-27.5) | 27 (64.3) | 0 (0) | 0 (0) | 42 (100) | 0 (0) | 0 (0) | ||
| New Zealand (n=252) | 10.1 (7.4-12.4) | 1.42 (1.27-1.54) | 36.5 (28.6-50.0) | 9.6 (6.3-15.6) | 27.2 (21.7-37.1) | 124 (49.2) | 82 (33) | 0 (0) | 0 (0) | 0 (0) | 170 (67) | ||
DD=deuterium dilution.
Assessment of UK based model performance in non-UK settings
The UK based model equation, when applied to the external validation data, produced high R2 values >75% in all countries and >90% in 11 of the 19 countries (table 2). When the country specific R2 values were pooled through random effects meta-analysis, the overall pooled R2 value was 88.66% (95% confidence interval 85.91% to 91.41%) (fig 2). The R2 values showed some evidence of between country heterogeneity (τ2=28.62), and the 95% prediction interval for the R2 value (ie, the expected range of R2 values that would be expected from applying the model to a previously unstudied population of children and adolescents) was 77.04% to 100.00%. Root mean square error values were generally low (≤0.11 in all countries except for Russia and Sri Lanka; table 2). The model demonstrated high levels of calibration in terms of the slope in each of the countries. The observed calibration slope estimates ranged between 0.91 in Spain and 1.05 in Australia and South Africa (table 2), with the country specific 95% confidence intervals around the respective slope term containing the ideal value of 1 in 15 of the 19 countries (table 2). The pooled calibration slope was 0.98 (95% confidence interval 0.97 to 1.00; fig 2), with no evidence of between country heterogeneity in the calibration slopes (τ2=0), and a 95% prediction interval of 0.92 to 1.05 for the calibration slope expected to be observed in a new country. Although the country specific calibration-in-the-large values were close to the ideal value of 0 for most countries, ranging from −0.12 in Russia to 0.10 in Bangladesh, the associated 95% confidence intervals failed to contain the ideal value of 0 in any of the settings (table 2). When pooled through random effects meta-analysis, the overall pooled calibration-in-the-large value was almost equal to the ideal value of 0 (0.01, 95% confidence interval −0.02 to 0.04; fig 2). Some heterogeneity was evident in the calibration-in-the-large values (τ2=0.0031), with a 95% prediction interval of −0.11 to 0.13 that would likely be observed in a new country. Graphically, the calibration plots also demonstrated the good levels of calibration across the range of lnFFM values within each of the countries (fig 3 and fig 4), including at the lower and upper ends of the distribution of lnFFM, with the flexible calibration curve close to the ideal 45 degree line of perfect calibration. However, the graphs further showed evidence of some systematic error in the prediction of lnFFM across settings (fig 3 and fig 4).
Table 2.
External validation predictive performance statistics based on natural log transformed fat-free mass, by country
| Region and country | No | R2 (%) (95% CI) | Calibration slope (95% CI) | Calibration-in-the-large (95% CI) | RMSE |
|---|---|---|---|---|---|
| North America | |||||
| Mexico | 330 | 92.95 (91.49 to 94.42) | 1.01 (0.98 to 1.04) | 0.05 (0.04 to 0.05) | 0.08 |
| US | 1810 | 93.32 (92.72 to 93.91) | 1.00 (0.99 to 1.01) | 0.02 (0.01 to 0.02) | 0.10 |
| South America | |||||
| Brazil | 450 | 76.69 (72.92 to 80.46) | 0.96 (0.91 to 1.01) | 0.05 (0.04 to 0.06) | 0.10 |
| Peru | 56 | 92.29 (88.41 to 96.17) | 0.94 (0.87 to 1.01) | 0.04 (0.02 to 0.06) | 0.09 |
| Europe | |||||
| Austria | 107 | 91.47 (88.37 to 94.56) | 0.96 (0.90 to 1.02) | 0.06 (0.05 to 0.07) | 0.09 |
| Netherlands | 716 | 81.53 (79.09 to 83.97) | 1.00 (0.97 to 1.04) | −0.03 (−0.03 to −0.02) | 0.09 |
| Poland | 174 | 93.28 (91.36 to 95.21) | 0.96 (0.92 to 0.99) | 0.04 (0.03 to 0.05) | 0.07 |
| Russia | 197 | 91.30 (88.98 to 93.62) | 0.93 (0.89 to 0.97) | −0.12 (−0.13 to −0.10) | 0.15 |
| Spain | 92 | 80.85 (73.82 to 87.89) | 0.91 (0.82 to 1.00) | 0.03 (0.01 to 0.05) | 0.10 |
| North Africa | |||||
| Tunisia | 155 | 80.98 (75.59 to 86.37) | 1.02 (0.94 to 1.10) | −0.02 (−0.03 to −0.01) | 0.08 |
| Sub-Saharan Africa | |||||
| Namibia | 151 | 90.14 (87.16 to 93.13) | 0.93 (0.88 to 0.98) | −0.06 (−0.07 to −0.05) | 0.09 |
| South Africa | 411 | 91.95 (90.46 to 93.44) | 1.05 (1.02 to 1.08) | −0.05 (−0.05 to −0.04) | 0.08 |
| South Asia | |||||
| Bangladesh | 187 | 89.50 (86.65 to 92.35) | 0.99 (0.94 to 1.04) | 0.10 (0.09 to 0.10) | 0.11 |
| Nepal | 100 | 91.66 (88.53 to 94.79) | 0.99 (0.93 to 1.04) | 0.06 (0.05 to 0.07) | 0.08 |
| Sri Lanka | 288 | 83.11 (79.56 to 86.67) | 0.99 (0.94 to 1.04) | −0.06 (−0.07 to −0.04) | 0.16 |
| East Asia | |||||
| China | 95 | 85.10 (79.57 to 90.63) | 0.98 (0.90 to 1.07) | 0.08 (0.07 to 0.10) | 0.11 |
| Philippines | 80 | 81.03 (73.55 to 88.51) | 1.04 (0.93 to 1.15) | −0.05 (−0.07 to −0.03) | 0.09 |
| Australasia | |||||
| Australia | 42 | 96.64 (94.65 to 98.64) | 1.05 (0.98 to 1.11) | 0.03 (0.01 to 0.05) | 0.07 |
| New Zealand | 252 | 92.96 (91.29 to 94.64) | 0.98 (0.94 to 1.01) | 0.03 (0.02 to 0.04) | 0.10 |
RMSE=root mean square error.
Fig 2.

Assessment of R2 values, calibration slope, and calibration-in-the-large based on natural log transformed fat-free mass, by country and overall. Overall estimates from random effect restricted maximum likelihood model with Hartung-Knapp standard errors. Purple line around the overall diamond indicates the 95% prediction intervals. Upper limit of the prediction interval for R2 capped at 100%
Fig 3.

Calibration assessment of the model based on natural log transformed fat-free mass (lnFFM) in the Americas and European countries. Solid black line represents line of equality. Dashed line is a loess smoother through the individual data points. Histogram is the distribution of predicted ln(FFM). Slope=calibration slope; CITL=calibration-in-the-large
Fig 4.

Calibration assessment of the model based on natural log transformed fat-free mass (lnFFM) in African, Asian, and Australasian countries. Solid black line represents line of equality. Dashed line is a loess smoother through the individual data points. Histogram is the distribution of predicted ln(FFM). Slope=calibration slope; CITL=calibration-in-the-large
The generally high model performance was maintained when assessed across subgroups of sex (see supplementary figure 1), three year age groups (see supplementary figure 2), ethnic groups (see supplementary figure 3), and national income level (table 3). The model showed low levels of heterogeneity in the performance statistics across the three year age groups (see supplementary figure 4) and ethnic groups (see supplementary figure 5).
Table 3.
External validation predictive performance statistics based on natural log transformed fat-free mass, by World Bank income classifications*
| Performance statistics | Low-middle income group† (n=2473) | High income group‡ (n=3193) |
|---|---|---|
| R2 (%) (95% CI) | 92.19 (91.60 to 92.78) | 93.64 (93.21 to 94.07) |
| Calibration slope (95% CI) | 0.98 (0.97 to 0.99) | 0.97 (0.97 to 0.98) |
| Calibration-in-the-large (95% CI) | −0.00 (−0.01 to 0.00) | 0.01 (0.01 to 0.01) |
| Root mean square error | 0.11 | 0.10 |
Ascertained for initial calendar year the study began.
Comprises low, lower middle, and upper middle income groups. Includes Bangladesh, Brazil, China, Mexico, Namibia, Nepal, Peru, the Philippines, Russia, South Africa, Sri Lanka, and Tunisia.
Includes Australia, Austria, the Netherlands, New Zealand, Spain, US, and Poland.
On the fat-free mass scale, the country specific root mean square error values ranged between 1.32 kg and 4.83 kg, with a root mean square error value of <4 kg in 17 of the 19 countries (see supplementary table 2). Calibration plots showed good levels of agreement between deuterium dilution observed fat-free mass and model predicted fat-free mass within each of the countries, including at the lower and upper ends of the distribution of fat-free mass, with the flexible calibration curve close to the ideal 45 degree line of perfect calibration (see supplementary figures 6a and 6b).
As a result of the observed systematic error in the UK based model’s prediction of lnFFM, the equation was recalibrated for the intercept term to provide updated country specific equations (fig 1) and calibration plots (see supplementary figures 7a and 7b). After recalibration, the calibration-in-the-large and root mean square error values were closer to the ideal values of 0 in all settings, with all of the country specific 95% confidence intervals for the calibration-in-the-large now containing the ideal value (see supplementary table 3).
Discussion
Principal findings
We externally validated the predictive performance of a recently proposed model using weight, height, age, sex, and ethnicity to estimate lnFFM, developed and validated within a UK population of children and adolescents, in 19 other countries from several regions of the world. The developed model equation generally showed good predictive ability in these new settings, with good calibration of observed and predicted values, demonstrating the generalisability of the model in populations of children and adolescents outside the UK. The model equation produced high R2 values >80% in all settings, with root mean square error values (expressed in terms of fat-free mass for interpretability) <4 kg in most of the settings. The root mean square error of 0.1 for lnFFM indicates an error of 10% on predicted fat-free mass values, which takes into account that the absolute error in any individual child or adolescent will depend on the magnitude of his or her fat-free mass. Notably, the predictive performance was consistently high among both low-middle income and high income countries. Although the calibration slope statistics were close to the ideal value of 1 for all countries, the calibration-in-the-large values suggested a small systematic error in the prediction of lnFFM across settings. Therefore, the model equation was recalibrated for the intercept term to provide updated country specific prediction equations. After recalibration, the model performance showed improvement in the calibration-in-the-large and root mean square error values in all settings as expected.
Comparison with other studies
A small number of previous studies have developed models to estimate body fatness in populations of children and adolescents outside the UK,38 39 40 41 42 43 producing R2 values >80% comparable with those observed in the present study. However, direct comparisons of the performance of those models with the model being validated in this study are difficult for several reasons. Firstly, while those models also produced high R2 values >80%, their outcomes (fat mass percentage) are different from the outcome of the current model (absolute fat-free mass values). Although fat mass needs to be standardised for height before interpretation or comparisons between individuals (typically expressed as a fat mass index or as fat mass percentage), the use of absolute values (of either fat mass or fat-free mass) as the outcome of the prediction model produces more accurate and precise predictions than estimating fat mass percentage, which is derived from fat mass and weight and is more variable than the absolute values. Furthermore, as discussed previously,6 we chose to estimate absolute fat mass values indirectly (by predicting fat-free mass from the model and subtracting estimates from weight to obtain predicted fat mass) rather than directly (using fat mass as the outcome of the model), as the variability in fat-free mass with height (one of the strongest predictors of body composition) was more homogeneous than for fat mass and thus the indirect approach resulted in more precise fat mass predictions. We believe this modelling decision was one of the main reasons for the high predictive performance observed. Secondly, neither the calibration slopes nor the calibration-in-the-large values were assessed for these models. Thirdly, these models largely used dual energy x ray absorptiometry as the reference method for assessing body fatness (ie, as the outcome for model development). Estimation of fat mass using dual energy x ray absorptiometry is, however, prone to low levels of accuracy,4 7 8 44 45 which varies considerably by body shape, sex,8 44 and different dual energy x ray absorptiometry devices and software used. Finally, most models used additional measurements, including skinfold thickness, waist circumference, or bioelectrical impedance to estimate fat mass, rather than being based on readily available anthropometric and demographic predictors.39 40 41 42 43 One such study, which used the same data on Tunisian children used in our present study, also developed a prediction model to estimate fat-free mass.30 However, the model was not based on readily available predictors as it relied on resistance from bioimpedance analysis and was not corrected for model optimism, which may explain why the model equation produced a R2 value of 91.8% compared with the value of 81.0% obtained in the present study.
Strengths and limitations of this study
The current investigation had several strengths in its approach to validating the developed UK based prediction model. Crucially, from each of the 19 countries, body fatness assessments were made using the same reference standard deuterium dilution method on which the UK based model was based,6 which provides accurate, safe, and minimally invasive measurements of total body water (and fat-free mass) with low error.13 14 Most studies included in this external validation were conducted recently and were sufficiently large to provide accurate estimates of the country specific prediction performance statistics. The pooled data used for this external validation across the 19 settings spanned a wide age range of participants aged 4-15 years, allowing us to obtain an accurate picture of the model performance across childhood and adolescence in the new settings. The maintained high predictive performance of the model at both the lower and the upper ends of the distribution of fat-free mass indicates the model’s potential utility for population based obesity surveillance (for example, in the English National Child Measurement Programme and the WHO Childhood Obesity Surveillance Initiative). The populations included about equal numbers of both high (56%) and low to middle income countries, which allowed for accurate subgroup assessment by income classification.
The study also had some limitations. Firstly, global representation was limited, with only a small number of participants included from East Asia and none from the Middle East. Secondly, five countries had fewer than 100 participants, which impacted the representativeness of the results and the precision of estimates obtained from these populations, although predictive performance statistics from these populations were consistent with those of the larger countries. Finally, deuterium dilution assessment involves estimating total body water, which is then converted into an estimate of fat-free mass using a chosen hydration constant.46 The hydration constants used across the individual studies were those originally applied by individual study authors. The study results were not, however, materially affected (results not presented) when using a consistent hydration constant46 for all studies, and therefore the choice of hydration constants is unlikely to have affected the results appreciably.
Implications for clinicians and policy makers
Although BMI is widely used because of its simplicity and reliance solely on measures of height and weight, it has well recognised serious limitations as a marker of body fatness in children.2 3 4 For example, BMI is unable to discriminate between fat mass and fat-free mass, and it has been shown that even at a given BMI among children of the same age and sex, both fat mass and fat-free mass can vary substantially,3 which is particularly concerning in light of evidence that, independent of height, fat mass in childhood is strongly associated with emerging cardiometabolic risk47 48 49 50 51 52 53 54 55 56 and is more strongly related with risk of type 2 diabetes in adulthood than overall weight (on which BMI is directly based).5 Furthermore, it has been suggested that fat-free mass, independent of fat mass, also has implications on adverse health conditions. This emphasises the needed for a shift away from proxy weight-for-height indices such as BMI, which produce inaccurate body fatness assessment in children12 57 58 59 and result in a large proportion being misdiagnosed with overweight or obesity, and towards more direct and accurate assessment of fat mass. The availability of the extensively validated prediction model provides a major advancement within this area of body fatness assessment in children. The accuracy and simplicity of the model, relying solely on readily available non-invasive measurements to assess fat-free mass and thus fat mass (fat mass=weight–exponential[predicted lnFFM]), has implications for its wider applicability both in routine healthcare practice and in population-wide obesity surveillance, monitoring, and prevention initiatives where more complex measurements of body fatness (such as waist circumference and skinfold thickness) are not so readily available. The consistency of the model performance across settings also strengthens the conclusions that the model, particularly after recalibration at local level, minimises the bias in fat-free mass predictions across a wide range of settings. However, the UK based model before local country specific recalibration of the intercept terms was shown to have good predictive ability across the settings, both in high and in low-middle income populations, and thus can be implemented in childhood settings where a recalibrated equation is not provided.
Body fatness markers require standardisation for height to minimise their correlation with height,60 to provide a consistent measure across age and sex, allowing for efficient monitoring and tracking of body fatness in childhood. Two common approaches to provide appropriate standardisation of fat mass for height are to convert fat mass to fat mass percentage (fat mass/weight×100) or to fat mass index (fat mass/heightp, where p is the power of height needed to obtain maximum height independence in the population of interest). Fat mass assessment (using either the updated country specific model equation provided when available or the original UK based model), after height standardisation (either as fat mass percentage or as fat mass index), can then be used in conjunction with respective established reference curves61 62 63 for improved surveillance, management, and prevention of obesity in childhood. A MS Excel calculator has been developed (see supplementary file) to allow for simple calculation of fat-free mass, fat mass, and fat mass percentage from the relevant predictor variables. Assessments of fat mass can also be made readily available to clinicians by embedding the validated equation within existing computer software used by general practitioners and paediatricians. This approach would be consistent with the use of other prediction algorithms in clinical practice, such as the QRISK3 or Framingham risk score (cardiovascular disease).64 65 It would also be possible and straightforward to apply the algorithms within existing obesity surveillance initiatives for children such as the English National Child Measurement Programme and the WHO Childhood Obesity Surveillance Initiative, to provide assessments of fat mass, fat-free mass, and fat mass index or fat mass percentage.
Further research
Further external validation of the model in countries or regions not included within this study would be of value. Additionally, the development of sex and age specific fat mass reference values, based on prospectively associated risks of diseases associated with obesity, could allow individuals to be classified into groups based on future disease risk attributable to their current fat mass levels, as opposed to current centile based approaches to classify fat mass.61
What is already known on this topic
Improvements to the assessment of body fatness in children, currently based on body mass index (BMI), are required
Assessment of childhood fat mass, which is more strongly related with risk of type 2 diabetes in adulthood than weight (on which BMI is based), could provide improvements
A prediction model that accurately estimates fat mass levels in healthy children and adolescents has been developed and validated for the UK population, but its performance in other populations is unknown
What this study adds
This external validation study found strong predictive performance of the UK based model at estimating fat-free mass in a wide range of non-UK settings
The equation, which is based on readily available markers of height, weight, age, sex, and ethnic group, performed consistently well in both low-middle and high income settings, showing its wider generalisability
The recalibrated model equations for each of the 19 countries further improve the accuracy of fat-free mass predictions and are recommended for future use
Acknowledgments
We thank John Reilly for his advice on data sources and data access; Cara L Eckhardt, Josephine Avila, Igor Y Kon, and Jinzhong Wang from the Eckhardt et al study23; and all staff involved in recruitment and data collection from the included studies. Data gathered from South Africa was supported by South Africa Medical Research Council and National Research Foundation.
Web extra.
Extra material supplied by authors
Supplementary information: supplementary tables 1-3, figures 1-7, and PRISMA flow diagram
Supplementary information: Excel spreadsheet showing fat mass calculator for children and adolescents
Contributors: MTH, RDR, CGO, PHW, and CMN designed the study. LSA, JRAA, MNA, MNB, JB, HBJ, BC, EAC, GJC, PSWD, MD, DD, DG, EVG, FH, MH, IK, AM, MAM, LO, HLN, GP, FFR, AER, ER, RJS, JGS, GHtH, JV, JCKW, and VPW collected the data. MTH, RDR, and CMN analysed the data. MTH, RDR, CGO, PHW, and CMN interpreted the data. MTH, RDR, CGO, PHW, and CMN drafted the manuscript. All authors critically evaluated and revised the manuscript. The corresponding author MTH attests that all listed authors meet authorship criteria and that no others meeting the criteria have been omitted. MTH is the guarantor.
Funding: MH was funded by a British Heart Foundation PhD studentship (FS/17/76/33286) in the early stages of this investigation and is supported by St George’s, University of London. CMN was supported by the Wellcome Trust Institutional Strategic Support Fund (204809/Z/16/Z) awarded to St George’s, University of London. This research was supported by the National Institute for Health and Care Research (NIHR) Applied Research Collaboration South London. The views expressed in this paper are those of the authors and not necessarily those of the NIHR, the Department of Health and Social Care or other funding agencies. The funders had no role in considering the study design or in the collection, analysis, interpretation of data, writing of the report, or decision to submit the article for publication.
Competing interests: All authors have completed the ICMJE uniform disclosure form and declare: this research was supported by grants from the British Heart Foundation, the Wellcome Trust, and the National Institute for Health and Care Research Applied Research Collaboration South London; no financial relationships with any organisations that might have an interest in the submitted work in the previous three years; no other relationships or activities that could appear to have influenced the submitted work.
The lead author (MTH) affirms that the manuscript is an honest, accurate, and transparent account of the study being reported; that no important aspects of the study have been omitted; and that any discrepancies from the study as planned (and, if relevant, registered) have been explained.
Dissemination to participants and related patient and public communities: We plan to disseminate these research findings to relevant stakeholders by presenting our findings at obesity related conferences, by sharing the findings with The Office for Health Improvement and Disparities (formerly Public Health England) who are responsible for the English National Child Measurement Programme and the WHO Childhood Obesity Surveillance Initiative Steering Group members, and by making plain language summaries available on social media.
Provenance and peer review: Not commissioned; externally peer reviewed.
Ethics statements
Ethical approval
Not required as this study is based on secondary data analysis.
Data availability statement
Data from the individual studies are available on request to the respective principal investigators.
References
- 1.World Health Organization. Obesity and overweight 2018. https://www.who.int/news-room/fact-sheets/detail/obesity-and-overweight (accessed 09/12/2020).
- 2. Hall DM, Cole TJ. What use is the BMI? Arch Dis Child 2006;91:283-6. 10.1136/adc.2005.077339 [DOI] [PMC free article] [PubMed] [Google Scholar]
- 3. Wells JC. A Hattori chart analysis of body mass index in infants and children. Int J Obes Relat Metab Disord 2000;24:325-9. [DOI] [PubMed] [Google Scholar]
- 4. Wells JC, Fewtrell MS. Measuring body composition. Arch Dis Child 2006;91:612-7. 10.1136/adc.2005.085522 [DOI] [PMC free article] [PubMed] [Google Scholar]
- 5. Hudda MT, Aarestrup J, Owen CG, et al. Association of Childhood Fat Mass and Weight With Adult-Onset Type 2 Diabetes in Denmark. JAMA Netw Open 2021;4:e218524. 10.1001/jamanetworkopen.2021.8524 [DOI] [PMC free article] [PubMed] [Google Scholar]
- 6. Hudda MT, Fewtrell MS, Haroun D, et al. Development and validation of a prediction model for fat mass in children and adolescents: meta-analysis using individual participant data. BMJ 2019;366:l4293. 10.1136/bmj.l4293 [DOI] [PMC free article] [PubMed] [Google Scholar]
- 7. Williams JE, Wells JC, Wilson CM, Haroun D, Lucas A, Fewtrell MS. Evaluation of Lunar Prodigy dual-energy X-ray absorptiometry for assessing body composition in healthy persons and patients by comparison with the criterion 4-component model. Am J Clin Nutr 2006;83:1047-54. 10.1093/ajcn/83.5.1047 [DOI] [PubMed] [Google Scholar]
- 8. Reilly JJ, Gerasimidis K, Paparacleous N, et al. Validation of dual-energy x-ray absorptiometry and foot-foot impedance against deuterium dilution measures of fatness in children. Int J Pediatr Obes 2010;5:111-5. [DOI] [PubMed] [Google Scholar]
- 9. Hudda MT, Owen CG, Rudnicka AR, Cook DG, Whincup PH, Nightingale CM. Quantifying childhood fat mass: comparison of a novel height-and-weight-based prediction approach with DXA and bioelectrical impedance. Int J Obes (Lond) 2021;45:99-103. 10.1038/s41366-020-00661-w [DOI] [PMC free article] [PubMed] [Google Scholar]
- 10. Rush EC, Puniani K, Valencia ME, Davies PS, Plank LD. Estimation of body fatness from body mass index and bioelectrical impedance: comparison of New Zealand European, Maori and Pacific Island children. Eur J Clin Nutr 2003;57:1394-401. 10.1038/sj.ejcn.1601701 [DOI] [PubMed] [Google Scholar]
- 11. Shaw NJ, Crabtree NJ, Kibirige MS, Fordham JN. Ethnic and gender differences in body fat in British schoolchildren as measured by DXA. Arch Dis Child 2007;92:872-5. 10.1136/adc.2007.117911 [DOI] [PMC free article] [PubMed] [Google Scholar]
- 12. Hudda MT, Nightingale CM, Donin AS, et al. Body mass index adjustments to increase the validity of body fatness assessment in UK Black African and South Asian children. Int J Obes (Lond) 2017;41:1048-55. 10.1038/ijo.2017.75 [DOI] [PMC free article] [PubMed] [Google Scholar]
- 13. Deurenberg P, Yap M. The assessment of obesity: methods for measuring body fat and global prevalence of obesity. Baillieres Best Pract Res Clin Endocrinol Metab 1999;13:1-11. 10.1053/beem.1999.0003 [DOI] [PubMed] [Google Scholar]
- 14. Wells JC, Fuller NJ, Dewit O, Fewtrell MS, Elia M, Cole TJ. Four-component model of body composition in children: density and hydration of fat-free mass and comparison with simpler models. Am J Clin Nutr 1999;69:904-12. 10.1093/ajcn/69.5.904 [DOI] [PubMed] [Google Scholar]
- 15. Moons KG, Altman DG, Reitsma JB, et al. Transparent Reporting of a multivariable prediction model for Individual Prognosis or Diagnosis (TRIPOD): explanation and elaboration. Ann Intern Med 2015;162:W1-73. 10.7326/M14-0698 [DOI] [PubMed] [Google Scholar]
- 16. Desmond MA, Sobiecki JG, Jaworski M, et al. Growth, body composition, and cardiovascular and nutritional risk of 5- to 10-y-old children consuming vegetarian, vegan, or omnivore diets. Am J Clin Nutr 2021;113:1565-77. 10.1093/ajcn/nqaa445 [DOI] [PMC free article] [PubMed] [Google Scholar]
- 17. Wickramasinghe VP, Cleghorn GJ, Edmiston KA, Murphy AJ, Abbott RA, Davies PS. Validity of BMI as a measure of obesity in Australian white Caucasian and Australian Sri Lankan children. Ann Hum Biol 2005;32:60-71. 10.1080/03014460400027805 [DOI] [PubMed] [Google Scholar]
- 18. Danysh HE, Gilman RH, Wells JC, et al. El Niño adversely affected childhood stature and lean mass in northern Peru. Clim Change Responses 2014;1:7 10.1186/s40665-014-0007-z. [DOI] [Google Scholar]
- 19. Haschke F. Body composition of adolescent males. Part I. Total body water in normal adolescent males. Part II. Body composition of the male reference adolescent. Acta Paediatr Scand Suppl 1983;307:1-23. [PubMed] [Google Scholar]
- 20. Diouf A, Adom T, Aouidet A, et al. Body mass index vs deuterium dilution method for establishing childhood obesity prevalence, Ghana, Kenya, Mauritius, Morocco, Namibia, Senegal, Tunisia and United Republic of Tanzania. Bull World Health Organ 2018;96:772-81. 10.2471/BLT.17.205948 [DOI] [PMC free article] [PubMed] [Google Scholar]
- 21. Khan AI, Hawkesworth S, Hawlader MD, et al. Body composition of Bangladeshi children: comparison and development of leg-to-leg bioelectrical impedance equation. J Health Popul Nutr 2012;30:281-90. 10.3329/jhpn.v30i3.12291 [DOI] [PMC free article] [PubMed] [Google Scholar]
- 22. Reichert FF, Wells JC, Ekelund U, Menezes AM, Victora CG, Hallal PC. Prospective Associations Between Physical Activity Level and Body Composition in Adolescence: 1993 Pelotas (Brazil) Birth Cohort. J Phys Act Health 2015;12:834-9. 10.1123/jpah.2013-0509 [DOI] [PubMed] [Google Scholar]
- 23. Eckhardt CL, Adair LS, Caballero B, et al. Estimating body fat from anthropometry and isotopic dilution: a four-country comparison. Obes Res 2003;11:1553-62. 10.1038/oby.2003.207 [DOI] [PubMed] [Google Scholar]
- 24. Ballesteros-Vásquez MN, Guerrero-Alcocer EV, Grijalva Haro MI, Ramírez-López E, Robles-Sardin AE. Effect of ingestion and excretion of fluids in determining body composition with deuterium dilution method in school children. Nutr Hosp 2015;32:1324-8. [DOI] [PubMed] [Google Scholar]
- 25. Mendoza Pablo PA, Valdés J, Ortiz-Hernández L. Accuracy of body mass index for age to diagnose obesity in Mexican schoolchildren. Nutr Hosp 2015;31:2668-75. [DOI] [PubMed] [Google Scholar]
- 26. Devakumar D, Grijalva-Eternod CS, Roberts S, et al. Body composition in Nepalese children using isotope dilution: the production of ethnic-specific calibration equations and an exploration of methodological issues. PeerJ 2015;3:e785. 10.7717/peerj.785 [DOI] [PMC free article] [PubMed] [Google Scholar]
- 27. Ten Hoor GA, Rutten GM, Van Breukelen GJP, et al. Strength exercises during physical education classes in secondary schools improve body composition: a cluster randomized controlled trial. Int J Behav Nutr Phys Act 2018;15:92. 10.1186/s12966-018-0727-8 [DOI] [PMC free article] [PubMed] [Google Scholar]
- 28. Alvero-Cruz JR, Alvarez Carnero E, Fernández-García JC, Barrera Expósito J, Carrillo de Albornoz Gil M, Sardinha LB. [Validity of body mass index and fat mass index as indicators of overweight status in Spanish adolescents: Esccola Study]. Med Clin (Barc) 2010;135:8-14. 10.1016/j.medcli.2010.01.017 [DOI] [PubMed] [Google Scholar]
- 29. Wickramasinghe VP, Lamabadusuriya SP, Cleghorn GJ, Davies PS. Validity of currently used cutoff values of body mass index as a measure of obesity in Sri Lankan children. Ceylon Med J 2009;54:114-9. 10.4038/cmj.v54i4.1451 [DOI] [PubMed] [Google Scholar]
- 30. Ben Jemaa H, Mankaï A, Khlifi S, et al. Development and validation of impedance-based equations for the prediction of total body water and fat-free mass in children aged 8-11 years. Clin Nutr 2019;38:227-33. [DOI] [PubMed] [Google Scholar]
- 31. Horlick M, Arpadi SM, Bethel J, et al. Bioelectrical impedance analysis models for prediction of total body water and fat-free mass in healthy and HIV-infected children and adolescents. Am J Clin Nutr 2002;76:991-9. 10.1093/ajcn/76.5.991 [DOI] [PubMed] [Google Scholar]
- 32. Shypailo RJ, Wong WW. Fat and fat-free mass index references in children and young adults: assessments along racial and ethnic lines. Am J Clin Nutr 2020;112:566-75. 10.1093/ajcn/nqaa128 [DOI] [PubMed] [Google Scholar]
- 33. Viechtbauer W. Bias and Efficiency of Meta-Analytic Variance Estimators in the Random-Effects Model. J Educ Behav Stat 2005;30:261-93 10.3102/10769986030003261. [DOI] [Google Scholar]
- 34. Hartung J, Knapp G. On tests of the overall treatment effect in meta-analysis with normally distributed responses. Stat Med 2001;20:1771-82. 10.1002/sim.791 [DOI] [PubMed] [Google Scholar]
- 35. Riley RD, Higgins JPT, Deeks JJ. Interpretation of random effects meta-analyses. BMJ 2011;342:d549. 10.1136/bmj.d549 [DOI] [PubMed] [Google Scholar]
- 36. Tan LJ. Confidence Intervals for Comparison of the Squared Multiple Correlation Coefficients of Non-nested Models. The University of Western Ontario, 2012. [Google Scholar]
- 37.The World Bank. The world by income 2020. https://datatopics.worldbank.org/world-development-indicators/the-world-by-income-and-region.html (accessed 22/12/2021).
- 38. Dugas LR, Cao G, Luke AH, Durazo-Arvizu RA. Adiposity is not equal in a multi-race/ethnic adolescent population: NHANES 1999-2004. Obesity (Silver Spring) 2011;19:2099-101. 10.1038/oby.2011.52 [DOI] [PubMed] [Google Scholar]
- 39. Stevens J, Cai J, Truesdale KP, Cuttler L, Robinson TN, Roberts AL. Percent body fat prediction equations for 8- to 17-year-old American children. Pediatr Obes 2014;9:260-71. 10.1111/j.2047-6310.2013.00175.x [DOI] [PMC free article] [PubMed] [Google Scholar]
- 40. Stevens J, Ou FS, Cai J, Heymsfield SB, Truesdale KP. Prediction of percent body fat measurements in Americans 8 years and older. Int J Obes (Lond) 2016;40:587-94. 10.1038/ijo.2015.231 [DOI] [PMC free article] [PubMed] [Google Scholar]
- 41. Stevens J, Truesdale KP, Cai J, Ou FS, Reynolds KR, Heymsfield SB. Nationally representative equations that include resistance and reactance for the prediction of percent body fat in Americans. Int J Obes (Lond) 2017;41:1669-75. 10.1038/ijo.2017.167 [DOI] [PMC free article] [PubMed] [Google Scholar]
- 42. Truesdale KP, Roberts A, Cai J, Berge JM, Stevens J. Comparison of Eight Equations That Predict Percent Body Fat Using Skinfolds in American Youth. Child Obes 2016;12:314-23. 10.1089/chi.2015.0020 [DOI] [PMC free article] [PubMed] [Google Scholar]
- 43. Lohman TG, Caballero B, Himes JH, et al. Estimation of body fat from anthropometry and bioelectrical impedance in Native American children. Int J Obes Relat Metab Disord 2000;24:982-8. 10.1038/sj.ijo.0801318 [DOI] [PubMed] [Google Scholar]
- 44. Sinaiko AR, Donahue RP, Jacobs DR, Jr, Prineas RJ. Relation of weight and rate of increase in weight during childhood and adolescence to body size, blood pressure, fasting insulin, and lipids in young adults. The Minneapolis Children’s Blood Pressure Study. Circulation 1999;99:1471-6. 10.1161/01.CIR.99.11.1471 [DOI] [PubMed] [Google Scholar]
- 45. Wong WW, Hergenroeder AC, Stuff JE, Butte NF, Smith EO, Ellis KJ. Evaluating body fat in girls and female adolescents: advantages and disadvantages of dual-energy X-ray absorptiometry. Am J Clin Nutr 2002;76:384-9. 10.1093/ajcn/76.2.384 [DOI] [PubMed] [Google Scholar]
- 46. Wells JC, Williams JE, Chomtho S, et al. Pediatric reference data for lean tissue properties: density and hydration from age 5 to 20 y. Am J Clin Nutr 2010;91:610-8. 10.3945/ajcn.2009.28428 [DOI] [PubMed] [Google Scholar]
- 47. Steinberger J, Jacobs DR, Raatz S, Moran A, Hong CP, Sinaiko AR. Comparison of body fatness measurements by BMI and skinfolds vs dual energy X-ray absorptiometry and their relation to cardiovascular risk factors in adolescents. Int J Obes (Lond) 2005;29:1346-52. 10.1038/sj.ijo.0803026 [DOI] [PubMed] [Google Scholar]
- 48. Lindsay RS, Hanson RL, Roumain J, Ravussin E, Knowler WC, Tataranni PA. Body mass index as a measure of adiposity in children and adolescents: relationship to adiposity by dual energy x-ray absorptiometry and to cardiovascular risk factors. J Clin Endocrinol Metab 2001;86:4061-7. 10.1210/jcem.86.9.7760 [DOI] [PubMed] [Google Scholar]
- 49. Falaschetti E, Hingorani AD, Jones A, et al. Adiposity and cardiovascular risk factors in a large contemporary population of pre-pubertal children. Eur Heart J 2010;31:3063-72. 10.1093/eurheartj/ehq355 [DOI] [PMC free article] [PubMed] [Google Scholar]
- 50. Whincup PH, Gilg JA, Donald AE, et al. Arterial distensibility in adolescents: the influence of adiposity, the metabolic syndrome, and classic risk factors. Circulation 2005;112:1789-97. 10.1161/CIRCULATIONAHA.104.532663 [DOI] [PubMed] [Google Scholar]
- 51. Samouda H, de Beaufort C, Stranges S, et al. Adding anthropometric measures of regional adiposity to BMI improves prediction of cardiometabolic, inflammatory and adipokines profiles in youths: a cross-sectional study. BMC Pediatr 2015;15:168. 10.1186/s12887-015-0486-5 [DOI] [PMC free article] [PubMed] [Google Scholar]
- 52. Gutin B, Islam S, Manos T, Cucuzzo N, Smith C, Stachura ME. Relation of percentage of body fat and maximal aerobic capacity to risk factors for atherosclerosis and diabetes in black and white seven- to eleven-year-old children. J Pediatr 1994;125:847-52. 10.1016/S0022-3476(05)81997-3 [DOI] [PubMed] [Google Scholar]
- 53. Wells JC, Cole TJ. Height, adiposity and hormonal cardiovascular risk markers in childhood: how to partition the associations? Int J Obes (Lond) 2014;38:930-5. 10.1038/ijo.2014.24 [DOI] [PMC free article] [PubMed] [Google Scholar]
- 54. Weber DR, Leonard MB, Shults J, Zemel BS. A comparison of fat and lean body mass index to BMI for the identification of metabolic syndrome in children and adolescents. J Clin Endocrinol Metab 2014;99:3208-16. 10.1210/jc.2014-1684 [DOI] [PMC free article] [PubMed] [Google Scholar]
- 55. Gishti O, Gaillard R, Durmus B, et al. BMI, total and abdominal fat distribution, and cardiovascular risk factors in school-age children. Pediatr Res 2015;77:710-8. 10.1038/pr.2015.29 [DOI] [PubMed] [Google Scholar]
- 56. Nightingale CM, Rudnicka AR, Owen CG, et al. Influence of adiposity on insulin resistance and glycemia markers among U.K. Children of South Asian, black African-Caribbean, and white European origin: child heart and health study in England. Diabetes Care 2013;36:1712-9. 10.2337/dc12-1726 [DOI] [PMC free article] [PubMed] [Google Scholar]
- 57. L’Abée C, Visser GH, Liem ET, Kok DE, Sauer PJ, Stolk RP. Comparison of methods to assess body fat in non-obese six to seven-year-old children. Clin Nutr 2010;29:317-22. 10.1016/j.clnu.2009.11.009 [DOI] [PubMed] [Google Scholar]
- 58. Freedman DS, Sherry B. The validity of BMI as an indicator of body fatness and risk among children. Pediatrics 2009;124(Suppl 1):S23-34. 10.1542/peds.2008-3586E [DOI] [PubMed] [Google Scholar]
- 59. Simmonds M, Llewellyn A, Owen CG, Woolacott N. Simple tests for the diagnosis of childhood obesity: a systematic review and meta-analysis. Obes Rev 2016;17:1301-15. 10.1111/obr.12462 [DOI] [PubMed] [Google Scholar]
- 60. Benn RT. Some mathematical properties of weight-for-height indices used as measures of adiposity. Br J Prev Soc Med 1971;25:42-50. 10.1136/jech.25.1.42 [DOI] [PMC free article] [PubMed] [Google Scholar]
- 61. McCarthy HD, Cole TJ, Fry T, Jebb SA, Prentice AM. Body fat reference curves for children. Int J Obes (Lond) 2006;30:598-602. 10.1038/sj.ijo.0803232 [DOI] [PubMed] [Google Scholar]
- 62. Wells JC, Williams JE, Chomtho S, et al. Body-composition reference data for simple and reference techniques and a 4-component model: a new UK reference child. Am J Clin Nutr 2012;96:1316-26. 10.3945/ajcn.112.036970 [DOI] [PubMed] [Google Scholar]
- 63. Weber DR, Moore RH, Leonard MB, Zemel BS. Fat and lean BMI reference curves in children and adolescents and their utility in identifying excess adiposity compared with BMI and percentage body fat. Am J Clin Nutr 2013;98:49-56. 10.3945/ajcn.112.053611 [DOI] [PMC free article] [PubMed] [Google Scholar]
- 64. Wilson PW, D’Agostino RB, Levy D, Belanger AM, Silbershatz H, Kannel WB. Prediction of coronary heart disease using risk factor categories. Circulation 1998;97:1837-47. 10.1161/01.CIR.97.18.1837 [DOI] [PubMed] [Google Scholar]
- 65. Hippisley-Cox J, Coupland C, Brindle P. Development and validation of QRISK3 risk prediction algorithms to estimate future risk of cardiovascular disease: prospective cohort study. BMJ 2017;357:j2099. 10.1136/bmj.j2099 [DOI] [PMC free article] [PubMed] [Google Scholar]
Associated Data
This section collects any data citations, data availability statements, or supplementary materials included in this article.
Supplementary Materials
Supplementary information: supplementary tables 1-3, figures 1-7, and PRISMA flow diagram
Supplementary information: Excel spreadsheet showing fat mass calculator for children and adolescents
Data Availability Statement
Data from the individual studies are available on request to the respective principal investigators.