Abstract
Thyroid-associated ophthalmopathy (TAO) is a very common autoimmune orbital disease. Approximately 4%–8% of TAO patients will deteriorate and develop the most severe dysthyroid optic neuropathy (DON). According to the current data provided by clinical experts, there is still a certain proportion of suspected DON patients who cannot be diagnosed, and the clinical evaluation has low sensitivity and specificity. There is an urgent need for an efficient and accurate method to assist physicians in identifying DON. This study proposes a hybrid deep learning model to accurately identify suspected DON patients using computed tomography (CT). The hybrid model is mainly composed of the double multiscale and multi attention fusion module (DMs-MAFM) and a deep convolutional neural network. The DMs-MAFM is the feature extraction module proposed in this study, and it contains a multiscale feature fusion algorithm and improved channel attention and spatial attention, which can capture the features of tiny objects in the images. Multiscale feature fusion is combined with an attention mechanism to form a multilevel feature extraction module. The multiscale fusion algorithm can aggregate different receptive field features, and then fully obtain the channel and spatial correlation of the feature map through the multiscale channel attention aggregation module and spatial attention module, respectively. According to the experimental results, the hybrid model proposed in this study can accurately identify suspected DON patients, with Accuracy reaching 96%, Specificity reaching 99.5%, Sensitivity reaching 94%, Precision reaching 98.9% and F1-score reaching 96.4%. According to the evaluation by experts, the hybrid model proposed in this study has some enlightening significance for the diagnosis and prediction of clinically suspect DON.
Graphical abstract
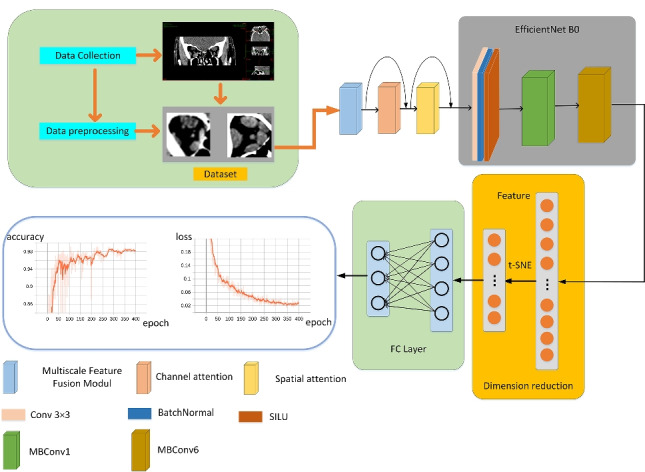
Keywords: Deep learning, Convolutional neural network, Thyroid-associated ophthalmopathy, Dysthyroid optic neuropathy, Medical imaging prediction
Highlights
It proposes a deep learning hybrid model for predicting suspected DON.
It proposes a new attention module that can improve the detail feature extraction ability of deep convolutional neural networks.
It shows the importance of deep feature extraction for disease diagnosis.
It will provide a priori knowledge for the application of deep learning in the study of thyroid-related eye diseases in the future.
It demonstrates the effect of combining attentional the mechanism with deep convolutional networks to predict DON.
Introduction
Thyroid-associated ophthalmopathy (TAO) is a very common immunological orbital disease that mainly affects adults, and 4%–8% of patients may deteriorate and develop DON [1–3]. DON is the most serious complication of Graves’ eye disease, which can cause irreversible and severe visual loss in patients. Its prediction and treatment methods are extremely complex, requiring multidisciplinary and multi-index comprehensive prediction and treatment, and evidence of the optimal clinical diagnosis has not yet been proposed [4]. Some clinical manifestations, including blurred vision, color vision defects, optic disc swelling, relative afferent pupil defect (RAPD), and imaging manifestations, such as apical optic nerve compression, can be used to predict DON from thyroid dysfunction [2]. However, there is still controversy about the gold standard of DON prediction, so there is an urgent need for more objective and sensitive indicators to confirm DON. In recent years, experts have been trying to find an efficient way to clinically diagnose DON. Currently, most clinicians diagnose DON by combining clinical data with radiological results. Patients with DON have abnormal tissue enlargement, which often leads to congestion of the orbital apex. Patients may not have significant external characteristics of orbital inflammation [5]. Color vision, pupil examination, contrast sensitivity, and automatic visual field examination are helpful in diagnosing and managing the optic nerve function of DON, which may result in some characteristic changes in DON patients [6].
CT is an important method for the diagnosis of DON. Most DON patients show moderate to severe muscle thickening in CT imaging [7]. The muscles index is calculated by observing a posterior orbital coronal image between the orbital apex and the posterior eyeball. A horizontal line is drawn across the optic nerve and medial and lateral rectus muscles, and a vertical line is down across the optic nerve and upper and lower rectus muscles. The horizontal muscle index is calculated from the ratio of the medial and lateral rectus muscles to the orbital width, and the vertical muscle index is calculated from the ratio of upper and lower rectus muscles to the orbital height. Sixty-six percent of DON patients have a muscle index greater than 70%, and DON patients almost never have a muscle index less than 50%. However, patients with a muscle index greater than 50% cannot be directly identified as presenting DON, and a comprehensive judgment of multiple indicators needs to be further combined. There are certain limitations in relying solely on the clinical diagnosis of DON [8, 9].
With the rapid development of deep learning technology, computer vision tasks, such as image classification, image segmentation and target detection, have been widely applied in the field of medical imaging to assist experts in disease diagnosis, and achieved good results have been achieved [10]. In this study, a new deep learning framework is developed to predict suspected DON. The traditional convolutional neural network ignores the correlation between the channel dimension and spatial dimension and cannot make full use of image feature information. Some workers have proposed that attention modules can solve this problem well. Based on this, this study proposes a hybrid model combining a new attention module and deep convolutional network to predict suspected DON. The hybrid model in this study is unique. The experimental results show that the method in this study achieves a good prediction effect and is recognized by experts in related fields. The contributions of this study to the field of TAO are summarized as follows:
It proposes a deep learning hybrid model for predicting suspected DON.
It proposes a new attention module that can improve the detail feature extraction ability of deep convolutional neural networks.
It shows the importance of deep feature extraction for disease diagnosis.
It will provide a priori knowledge for the application of deep learning in the study of thyroid-related eye diseases in the future.
It demonstrates the effect of combining attentional the mechanism with deep convolutional networks to predict DON.
Related work
A deep convolutional neural network was proposed for the natural image classification task, and a large number of experimental results show that these network models are still applicable to the classification of medical images [11, 12]. The combination of deep convolutional neural networks and medical image classification has a significant impact on the diagnosis of complex clinical diseases [13, 14]. Ozturk et al. [15] developed a system for identifying COVID-19 patients based on DarkNet-17 and chest X-ray images that contains 17 convolutional layers. The main purpose of the study was to assist radiologists in making judgments to examine their screening procedures. Heat maps generated by the system were evaluated by specialist physicians, and the average accuracies of binary classification and multiple classification were 98.08% and 87.02%, respectively. Lin et al. [16] improved VGG-16 by adding four convolution layers to detect the active and inactive phases of TAO. In this study, MRI imaging of TAO patients was used to collect a total of 160 patient samples, among which 80% were used for training and 20% were used for testing. The feasibility of this method is noted. In addition, the visualization method is also used to explain the operation of the network. Alom et al. [17] proposed a residual recurrent neural network (RNN) based on an inception structure that uses convolutional kernels of different sizes in the inception structure to obtain feature maps of different receptive fields to fuse multiscale features. The authors note that this method can detect COVID-19 patients by chest X-ray and CT images, and the detection accuracies are approximately 84.67% and 98.78%, respectively. Wang et al. [18] proposed an automatic segmentation algorithm and used the deep convolutional network GoogleNet to recognize metastatic breast cancer. The original image was divided into small patches, and the patches were used for classification training. Then, the probabilistic heat map of the tumor was synthesized from the prediction results of the patch level, so as to realize tumor localization and tumor classification and improve the ability of case diagnosis accuracy. Gong et al. [19] proposed DGFNet for multi-instance and multilabel classification of X-ray breast images by improving the convolutional part and introducing the interpretability of the Gabor variable convolutional extended deep network. The multi-instance and multilabel classification problem of X-ray lung images is solved on the CHEST-Ray14 dataset. Wei et al. [20] proposed an annotator protocol learning method to classify colon polyps. The ResNet model was used to learn simple samples first and then difficult samples, which could effectively improve model robustness and accelerate model convergence.
The above methods only applied the developed deep convolutional network to the medical field for disease detection, ignoring the utilization of channel dimension and spatial dimension information. Some researchers have applied attention modules to study clinical diseases, so artificial intelligence technology can be used to solve other problems in the medical field. Zhang et al. [21] have combined spatiotemporal attention and RNNs to detect ECG arrhythmias. The author notes that the introduction of an attention mechanism greatly enhances the classification effect. Liu et al. [22] applied a novel attentional mechanism and extended the U-Net architecture to automatically segment and classify patients with ischemic stroke. The authors suggest that the combination of attentional mechanism and deep convolutional networks provides technical support for clinical radiologists to diagnose ischemic stroke and white matter hyperintensity (WMH). Zhang et al. [23] introduced the CBAM attention module and ResNet convolutional neural network for automatical KL grade detection by radiographic methods when studying the automatic diagnosis method of knee osteoarthritis. The multiclassification accuracy of this model is 74.81%. The author points out that this method is significantly improved compared with the published results. Hu et al. [24] proposed a parallel deep learning image segmentation algorithm based on the mixture of channel attention and spatial attention for the complexity and adaptability of lung tumor image segmentation. Four feasible schemes were proposed and verified by experiments. The authors show that the parallel deep learning algorithm based on a mixed attention mechanism performs well in the segmentation of lung tumor images, and the segmentation accuracy reaches 94.61%. He et al. [25] developed a new type of categorical attention mechanism and a global attention mechanism for intraclass variation, small lesions and unbalanced data distribution in the study of diabetic retinopathy classification tasks, and it could accurately identify small lesions and solve the unbalanced sample distribution problem. The authors emphasize that the attention module has a significant performance improvement over the existing deep architecture, so it achieves the most advanced level of DR grading at present.
When reading the above publications, this study found that a single network model could not completely extract deep features in medical images, and the combination of the attention mechanism and deep convolutional network had better effects in solving medical clinical problems. At present, clinical diagnosis of DON is faced with multiple complexities, with many patients suffering from unilateral eye disease. Simple network models cannot accurately screen DON patients. In addition, existing attention mechanisms cannot fully extract the detailed features of eye CT images, which further increases the difficulty of diagnosing DON. In response to the above problems, this study explored this field, performed special preprocessing on the eye dataset, and proposed a hybrid framework combining a novel attention mechanism with a deep neural network model to predict clinically suspicious DON patients, which can be fully extracted in the deep features of the images. The new attention mechanism combines channel attention and spatial attention. It pays attention to local context extraction while obtaining global context, and minimizes information loss by avoiding dimension reduction. In Section 3, the collection and pretreatment of datasets are introduced in detail. In Section 4, the method is described in detail. In Section 5, the experimental results are presented.
Dataset
Data collection
In this study, CT imaging was the experimental research target, according to strict standards for data acquisition. Considering the variability of CT pixels, the window size and width were set to 40 and 100, respectively. During data collection, a coronal CT cross section 15 mm from the left and right zygomatic bones was selected as a component of the dataset. To obtain a relative amount of data, another cross section was selected at depths of 10 mm and 18 mm as the extended dataset. Data were collected from a total of 178 hospitalized patients, including 42 DON patients, 49 TAO patients without DON, and 87 healthy subjects as data controls.
Data preprocessing
To meet the input requirements of the network model, the image size was uniformly set to 224×224×3 in this study as the input of the classification network model. According to a large number of clinical results, most patients have unilateral DON, so the input of the whole CT image into the model leads to uncontrollable interference. On this basis, ITK-SNAP 3.6.0 [26] software was used in this study to separately process the left eye and right eye of each CT image separately, and the output size was set as the size required by this study. Finally, the datasets were classified according to the labels provided by the experts.
Data augmentation
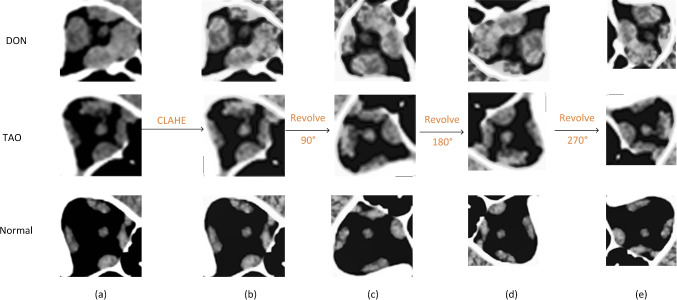
Given the scarcity of DON sample data, unbalanced samples would interfere with the experimental results, and several effective data enhancement methods were adopted in this study. First, contrast limited adaptive histogram equalization (CLAHE) [27] was used to enhance the data. CLAHE is an adaptive histogram equalization algorithm that can limit contrast and reduce the effect of noise amplification. Linear interpolation is used to optimize the transition between blocks to make the image look smoother. Since the orbital crowding index (the ratio of the superior rectus muscle, inferior rectus muscle, superior oblique muscle and inferior oblique muscle to the orbital area) is an important factor for confirming the condition, translation and clipping will destroy the important information of the original data, so this study only adopted a rotation operation to retain the integrity of the original data to the greatest extent. The original image was rotated counterclockwise at 90∘, 180∘and 270∘ counterclockwise on the two-dimensional horizontal axis for data enhancement, as shown in Fig. 1. Finally, the enhanced data were mixed with the original unprocessed data as the dataset for the training model. According to statistics, a total of 380 original eye CT images were collected, including 125 DON images, 130 TAO images without DON, and 125 normal images. After data augmentation, the dataset contains a total of 1515 CT images, which are divided into a training set, verification set and test set according to a 6:2:2 ratio. This effectively avoids the overfitting phenomenon caused by the scarcity of datasets. Among them, DON represents dysthyroid optic neuropathy, TAO represents thyroid-associated ophthalmopathy, and “normal” represents healthy control groups.
Fig. 1.
Column (a) is the original image in the three categories of DON, TAO and Normal from top to bottom, column (b) is the image enhanced by CLAHE method, column (c), column (d) and column (e) are the image rotated by 90∘, 180∘ and 270∘ counterclockwise respectively
Methodology
This section mainly introduces the specific details of our proposed hybrid model, including the multiscale fusion algorithm, the channel attention mechanism and the spatial attention mechanism. The multiscale fusion algorithm obtains receptive fields of different depths so that the network can extract more complete features. The fusion of feature information, channel attention and spatial attention is different from the existing fusion methods. This research pays more attention to the combination of local context and global context. It can fully extract the deep features in the image. Specific details are explained in Section A.
Double multiscale and multi attention fusion module
The double multiscale and multi attention fusion module (DMs-MAFM) is an attention module proposed in this study that can focus on small objects and extract features. Its structure is shown in Fig. 2. It consists of a multiscale feature fusion module, multiscale channel attention aggregation module and spatial attention modules that are fused, corresponding to Stage 1, Stage 2 and Stage 3 in Fig. 2, respectively. This study is elaborated in Sections 4.1.1, 4.1.2 and 4.1.3 below.
Fig. 2.
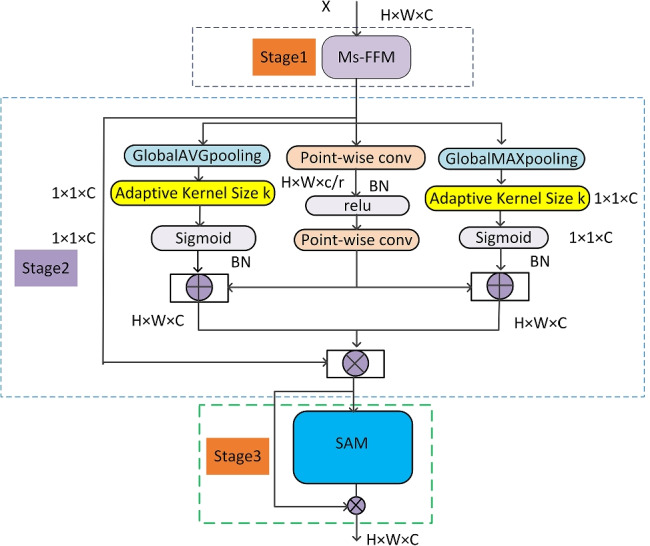
The structural of Double Multiscale and Multi Attention Fusion Module
Multiscale feature fusion module
The bottom layer (near the input) of the neural network has a small receptive field and can only extract low-dimensional information in the image. The upper layer (near the output) has a large receptive field and can obtain a large amount of high-dimensional information [28]. The multiscale feature fusion module (Ms-FFM) can fuse feature maps of different receptive fields, as shown in Fig. 3. Convolutional kernels of different sizes and pooling kernels in parallel directions were adopted to control the receptive field to obtain features of different depths. Then these features were fused, and the original feature map was weighted as the input of the next module.
Fig. 3.
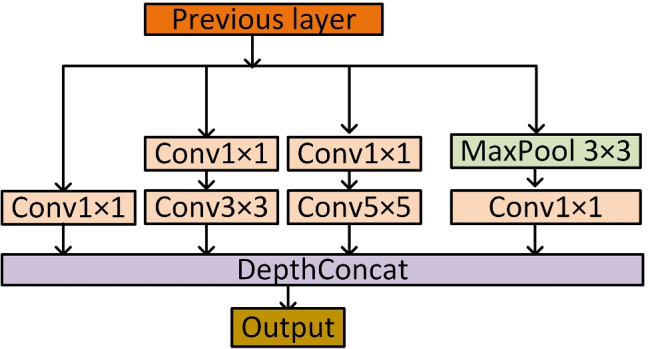
Multiscale Feature Fusion Module
Multiscale channel attention aggregation module
The multiscale channel attention aggregation module (Ms-CAAM) extracts feature maps of different scales by controlling the size of space pooling, aggregating local context with global average context and global maximum context. The global context contains more features of large objects, while the local context contains more features of small objects, and its structure corresponds to Stage 2 as shown in Fig. 2. To avoid extra computation, this study uses pointwise Conv to extract local context information and only uses the point-level channel interaction of each spatial position without changing the resolution size, making the network more sensitive to small objects in the feature graph. The local context calculation process can be expressed as follows:
| 1 |
Here is the intermediate feature mapping of channel number C, shape is H × W,δ represents the Rectified Linear Unit (ReLU), B represents batch normalization (BN), PWConv1 has the size of and PWConv2 has the size of .
In particular, in the process of extracting global context, unlike classical channel attention SENet [29], the Squeeze operation can reduce the model complexity, but it roughly compresses the feature graph with shape of as into a point feature, which destroys the direct mapping between each channel and its corresponding weights [30]. In this study, no dimensionality reduction operation is performed, and local cross-channel interaction is achieved by using a banded matrix. The weight for each channel is only related to its adjacent k channels (i.e., the size of the convolution kernel), which is adaptively determined k is related to the number of channels C input to the current module, which can be expressed as follows:
| 2 |
Here γ and b is a constant, k represents the coverage scope of local cross-channel interaction, that is, k neighboring channels participate in attentional prediction of the current channel. In this study, γ and b are 2 and 1 respectively, and k is 3.
For global maximum context and global average context , they are calculated as follows:
| 3 |
| 4 |
Here gmax(x) represents the global maximum pooling operation for each channel, gavg(x) represents the global average pooling operation for each channel, and AKSConv represents the convolution operation whose adaptive convolution kernel is k. The feature mapping obtained by Ms-CAAM can be expressed as:
| 5 |
Here δ represents the activation function, ⊕ denotes the broadcasting addition and ⊗ denotes the element-wise multiplication.
Spatial attention module
The spatial attention module (SAM) is mainly used to extract spatial feature information, and it is a supplement to channel attention. It aims to capture the correlation between features of different spatial locations, aggregate important feature information from spatial dimensions, and improve the feature expression of key spatial regions. Essentially, the spatial information in the original image is transformed into the mapping space through spatial transformation, and the key information is retained. Weighted masks are generated for each position and weighted output to enhance the specific target area of interest while weakening the irrelevant background area [31]. The structure is shown in Fig. 4. Spatial attention compresses input feature maps into two two-dimensional feature maps (1 × W × H) and splices them in the channel direction. This process can be expressed by the following formula:
| 6 |
Fig. 4.
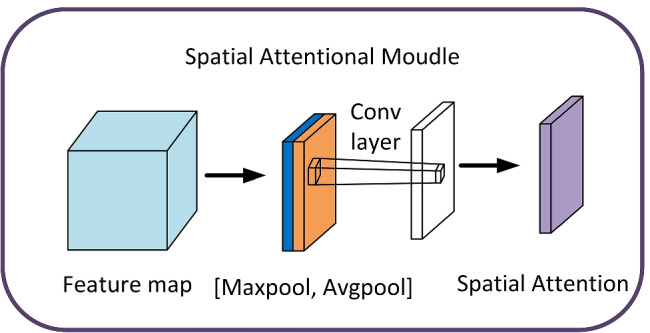
Spatial Attention Module
Here Avg(X) represents global average pooling along the channel direction, Max(X) represents global maximum pooling along the channel direction, f7×7 represents convolution operation with kernel size of 7.
Our proposed feature extraction module combines a multiscale fusion algorithm with an attention mechanism. First, convolutional kernels of different sizes control the changes of receptive fields to obtain feature information of different depths, which is necessary for capturing the deep features of medical images. Second, our attention to the traditional channel is improved, the global largest characteristic information, and the global average characteristic information fusion with local context can both effectively extract the key parts in the image information and strengthen the characteristics of easy-to-overlook edges of the information. In addition, the channel attention during the process of feature extraction avoids the dimension reduction operation improvement. This fully guarantees the direct mapping relationship between each channel and its corresponding weight. Finally, a single channel does not have enough attention to the characteristics of the mined image. We add a space after the channel attention mechanism, so our model can extract characteristic information from the channel dimension and space dimension. In addition, in our proposed model with multistage characteristics between the modules designed in the residual structure, the gradient disappearance problem is effectively avoided.
EfficientNet
EfficientNet is a series of convolutional neural network families proposed by Tan et al. [32] that was inspired by the existing CNNs, and meanwhile extended the combination of network depth, width and image resolution to explore the influence of different combinations on experimental results. A total of 8 versions from B0 to B7 are proposed. EfficientNet has very strict requirements for the resolution of the input image; the resolution of the different versions of the model corresponds to a particular resolution, network depth and width. The main structure is a stack of MBConv [33] blocks. The core idea is the channel attention mechanism. The optimal operation is optimized through the Squeeze operation and congestion control, and the depth separable convolution is added to ensure the high efficiency and accuracy of the network. The EfficientNet performance on the ImageNet dataset was excellent. In this study, the EfficientNet B0 version was used, and Fig. 5 shows the structure diagram of the EfficientNet B0 version.
Fig. 5.
The structural of EfficientNet B0
t-distributed stochastic neighbor embedding technology
t-Distributed stochastic neighbor embedding (t-SNE) [34] is a nonlinear dimensional-reduction machine learning algorithm. t-SNE constructs a probability distribution among high-dimensional objects, so that similar objects have a higher probability of being selected, while dissimilar objects have a lower probability of being selected. In low-dimensional space, the probability distribution of these points is constructed to make the two probability distributions as similar as possible, so as to convert the Euclidean distance into a conditional probability to express the similarity between points, which can compress the high-dimensional data into low-dimensional data, remove the redundant information, and greatly improve the operation performance.
Proposed method
The hybrid model proposed in this study is divided into three stages. In the first stage, the collected data are strictly preprocessed, and the image is enhanced by the CLAHE method and rotated in three directions. The preprocessed image size is 224× 224 ×3. In the second stage, the preprocessed data are sent into DMs-MAFM, and the feature information of different receptive fields is obtained through Ms-FFM first. The purpose is to integrate high-dimensional features with low-dimensional features, and then it is passed into MS-CAAM to add local context to the global context with local cross-channel interaction. In addition to obtaining global information, local key information can be captured. After that, the features weighted by the channels are passed into the spatial attention module to extract spatial feature information to improve the feature expression of spatial key regions. To facilitate the subsequent stages, by adjusting the parameters, the weighted features maintain the same shape as the original data (224 × 224 ×3). In the third stage, the output end of the DMs-MAFM is connected with the input end of EfficientNet, and the features, including spatial correlations and channel correlations extracted by DMs-MAFM, are transferred to the EfficientNet. According to the image resolution and hardware constraints, this study used EfficientNet version B0. Further feature extraction is performed through the convolutional layer, BatchNormal layer, activation layer, and dropout layer in the EfficientNet b0 model, in which the dropout layer is used to randomly and proportionally inactivate neurons to avoid overfitting. In the final stage, before the whole connection layer classification use t-SNE techniques for feature selection, t-SNE, as a nonlinear dimension reduction algorithm, can retain the most important characteristics of high-dimensional mapping information, remove a large amount of redundant information, reduce the computational complexity and effectively improve the classification ability of the model. Then, classification is carried out according to DON, TAO and Normal through the full connection layer, and the output categories are compared with the golden label provided by experts to judge whether the model achieves correct classification. Finally, the output is in the form of the probability to judge the classification effect of the hybrid model. The model training parameters were set as follows: the number of epochs was 400. With SGD optimization, the initial learning rate was 0.01, the batch size was 32, the dropout rate was 0.3, the loss function was the cross entropy loss function, and the Adam optimizer was used for parameter optimization. This process is shown in Fig. 6.
Fig. 6.
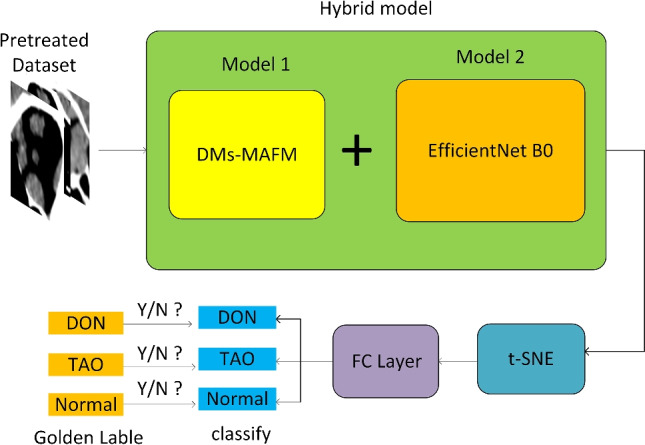
The structure of hybrid model
Experiments and results
This experiment was carried out in Python environment based on Pytorch development framework. The server GPU was GTX Titan X, 12G video memory, and I7 processor. In the field of deep learning, confusion matrix is an important indicator used to measure the effect of classification tasks. It consists of True Positives (TP), False Positives (FP), True Negatives (TN), False Negatives (FN) are composed of these values, through which the precision (Precision, Pre), sensitivity (Sensitivity, Sen), specificity (Specificity, Spe), F1-score, Accuracy (Acc) can be calculated, and their calculation formulas are as follows:
| 7 |
| 8 |
| 9 |
| 10 |
| 11 |
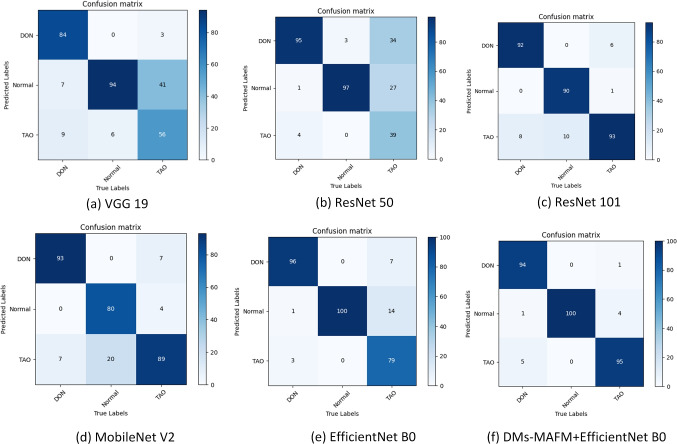
To reflect the advanced nature of the hybrid model proposed in this study, this study conducted comparative experiments with several popular and representative networks. The experimental results are shown in Table 1. The enhanced datasets were trained on VGG19, ResNet50, ResNet101, MobileNetV2, EfficientNet B0 and DMs-MAFM+EfficientNet B0, and the index values were obtained. As seen from the results of the experiment, the accuracy of the hybrid model proposed in this study is 96%, which is the highest among the accuracies of several models. The confusion matrices obtained by each model are shown in Fig. 7. In particular, in the DON category, the model accuracy and specificity of this study were 98.9%, 99.5% and 96.4%, which were the best among those of all models. In the TAO category, both the sensitivity and F1-score are 95%, and in the Normal category, the Sensitivity and F1-score are 1.0 and 97.5%, respectively, the highest values among those of all models. Based on the above data, the hybrid model proposed in this study achieved the highest classification accuracy, which indicated that the method proposed in this study had better effects in detecting DON samples.
Table 1.
Result of trained models
| Model | Classification | Precision | Sensitivity (Recall) | Specificity | F1-score | Accuracy |
|---|---|---|---|---|---|---|
| VGG19 [35] | DON | 0.966 | 0.840 | 0.985 | 0.899 | 0.78 |
| TAO | 0.789 | 0.560 | 0.925 | 0.655 | ||
| Normal | 0.662 | 0.940 | 0.760 | 0.777 | ||
| Resnet50 [36] | DON | 0.720 | 0.950 | 0.815 | 0.819 | 0.77 |
| TAO | 0.907 | 0.390 | 0.980 | 0.545 | ||
| Normal | 0.776 | 0.970 | 0.860 | 0.862 | ||
| Resnet101 [36] | DON | 0.939 | 0.920 | 0.970 | 0.929 | 0.91 |
| TAO | 0.838 | 0.930 | 0.910 | 0.882 | ||
| Normal | 0.989 | 0.900 | 0.995 | 0.942 | ||
| mobilenetV2 [34] | DON | 0.930 | 0.931 | 0.965 | 0.930 | 0.87 |
| TAO | 0.767 | 0.890 | 0.865 | 0.824 | ||
| Normal | 0.952 | 0.800 | 0.980 | 0.869 | ||
| EfficientNet | DON | 0.932 | 0.960 | 0.965 | 0.946 | 0.92 |
| TAO | 0.963 | 0.790 | 0.985 | 0.868 | ||
| Normal | 0.870 | 1.0 | 0.925 | 0.930 | ||
| DMs-MAFM+EfficientNet | DON | 0.989 | 0.940 | 0.995 | 0.964 | 0.96 |
| B0 (ours) | TAO | 0.950 | 0.950 | 0.975 | 0.950 | |
| Normal | 0.952 | 1.0 | 0.975 | 0.975 |
Bold entries is the best performing data in each category under the same test conditions
Fig. 7.
Confusion Matrix of trained models
Ablation test
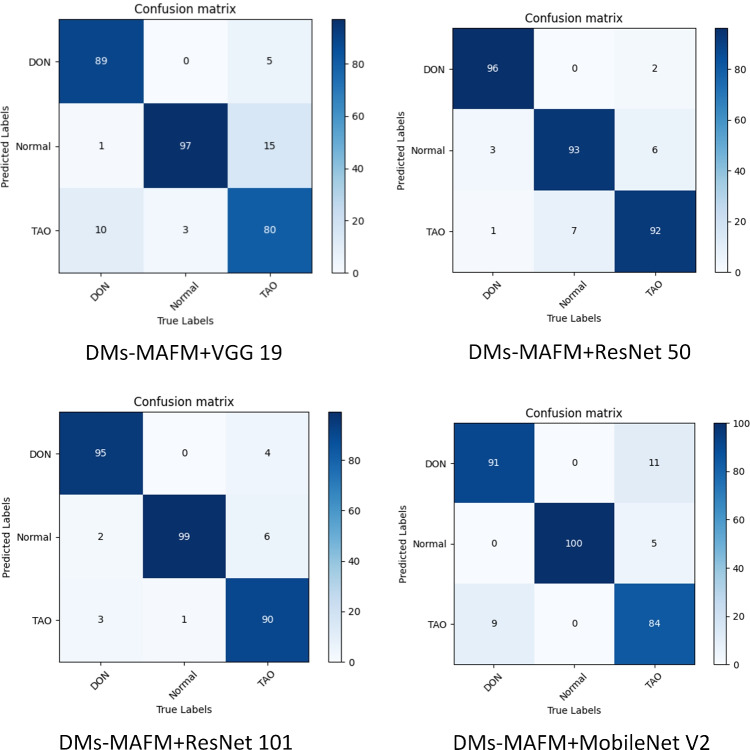
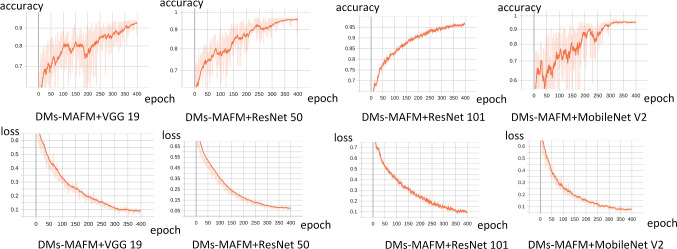
To further verify the efficient feature extraction capability of the DMs-MAFM proposed in this study, this study also combined the attention module with other network models, and the experimental indicators obtained are shown in Table 2. The DMs-MAFM and VGG19, Resnet50, Resnet101, and MobileNet V2 were combined, and the accuracy rates reached 89%, 93%, 94% and 91%, respectively. From the data in Table 2, the effect of the mixed model is better than that of the individual model, especially for the VGG19 and ResNet50 light networks, which shows that the DMs-MAFM proposed in this study has a good feature extraction ability. The confusion matrix results for each mixture model are shown in Fig. 8. Figure 9 shows the training process curve and loss convergence process of the scheme proposed in this study, and Fig. 10 shows the training process and loss convergence process of each model. In addition, to highlight the advanced nature of the multistage feature extraction module proposed in this study, we compared the experimental performances of some existing attention mechanisms with the performance of our module. Using VGG19 ResNet50, ResNet101 MobileNetV2, and EfficientNetb0 as the backbone, for a variety of attention mechanisms, all the results were obtained with the same settings used for training and model parameters. and the final result is shown in Table 3. According to the data in the table, using the same model parameters and complexity, the multistage feature extraction module proposed in this study has achieved the best effect.
Table 2.
Result of trained hybrid models
| Model | Classification | Precision | Sensitivity (Recall) | Specificity | F1-score | Accuracy |
|---|---|---|---|---|---|---|
| DMs-MAFM+VGG19 | DON | 0.950 | 0.975 | 0.976 | 0.946 | 0.89 |
| TAO | 0.960 | 0.912 | 0.976 | 0.931 | ||
| Normal | 0.931 | 0.986 | 0.971 | 0.936 | ||
| DMs-MAFM+Resnet50 | DON | 0.960 | 0.950 | 0.980 | 0.955 | 0.93 |
| TAO | 0.957 | 0.900 | 0.980 | 0.928 | ||
| Normal | 0.925 | 0.990 | 0.960 | 0.956 | ||
| DMs-MAFM+Resnet101 | DON | 0.980 | 0.960 | 0.990 | 0.970 | 0.94 |
| TAO | 0.920 | 0.920 | 0.960 | 0.920 | ||
| Normal | 0.912 | 0.930 | 0.955 | 0.921 | ||
| DMs-MAFM+MobilenetV2 | DON | 0.892 | 0.910 | 0.945 | 0.901 | 0.91 |
| TAO | 0.903 | 0.840 | 0.955 | 0.870 | ||
| Normal | 0.952 | 1.0 | 0.975 | 0.975 | ||
| DMs-MAFM+EfficientNet | DON | 0.989 | 0.940 | 0.995 | 0.964 | 0.96 |
| B0 (ours) | TAO | 0.950 | 0.950 | 0.975 | 0.950 | |
| Normal | 0.952 | 1.0 | 0.975 | 0.975 |
Bold entries is the best performing data in each category under the same test conditions
Fig. 8.
Confusion Matrix of trained models
Fig. 9.
This study proposes the training process of the program. Among them, the left figure shows the change of validation set accuracy with the Epoch, and the right figure shows the change of loss convergence with the Epoch
Fig. 10.
Each model training process. The first line is the process of accuracy change of validation set, and the second line is the process of loss convergence
Table 3.
Experimental comparison of different attention methods
| Methods | Backbone | Parameters | Flops | acc |
|---|---|---|---|---|
| VGG19 | VGG 19 [35] | 143.67M | 19.66G | 0.78 |
| SENet [29] | 143.67M | 19.75G | 0.84 | |
| BAM [37] | 143.67M | 19.76G | 0.82 | |
| ECANet [30] | 143.67M | 19.66G | 0.86 | |
| FCANet [38] | 143.67M | 19.75G | 0.89 | |
| DMs-MAFM (ours) | 143.76M | 19.73G | 0.89 | |
| ResNet 50 | ResNet 50 [36] | 25.56M | 4.12G | 0.77 |
| SENet [29] | 25.56M | 4.12G | 0.87 | |
| CBAM [31] | 25.57M | 4.13G | 0.85 | |
| CCNet [39] | 25.56M | 4.12G | 0.84 | |
| ECANet [30] | 25.56M | 4.12G | 0.85 | |
| FCANet [38] | 25.56M | 4.12G | 0.87 | |
| DMs-MAFM (ours) | 25.58M | 4.13G | 0.93 | |
| ResNet 101 | ResNet 101 [36] | 44.55M | 7.85G | 0.91 |
| SENet [29] | 44.55M | 7.85G | 0.92 | |
| CBAM [31] | 44.57M | 7.89G | 0.92 | |
| CCNet [39] | 44.55M | 7.86G | 0.94 | |
| GoogleNet [40] | 44.62M | 7.92G | 0.913 | |
| GCNet [41] | 44.57M | 7.85G | 0.92 | |
| CANet [42] | 44.56M | 7.85G | 0.93 | |
| DMs-MAFM (ours) | 44.57M | 7.86G | 0.94 | |
| MobileNet V2 | MobileNet V2 [33] | 3.4M | 300.05M | 0.87 |
| SENet [29] | 3.4M | 300.05M | 0.88 | |
| CCNet [39] | 3.4M | 300.58M | 0.90 | |
| ECANet [30] | 3.4M | 300.05M | 0.88 | |
| GoogleNet [40] | 3.5M | 320.43M | 0.89 | |
| FCANet [38] | 3.4M | 300.05M | 0.897 | |
| Inception v4 [43] | 3.6M | 325.23M | 0.91 | |
| DMs-MAFM (ours) | 3.4M | 300.07M | 0.91 | |
| EfficientNet B0 | EfficientNet B0 [32] | 5.3M | 398.09M | 0.92 |
| SENet [29] | 5.3M | 398.09M | 0.923 | |
| CBAM [31] | 5.3M | 398.10M | 0.93 | |
| CCNet [39] | 5.3M | 410.25M | 0.946 | |
| ECANet [30] | 5.3M | 398.09M | 0.953 | |
| GCNet [41] | 5.3M | 398.09M | 0.943 | |
| CANet [42] | 5.3M | 398.12M | 0.95 | |
| DMs-MAFM (ours) | 5.3M | 398.13M | 0.96 |
Bold entries is the best performing data in each category under the same test conditions
We also split the multilevel feature extraction module proposed in this study, and verified the performance improvement effect of each submodule on the neural network. Using the EfficientNet B0 network as the backbone, the performance of the submodules was tested. The experimental results are as follows shown in Table 4.
Table 4.
Performance test of each submodule of the multilevel feature extraction module
| Module | Backbone | Classification | Pre | Se | Spe | F1-score | Acc | Flops | Parameters |
|---|---|---|---|---|---|---|---|---|---|
| Ms-FFM | EfficientNet B0 [32] | DON | 0.938 | 0.910 | 0.970 | 0.924 | 0.92 | 398.12M | 5.3M |
| TAO | 0.902 | 0.830 | 0.955 | 0.865 | |||||
| Normal | 0.901 | 1.000 | 0.945 | 0.948 | |||||
| Ms-CAAM | DON | 0.912 | 0.930 | 0.955 | 0.921 | 0.94 | 398.11M | 5.3M | |
| TAO | 0.918 | 0.900 | 0.960 | 0.990 | |||||
| Normal | 0.990 | 0.990 | 0.995 | 0.909 | |||||
| SAM | DON | 0.918 | 0.900 | 0.960 | 0.909 | 0.93 | 398.09M | 5.3M | |
| TAO | 0.891 | 0.900 | 0.945 | 0.895 | |||||
| Normal | 0.980 | 0.990 | 0.990 | 0.985 | |||||
| DMs-MAFM (ours) | DON | 0.989 | 0.940 | 0.995 | 0.964 | 0.96 | 398.13M | 5.3M | |
| TAO | 0.950 | 0.950 | 0.975 | 0.950 | |||||
| Normal | 0.952 | 1.000 | 0.975 | 0.975 |
Bold entries is the best performing data in each category under the same test conditions
In addition, the study also explored the influence of The Stage 2 and Stage 3 location relationships in The DMs-MAFM on the final test results. With EfficientNet B0 as the backbone, the study realized four controlled trials, as shown in Table 5. The first set of Stage 2 means only Ms-CAAM+ EfficientNet B0, and the second set of Stage 3 means only SAM +EfficientNet B0. The third set of Stage 2+ Stage3 represents the position order of Ms-CAAM+SAM+EfficientNet B0, and the fourth set of Stage 2+Stage 3 represents the position order of SAM+MS-CAAM+EfficientNet B0. According to the experimental results, the third combination has a better improvement effect on the experimental results, so the DMs-MAFM proposed in this study adopts the combination of Stage 2+Stage 3.
Table 5.
The position of Stage2 and Stage3 affects the experiment
| Model | Classification | Precision | Sensitivity (Recall) | Specificity | F1-score | Accuracy |
|---|---|---|---|---|---|---|
| Stage2 | DON | 0.912 | 0.930 | 0.955 | 0.921 | 0.94 |
| TAO | 0.918 | 0.900 | 0.960 | 0.990 | ||
| Normal | 0.990 | 0.990 | 0.995 | 0.909 | ||
| Stage3 | DON | 0.918 | 0.900 | 0.960 | 0.909 | 0.93 |
| TAO | 0.891 | 0.900 | 0.945 | 0.895 | ||
| Normal | 0.980 | 0.990 | 0.990 | 0.985 | ||
| Stage2 + Stage3 | DON | 0.989 | 0.940 | 0.995 | 0.964 | 0.96 |
| TAO | 0.950 | 0.950 | 0.975 | 0.950 | ||
| Normal | 0.952 | 1.0 | 0.975 | 0.975 | ||
| Stage3 + Stage2 | DON | 0.921 | 0.930 | 0.960 | 0.925 | 0.93 |
| TAO | 0.926 | 0.870 | 0.965 | 0.897 | ||
| Normal | 0.952 | 1.0 | 0.975 | 0.897 |
Bold entries is the best performing data in each category under the same test conditions
Discussion
The purpose of this study is to provide a convenient and efficient diagnostic method for the current clinical diagnosis of DON. We tried to use the existing deep neural network to achieve the DON classification task but did not achieve satisfactory results. On this basis, a new way of combining an attention mechanism with a deep convolutional network was developed, which achieved good results in the current research field of thyroid-related eye diseases. The proposed multistage feature extraction module combines the advantages of existing attention mechanisms and combines the multiscale feature fusion module with channel attention and spatial attention to form an efficient feature extraction module. The experimental results show the advantages of our proposed scheme. This method can hopefully provide a new direction for the clinical diagnosis of suspected DON. Since the literature does not use attention mechanisms and neural networks to identify cases of DON, this is also the motivation of this study. The experimental results show that the new attention module in this study can better extract the details of CT images, which is very important for disease diagnosis.
Conclusion
This study proposes a deep learning hybrid model to predict suspected DON patients using CT images. The dataset was collected from the Union Hospital affiliated with Tongji Medical College, Huazhong University of Science and Technology, and was collected by professional doctors according to strict standards. After pretreatment, the dataset was input into the mixed model. The first part of the hybrid model is the DMs-MAFM designed for this study, which includes a multiscale feature fusion algorithm, channel attention algorithm, and spatial attention algorithm. The DMs-MAFM module performs deep feature extraction and then passes the features into EfficientNet B0, uses t-SNE for feature selection, and finally performs classification through the fully connected layer. According to the experimental results, the hybrid model proposed in this study achieved good classification results, and the effectiveness of the feature extraction module proposed in this study on other deep convolutional neural networks was verified. Although our mixed model has a good effect on identifying DON but is limited to the actual situation, the number of datasets in this study may have a certain impact on the experimental results. We hope that the method presented in this study will provide support to clinical experts to diagnose DON. In future work, this study will continue to expand the dataset to refine the experimental results and develop more effective methods in different datasets and models.
Acknowledgements
Thanks to Union Hospital Tongji Medical College Huazhong University of Science and Technology for providing data and medical background support for this study.
Biographies
Cong Wu
is a professor at the School of Computer Science at Hubei University of Technology whose research focuses on ai-based diagnosis of eye diseases.
Shijun Li
is a master student at the School of Computer Science, Hubei University of Technology, whose research interest is deep learning based prediction of Thyroid Associated Ophthalmopathy.
Xiao Liu
is a master student at the School of Computer Science, Hubei University of Technology, whose main research interests are retinal vascular segmentation.
Fagang Jiang
is director of ophthalmology at Union Hospital Tongji Medical College Huazhong University of Science and Technology, whose research interests include orbital diseases and Thyroid Associated Ophthalmopathy.
Bingjie Shi
is Ophthalmologist, Union Hospital Tongji Medical College Huazhong University of Science and Technology.
Author contribution
Shijun Li conceived and practiced the study, and Cong Wu put forward relevant guidance, Xiao Liu and Bingjie Shi collected and analyzed the data set, Professor Fagang Jiang provided medical theoretical support for this study by analyzing the actual situation, and all the authors contributed to the writing and approval of this study.
Declarations
Ethics approval
This study met the requirements of The Code of Ethics of the World Medical Association, and the data were used with the consent of the hospital and the patients themselves.
Conflict of interest
The authors declare no competing interests.
Footnotes
Publisher’s note
Springer Nature remains neutral with regard to jurisdictional claims in published maps and institutional affiliations.
References
- 1.Bartley GB. The epidemiologic characteristics and clinical course of ophthalmopathy associated with autoimmune thyroid disease in olmsted county, minnesota. Trans Am Ophthalmol Soc. 1994;92(92):477. [PMC free article] [PubMed] [Google Scholar]
- 2.Neigel JM, Rootman J, Belkin RI, Nugent RA, Spinelli JA. Dysthyroid optic neuropathy. the crowded orbital apex syndrome. Ophthalmology. 1988;95(11):1515–1521. doi: 10.1016/S0161-6420(88)32978-7. [DOI] [PubMed] [Google Scholar]
- 3.McKeag D, Lane C, Lazarus JH, Baldeschi L, Boboridis K, Dickinson AJ, Hullo AL, Kahaly G, Krassas G, Marcocci C et al (2007) Clinical features of dysthyroid optic neuropathy: a european group on graves’ orbitopathy (EUGOGO) survey. Br J Ophthalmol 91(4):455–458 [DOI] [PMC free article] [PubMed]
- 4.Saeed P, Rad ST, Peter HLT. Bisschop: Dysthyroid optic neuropathy. Ophthalmic Plastic Reconstructive Surgery. 2018;34(4S):S60–S67. doi: 10.1097/IOP.0000000000001146. [DOI] [PubMed] [Google Scholar]
- 5.Victores AJ, Takashima M. Thyroid eye disease: optic neuropathy and orbital decompression. Int Ophthalmol Clin. 2016;56(1):69–79. doi: 10.1097/IIO.0000000000000101. [DOI] [PubMed] [Google Scholar]
- 6.Jeon C, Shin JH, Woo KI, Kim Y-D. Clinical profile and visual outcomes after treatment in patients with dysthyroid optic neuropathy. Korean J Ophthalmol. 2012;26(2):73–79. doi: 10.3341/kjo.2012.26.2.73. [DOI] [PMC free article] [PubMed] [Google Scholar]
- 7.Blandford AD, Zhang D, Chundury RV, Perry JD. Dysthyroid optic neuropathy: update on pathogenesis, diagnosis, and management. Expert Review of Ophthalmology. 2017;12(2):111–121. doi: 10.1080/17469899.2017.1276444. [DOI] [PMC free article] [PubMed] [Google Scholar]
- 8.Giaconi JAA, Kazim M, Rho T, Pfaff C. Ct scan evidence of dysthyroid optic neuropathy. Ophthalmic Plastic Reconstructive Surgery. 2002;18(3):177–182. doi: 10.1097/00002341-200205000-00005. [DOI] [PubMed] [Google Scholar]
- 9.da Rocha Lima B, Perry JD. Superior ophthalmic vein enlargement and increased muscle index in dysthyroid optic neuropathy. Ophthalmic Plastic Reconstructive Surgery. 2013;29(3):147–149. doi: 10.1097/IOP.0b013e3182831bd8. [DOI] [PubMed] [Google Scholar]
- 10.Rong G, Mendez A, Assi EB, Bo Z, Sawan M. Artificial intelligence in healthcare: review and prediction case studies. Engineering. 2020;6(3):291–301. doi: 10.1016/j.eng.2019.08.015. [DOI] [Google Scholar]
- 11.Vaid S, Kalantar R, Bhandari M. Deep learning covid-19 detection bias: accuracy through artificial intelligence. Int Orthop. 2020;44(8):1539–1542. doi: 10.1007/s00264-020-04609-7. [DOI] [PMC free article] [PubMed] [Google Scholar]
- 12.Apostolopoulos ID, Mpesiana TA. Covid-19: automatic detection from x-ray images utilizing transfer learning with convolutional neural networks. Physical and Engineering Sciences in Medicine. 2020;43(2):635–640. doi: 10.1007/s13246-020-00865-4. [DOI] [PMC free article] [PubMed] [Google Scholar]
- 13.Bakator M, Radosav D. Deep learning and medical diagnosis: A review of literature. Multimodal Technologies and Interaction. 2018;2(3):47. doi: 10.3390/mti2030047. [DOI] [Google Scholar]
- 14.Ravi D, Wong C, Deligianni F, Berthelot M, Andreu-Perez J, Lo B, Yang GZ. Deep learning for health informatics. IEEE Journal of Biomedical Health Informatics. 2017;21(1):4–21. doi: 10.1109/JBHI.2016.2636665. [DOI] [PubMed] [Google Scholar]
- 15.Ozturk T, Talo M, Yildirim EA, Baloglu UB, Yildirim O, Rajendra Acharya U. Automated detection of covid-19 cases using deep neural networks with x-ray images. Comput Biol Med. 2020;121:103792. doi: 10.1016/j.compbiomed.2020.103792. [DOI] [PMC free article] [PubMed] [Google Scholar]
- 16.Lin C, Song X, Li L, Li Y, Jiang M, Sun R, Zhou H, Fan X. Detection of active and inactive phases of thyroid-associated ophthalmopathy using deep convolutional neural network. BMC Ophthalmol. 2021;21(1):1–9. doi: 10.1186/s12886-020-01783-5. [DOI] [PMC free article] [PubMed] [Google Scholar]
- 17.Alom Z, Rahman MM, Nasrin S, Taha TM, Asari VK (2020) Covid_mtnet: Covid-19 detection with multi-task deep learning approaches. arXiv:2004.03747
- 18.Wang D, Khosla A, Gargeya R, Irshad H, Beck AH (2016) Deep learning for identifying metastatic breast cancer. arXiv:1606.05718
- 19.Xuan G, Xia X, Zhu W, Zhang B, Doermann D, Zhuo L (2021) Deformable gabor feature networks for biomedical image classification. In Proceedings of the IEEE/CVF Winter Conf Appl Comp Vision pp 4004–4012
- 20.Wei J, Suriawinata A, Ren B, Liu X, Lisovsky M, Vaickus L, Brown C, Baker M, Nasir-Moin M, Tomita N, Torresani L (2021) Learn like a pathologist: curriculum learning by annotator agreement for histopathology image classification. In Proc IEEE/CVF Winter Conf Appl Compt Vis pp 2473–2483
- 21.Zhang J, Liu A, Gao M, Chen X, Xu Z, Chen X. Ecg-based multi-class arrhythmia detection using spatio-temporal attention-based convolutional recurrent neural network. Artif Intell Med. 2020;106:101856. doi: 10.1016/j.artmed.2020.101856. [DOI] [PubMed] [Google Scholar]
- 22.Liu L, Kurgan L, Wu F-X, Wang J. Attention convolutional neural network for accurate segmentation and quantification of lesions in ischemic stroke disease. Med Image Anal. 2020;65:101791. doi: 10.1016/j.media.2020.101791. [DOI] [PubMed] [Google Scholar]
- 23.Zhang B, Tan J, Cho K, Chang G, Deniz CM (2020) Attention-based cnn for kl grade classification: data from the osteoarthritis initiative. In2020 IEEE 17th international symposium on biomedical imaging (ISBI). IEEE, pp 731–735
- 24.Hu H, Li Q, Zhao Y, Ye Z. Parallel deep learning algorithms with hybrid attention mechanism for image segmentation of lung tumors. IEEE Trans Indust Inform. 2020;17(4):2880–2889. doi: 10.1109/TII.2020.3022912. [DOI] [Google Scholar]
- 25.He A, Li T, Li N, Wang K, Fu H. Cabnet: category attention block for imbalanced diabetic retinopathy grading. IEEE Trans Med Imaging. 2020;40(1):143–153. doi: 10.1109/TMI.2020.3023463. [DOI] [PubMed] [Google Scholar]
- 26.Yushkevich PA, Gerig G. Itk-snap: an intractive medical image segmentation tool to meet the need for expert-guided segmentation of complex medical images. IEEE pulse. 2017;8(4):54–57. doi: 10.1109/MPUL.2017.2701493. [DOI] [PubMed] [Google Scholar]
- 27.Siddhartha M, Santra A (2020) Covidlite: A depth-wise separable deep neural network with white balance and clahe for detection of covid-19. arXiv:2006.13873
- 28.Yu W, Yang K, Yao H, Sun X, Xu P. Exploiting the complementary strengths of multi-layer cnn features for image retrieval. Neurocomputing. 2017;237:235–241. doi: 10.1016/j.neucom.2016.12.002. [DOI] [Google Scholar]
- 29.Hu J, Shen L, Sun G (2018) Squeeze-and-excitation networks. In Proc IEEE Conf Comput Vis Pattern Recognit pp 7132–7141
- 30.Wang Q, Wu B, Zhu P, Li P, Zuo W, Hu Q (2020) ECA-Net: efficient channel attention for deep convolutional neural networks. In Proc IEEE/CVF Conf Comp Vis Pattern Recognit pp 13–19
- 31.Woo S, Park J, Lee JY, Kweon IS. Cbam: Convolutional block attention module. Cham: Springer; 2018. [Google Scholar]
- 32. Tan M, Le Q (2019) Efficientnet: rethinking model scaling for convolutional neural networks. In Int Conf Machine Learning. PMLR, pp 6105–6114
- 33.Sandler M, Howard A, Zhu M, Zhmoginov A, Chen LC (2018) Mobilenetv2: Inverted residuals and linear bottlenecks. In Proc IEEE Conf Comput Vis Pattern Recognit pp 4510–4520
- 34.Kobak D, Berens P. The art of using t-sne for single-cell transcriptomics. Nat Commun. 2019;10(1):1–14. doi: 10.1038/s41467-019-13056-x. [DOI] [PMC free article] [PubMed] [Google Scholar]
- 35.Simonyan K, Zisserman A (2014) Very deep convolutional networks for large-scale image recognition. arXiv:1409.1556
- 36.He K, Zhang X, Ren S, Sun J (2016) Deep residual learning for image recognition. In Pro IEEE Conf Comput Vis Pattern Recognit pp 770– 778
- 37.Park J, Woo S, Lee J-Y, Kweon IS (2018) Bam: Bottleneck attention module. arXiv:1807.06514
- 38.Qin Z, Zhang P, Wu P, Li X (2021) Fcanet: frequency channel attention networks. In Proc IEEE/CVF Int Conf Comput Vis pp 783–792
- 39.Huang Z, Wang X, Huang L, Huang C, Wei Y, Liu W (2019) Ccnet: criss-cross attention for semantic segmentation. In Proceedings of the IEEE/CVF international conference on computer vision, pp 603–612
- 40.Szegedy C, Liu W, Jia Y, Sermanet P, Reed S, Anguelov D, Erhan D, Vanhoucke V, Rabinovich A (2015) Going deeper with convolutions. In Proc IEEE Conference Computer Vis Pattern Recognit pp 1–9
- 41.Cao Y, Xu Y, Lin S, Wei F, Hu H (2019) Gcnet: Non-local networks meet squeeze-excitation networks and beyond. In Proc IEEE/CVF Int Conf Comput Vis Workshops
- 42.Hou Q, Zhou D, Feng J (2021) Coordinate attention for efficient mobile network design. In Proc IEEE/CVF Conference Computer Vis Pattern Recognit pp 13713–13722
- 43.Szegedy C, Ioffe S, Vanhoucke V, Alemi AA (2017) Inception-v4, inception-resnet and the impact of residual connections on learning. In Thirty-first AAAI Conf Artif Intell


