Abstract

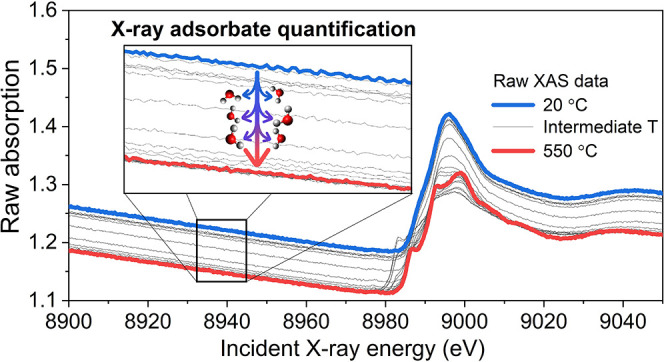
Hard X-ray absorption spectroscopy (XAS) is frequently applied in catalysis and gas sorption studies to monitor changes in oxidation states, coordination numbers, and interatomic distances of active sites under in situ and operando conditions. However, transmission XAS data can reveal also the change in the total amount of guest species adsorbed on the whole sample. Surprisingly, to the best of our knowledge, the latter property has never been exploited. Here, we present a simple method to quantify the amount of adsorbates from XAS data collected during the interaction of the sample with gases or liquids. The method relies on monitoring the change of the total absorption level below the measured absorption edge and does not require any additional instrumentation or modification of the XAS data collection procedure. Essentially, it is a way to obtain the information analogous to the one delivered by temperature-programmed reduction (TPR), temperature-programmed desorption (TPD), or thermogravimetric analysis (TGA) directly from XAS at no extra cost.
Introduction
X-ray absorption spectroscopy (XAS) is a versatile element-selective tool to determine the parameters of local atomic and electronic structure of materials, such as interatomic distances, bond angles, coordination numbers, and oxidation states.1,2 Elemental selectivity is an advantage of the XAS-based methods, which is particularly important in chemical studies where the research interest is focused on particular minority species (active sites) arranged inside the hosting matrices. This is often the case of functionalized MOFs, metal-exchanged zeolites, supported nanoparticles, and doped oxides (the list is certainly not exhaustive). High penetration depth of hard X-rays allows to collect data under in situ and operando conditions, which is particularly useful in catalysis.
XAS measurements are mainly conducted at synchrotron beamlines, so the availability of the method is much lower compared to the laboratory techniques. To get the most from the beamtime, in situ and operando XAS experiments are often accompanied by simultaneous complementary measurements, such as X-ray diffraction, mass spectrometry, infrared spectroscopy, gas chromatography, UV–vis spectroscopy, etc. Such an approach yields complementary datasets collected in identical conditions, providing extra information about the sample and serving as diagnostics to compare the conditions at the beamline with those adopted in the laboratory.
Despite their obvious value for gas sorption and catalytic studies, thermogravimetric analysis (TGA) and techniques for gas adsorption/desorption quantification such as temperature-programmed desorption or reduction (TPD/TPR) are seldom coupled with XAS measurements in the same experiment due to difficulties in constructing the combined setup and different requirements for sample preparation. To address this problem, here, we suggest a simple method to extract TGA/TPD/TPR-like information directly from XAS data, hereafter designated X-ray adsorbate quantification (XAQ).
Methods
While the X-ray absorption near-edge structure (XANES) and the extended X-ray absorption fine structure (EXAFS) comprise features at or above the absorption edge, XAQ focuses on the flat region at approximately 50–150 eV below the absorption edge. Adsorption or desorption of molecules caused by the variation of external conditions (temperature, gas feed, irradiation) change the total absorption coefficient of the sample, causing the vertical shift of the spectrum. The XAQ method essentially relates the amplitude of this shift to the amount of adsorbed or desorbed species.
The experimentally observed change of the total absorption Δμtot in two different measurements has two main contributions
| 1 |
where μsam and μgas are the total absorption of the sample and the gas inside the experimental cell, respectively; I0 and I1 are the counts of the ionization chambers measuring the intensity of the incident and transmitted radiation, respectively.
Δμtot can be obtained directly from the experimental data by calculating the difference of the total absorption in the XAQ region between the first spectrum of the procedure of interest and each consecutive spectrum. To increase precision, the XAQ region of around 50–100 eV can be fitted by a straight line and its value in the center of the region can be taken as μtot for each spectrum.
Δμgas is negligible compared to Δμsam when the concentration of reactive components is limited to a few hundred ppm, the rest being light He carrier gas, or when the temperature, pressure, and composition of the gas feed do not change. Otherwise, it has to be calculated using the simple expression provided in the Supporting Information (SI).
Measuring Δμtot and calculating (or neglecting) Δμgas allows to calculate Δμsam
| 2 |
which can then be directly linked to the molar surface density of adsorbed or desorbed species Θads (that is, the amount of moles of the adsorbate per unit area of the sample surface exposed to the X-ray beam) by the following expression (derivation provided in the SI)
| 3 |
where re is the electron radius, λ is the X-ray wavelength, NA is the Avogadro number, Nj and fj″ are the number of atoms and imaginary part of the atomic scattering factor of jth atomic species constituting the molecule of adsorbates.
Since the mass, bulk density, elemental composition, and shape (e.g., diameter of the pressed pellet or capillary with loose powder) of the sample are usually known, obtaining Θads then allows to calculate the adsorption capacity (in moles of adsorbates per unit mass of the sample)
| 4 |
where ρsamA is the surface density of the sample. It is equally straightforward to obtain a molar ratio between the adsorbates and particular atomic species present in the sample.
Calculation (3) can be carried out using the existing codes to optimize the mass or thickness of the samples for XAS measurements, such as XAFSmass,3 all terms being either tabulated4,5 or known from the experimental conditions. Very similar calculations with the same codes are required to calculate the absorption edge step for each sample, so the majority of XAS users are already familiar with them.
Results and Discussion
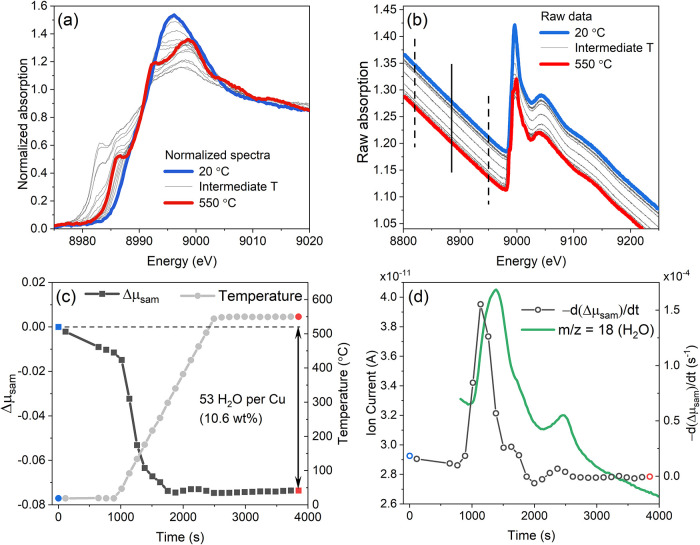
To illustrate the possibilities of the XAQ approach, Figure 1 shows the activation of copper-exchanged chabazite zeolite (Cu-CHA) with Si/Al = 6.7 and Cu/Al = 0.06, employed as the deNOx catalyst. The sample was heated in the flow of 10% O2 in He flow (100 mL/min) from room temperature to 550 °C at the BM23 beamline of the ESRF.6 This treatment causes the dehydration of the zeolite and coordination of the isolated Cu centers to the zeolitic framework (Figure 1a).
Figure 1.
(a) Normalized Cu K-edge XANES spectra collected during heating of Cu-CHA zeolite from RT to 550 °C in 10% O2/He flow. (b) Same data without normalization. Dashed lines indicate the XAQ fitting region and solid line shows its center where the total absorption is evaluated. (c) XAQ signal during heating (left) and temperature profile (right). (d) Time derivative of the XAQ signal (left axis) and water mass-spectrometer signal collected simultaneously with the XAS measurements.
The evolution of Cu K-edge XANES spectra agrees well with the literature data for Cu-CHA zeolites with similar Cu/Al and Si/Al ratios.7,8 The usual way of presenting normalized XANES data, such as in Figure 1a, however, does not allow to appreciate the change of the total absorption level due to desorption of water. However, in the raw data, the vertical shift of the spectra is clearly visible (Figure 1b). The corresponding XAQ signal shows a pronounced time and temperature dependence (Figure 1c) with the dehydration being completed at around 300 °C, equivalent to desorption of ca. 53 water molecules per Cu ion, or 10.6 wt % of the whole material (details of the calculation are presented in the SI). It is in good agreement with the TGA value of 11.7 wt %, the slight discrepancy being due to the partial dehydration of the sample in the dry gas flow during the alignment of the pellet under the beam before the first XAS spectrum was measured. Water desorption was also confirmed by a mass spectrometer connected to the outlet of the experimental cell during the XAS experiment (Figure 1d). Notably, the derivative of the XAQ signal agrees well with the signal of m/z = 18 (water), showing even faster and sharper time response due to its insensitivity to the large dead volume of the experimental cell that affects the MS data.
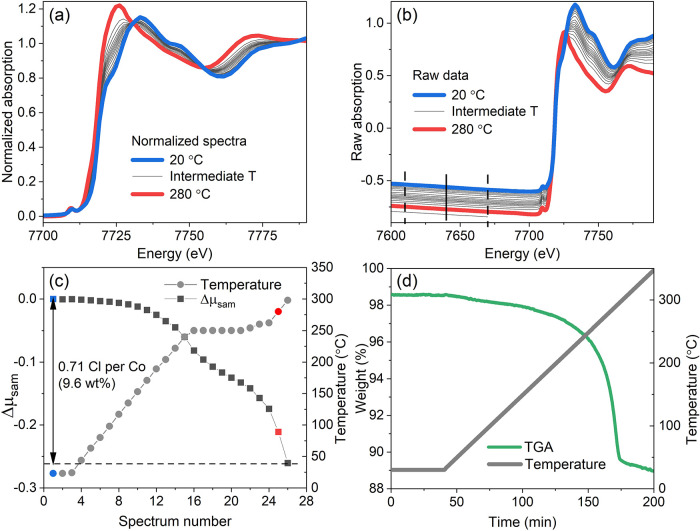
Another example of application of the XAQ technique is dechlorination of the Co2Cl4BTDD (BTDD = bis(1H-1,2,3-triazolo[4,5-b],[4,5-i])dibenzo[1,4]dioxin) metal-organic framework.9 This material was the first MOF reported to reversibly capture and release halogens, such as chlorine and bromine. The Co(III)–Co(II) redox process accompanying the desorption of one chlorine per Co during heating to 300 °C was revealed by XANES spectroscopy (Figure 2a).9 The resulting XANES spectrum of the MOF after heating was similar to the one of the parent Co2Cl2BTDD Co(II) MOF before chlorination, thus proving the reversibility of the process. However, the amount of desorbed chlorine was not measured during the XAS experiment, which did not make possible direct comparison of XAS conditions with those employed for separate TGA measurements. The advantage of the XAQ method is that it allows such quantification even if it was not foreseen in the original experiment. Since the XAS data were collected including more than 100 eV below the absorption edge (Figure 2b), XAQ signal could be reliably extracted from raw data (Figure 2c). The drop in the total absorption was equivalent to the loss of around 0.71 Cl atoms per Co, constituting 9.6 wt % of the material. It is in good agreement with the value of ca. 9.5 wt % obtained by TGA (Figure 2d).9 These data ensure the compatibility of the conditions employed for TGA measurements with those during the synchrotron XAS experiment, thus confirming the reliability of the collected XAS data.
Figure 2.
(a) Normalized Co K-edge XANES spectra collected during the heating of Co2Cl4BTDD MOF from RT to 290 °C in He flow. (b) Same data without normalization. Dashed lines indicate the XAQ fitting region and solid line shows its center where the total absorption is evaluated. (c) XAQ signal during heating (left) and temperature profile (right). The point at 300 °C corresponds to the spectrum that was stopped after the data in the XAQ region were collected (bottom-most curve in panel b). (d) TGA of the same material performed separately. Panel (a) adapted with permission from Tulchinsky et al.,9 copyright 2017 American Chemical Society.
As demonstrated above, the XAQ method delivers the information analogous to the one typically obtained from TGA or TPD/TPR. Importantly, with XAQ, this information is collected at the same time, in the same conditions and from the same spot on the sample as the XAS data, which ensures perfect compatibility of the two datasets.
Nonetheless,
there are several important points to be considered
when assessing the feasibility of XAQ extraction from XAS data. In
particular, Δμsam exhibits strong dependence
on the atomic number of the adsorbates and the energy of the incident
radiation, which can be approximately expressed as  . It makes the detection of heavy
adsorbates
easier compared to the light ones and leads to a significant decrease
of the XAQ contrast at high energy, which makes the quantification
of low amounts of light adsorbates difficult at high-energy edges.
In addition, inhomogeneities of the sample can introduce errors in the XAQ signal during the temperature ramps if the experimental cell moves with respect to the beam because of the thermal expansion. This effect is detrimental also for the XAS data quality and therefore should be avoided regardless of the need for XAQ measurements by designing the experimental cells with minimal thermal expansion, by compensating for the thermal expansion moving the sample stage, or by preparing highly homogeneous samples.
Finally, a significant temperature gradient may exist along the X-ray optical path inside the sample cell, so the average temperature of the gas mixture may be different from the sample temperature. Assessing this gradient by an additional thermocouple would allow to decrease the associated error in the calculation of Δμgas in the experiments with varied temperature. Alternatively, Δμgas can be measured directly by conducting XAS scans without the sample in the short pre-edge region at the temperatures of interest. An ultimate solution would be to use experimental cells with short optical path and diluted gas mixtures, thus decreasing the absolute value of Δμgas.
Conclusions
To summarize, the XAQ method allows to determine from the transmission XAS data the amount of guest species adsorbed on the sample during the interaction with reactive gases or liquids. While it is unreasonable to perform a synchrotron XAS experiment only to obtain XAQ data, an important advantage of XAQ is that it can be extracted from properly collected transmission XAS spectra without any modification of the experimental procedure or need for additional equipment or software. Notably, combining XAQ with XANES/EXAFS does not cause an increase in the measurement time because the data in the XAQ region usually are collected anyway, being essential for normalization of the XANES and EXAFS spectra. The method offers a possibility to get quantitative information analogous to what is usually obtained by TPD, TPR, or TGA but simultaneously with XAS measurements and essentially at no extra cost with respect to the performed XAS experiment.
Acknowledgments
The authors thank S. Bordiga, E. Borfecchia, and G. Berlier (University of Turin, Italy) for fruitful discussions, T.V.W. Janssens, F. Wen, and P.N.R. Vennestroem (Umicore, Denmark) for providing the Cu-CHA sample, and M. Dincă and Y. Tulchinsky (MIT, USA) for providing the TGA data of Co2Cl4BTDD MOF. This project has received funding from the European Union’s Horizon 2020 research and innovation programme under the Marie Skłodowska–Curie grant agreement no. 847439.
Supporting Information Available
The Supporting Information is available free of charge at https://pubs.acs.org/doi/10.1021/acs.jpcc.2c00226.
The authors declare no competing financial interest.
Supplementary Material
References
- Bordiga S.; Groppo E.; Agostini G.; van Bokhoven J. A.; Lamberti C. Reactivity of Surface Species in Heterogeneous Catalysts Probed by In Situ X-ray Absorption Techniques. Chem. Rev. 2013, 113, 1736–1850. 10.1021/cr2000898. [DOI] [PubMed] [Google Scholar]
- Timoshenko J.; Cuenya B. R. In Situ/Operando Electrocatalyst Characterization by X-ray Absorption Spectroscopy. Chem. Rev. 2021, 121, 882–961. 10.1021/acs.chemrev.0c00396. [DOI] [PMC free article] [PubMed] [Google Scholar]
- Klementiev K.; Chernikov R. XAFSmass: a program for calculating the optimal mass of XAFS samples. J. Phys.: Conf. Ser. 2016, 712, 012008 10.1088/1742-6596/712/1/012008. [DOI] [Google Scholar]
- Chantler C. T. Theoretical form-factor, attenuation and scattering tabulation for Z=1-92 from E=1-10 eV to E=0.4-1.0 MeV. J. Phys. Chem. Ref. Data 1995, 24, 71–591. 10.1063/1.555974. [DOI] [Google Scholar]
- Henke B. L.; Gullikson E. M.; Davis J. C. X-ray interactions - photoabsorption, scattering, transmission, and reflection at E=50-30,000 eV, Z=1-92. At. Data Nucl. Data Tables 1993, 54, 181–342. 10.1006/adnd.1993.1013. [DOI] [Google Scholar]
- Mathon O.; Beteva A.; Borrel J.; Bugnazet D.; Gatla S.; Hino R.; Kantor I.; Mairs T.; Munoz M.; Pasternak S.; et al. The time-resolved and extreme conditions XAS (TEXAS) facility at the European Synchrotron Radiation Facility: the general-purpose EXAFS bending-magnet beamline BM23. J. Synchrotron Radiat. 2015, 22, 1548–1554. 10.1107/S1600577515017786. [DOI] [PMC free article] [PubMed] [Google Scholar]
- Paolucci C.; Parekh A. A.; Khurana I.; Di Iorio J. R.; Li H.; Caballero J. D. A.; Shih A. J.; Anggara T.; Delgass W. N.; Miller J. T.; et al. Catalysis in a Cage: Condition-Dependent Speciation and Dynamics of Exchanged Cu Cations in SSZ-13 Zeolites. J. Am. Chem. Soc. 2016, 138, 6028–6048. 10.1021/jacs.6b02651. [DOI] [PubMed] [Google Scholar]
- Negri C.; Martini A.; Deplano G.; Lomachenko K. A.; Janssens T. V. W.; Borfecchia E.; Berlier G.; Bordiga S. Investigating the role of Cu-oxo species in Cu-nitrate formation over Cu-CHA catalysts. Phys. Chem. Chem. Phys. 2021, 23, 18322–18337. 10.1039/D1CP01754C. [DOI] [PMC free article] [PubMed] [Google Scholar]
- Tulchinsky Y.; Hendon C. H.; Lomachenko K. A.; Borfecchia E.; Melot B. C.; Hudson M. R.; Tarver J. D.; Korzyński M. D.; Stubbs A. W.; Kagan J. J.; et al. Reversible Capture and Release of Cl2 and Br2 with a Redox-Active Metal–Organic Framework. J. Am. Chem. Soc. 2017, 139, 5992–5997. 10.1021/jacs.7b02161. [DOI] [PubMed] [Google Scholar]
Associated Data
This section collects any data citations, data availability statements, or supplementary materials included in this article.


