

Abstract
Background:
The first evidence of micro- and nanoplastic (MNP) exposure in the human placenta is emerging. However, the toxicokinetics and toxicity of MNPs in the placenta, specifically environmentally relevant particles, remain unclear.
Objectives:
We examined the transport, uptake, and toxicity of pristine and experimentally weathered MNPs in nonsyncytialized and syncytialized BeWo b30 choriocarcinoma cells.
Methods:
We performed untargeted chemical characterization of pristine and weathered MNPs using liquid chromatography high-resolution mass spectrometry to evaluate compositional differences following particle weathering. We investigated cellular internalization of pristine and weathered polystyrene (PS; ) and high-density polyethylene (HDPE; ) particles using high-resolution confocal imaging and three-dimensional rendering. We investigated the influence of particle coating with human plasma on the cellular transport of PS particles using a transwell setup and examined the influence of acute MNP exposure on cell viability, damage to the plasma membrane, and expression of genes involved in steroidogenesis.
Results:
Chemical characterization of MNPs showed a significantly higher number of unique features in pristine particles in comparison with weathered particles. Size-dependent placental uptake of pristine and weathered MNPs was observed in both placental cell types after 24 h exposure. Cellular transport was limited and size-dependent and was not influenced by particle coating with human plasma. None of the MNPs affected cell viability. Damage to the plasma membrane was observed only for PS particles in the nonsyncytialized cells at the highest concentration tested (). Modest down-regulation of hsd17b1 was observed in syncytialized cells exposed to pristine MNPs.
Discussion:
Our results suggest that pristine and weathered MNPs are internalized and translocated in placental cells in vitro. Effects on gene expression observed upon pristine PS and HDPE particle exposure warrant further examination. More in-depth investigations are needed to better understand the potential health risks of MNP and chemicals associated with them under environmentally relevant exposure scenarios. https://doi.org/10.1289/EHP10873
Introduction
Micro- and nanoplastics (MNPs) are global environmental pollutants with widespread exposure in the human environment e.g., food,1,2 water,3 air,4,5 and dust.6 Nevertheless, MNP toxicokinetics and toxicity in humans are still largely unexplored.7 Recent animal studies have shown that ingested or inhaled MNPs can translocate across pulmonary and intestinal cell barriers to secondary organs, including placental and fetal tissues.8–11 Moreover, epidemiological research indicates that fine particles () from air pollution can reach the placenta in situ and increase the risk of pregnancy complications such as gestational diabetes and preeclampsia,12,13 preterm birth, or low birth weight.14 These findings have raised concerns for potential adverse health effects of placental MNP exposure during pregnancy, a period of heightened vulnerability when even subtle environmental insults can have long-lasting effects on fetal development and health later in life.15,16
To date, a limited number of human in vitro placenta cell models17–19 and ex vivo placenta perfusion studies20–22 have demonstrated the transplacental transport of polystyrene MNPs. Recently, a study by Ragusa et al.23 was the first to detect MNPs in human placenta samples. Although this research provides the first indication of placental exposure, understanding of placental toxicokinetics and toxicity of MNPs is limited. Gaining insight into these mechanisms is indispensable for a better understanding of possible adverse effects on placenta development and functioning and how these relate to fetal health.
The placenta is a unique and complex temporary organ that nourishes and protects the fetus. It is a multilayered membranous structure that forms at the interface of maternal and fetal circulation and facilitates the exchange of gases, nutrients, metabolites, and waste products.24 Chorionic villi covered by villous trophoblasts (Figure 1A) are the main placental structures involved in the fetomaternal exchanges.25 The inner layer of the villous trophoblasts is formed by stemlike cells called cytotrophoblasts.26 These cells proliferate and differentiate by fusion to syncytiotrophoblasts, large multinucleated cells that form the top layer of the villous tree.26 Syncytiotrophoblasts are in direct contact with maternal blood and thus are the main cells to facilitate the fetomaternal exchange.27 Syncytiotrophoblasts also function as important endocrine cells involved in biosynthesis and metabolism of a variety of hormones (e.g., leptin, human chorionic gonadotropin, progesterone, estrogens) crucial for the regulation of maternal and fetal physiology.27,28 Growing evidence shows that disrupted functioning of the villous trophoblasts can lead to impaired endocrine, metabolic, and transport functions of the placenta, resulting in a variety of pregnancy complications.29–31 Although syncytiotrophoblasts are the first placental cells in contact with maternal blood and are crucial for fetomaternal exchange and placental functioning, to date, no data exist on the uptake or toxicity of MNPs in syncytiotrophoblasts in vitro. The BeWo cell line derived from a human immortalized trophoblast, morphologically and functionally resembles villous cytotrophoblasts and is one of the most widely used placental cell models.32 The BeWo b30 variant forms a confluent and polarized monolayer and has been successfully used in a variety of transport studies including transport of, e.g., gold,33 silver,34 silica,35 iron,36 or polystyrene nanoparticles.19 The intercellular fusion and differentiation (syncytialization) of BeWo b30 can be successfully triggered by forskolin, resulting in the formation of endocrine active cells that resemble in situ human syncytiotrophoblasts.37–40
Figure 1.
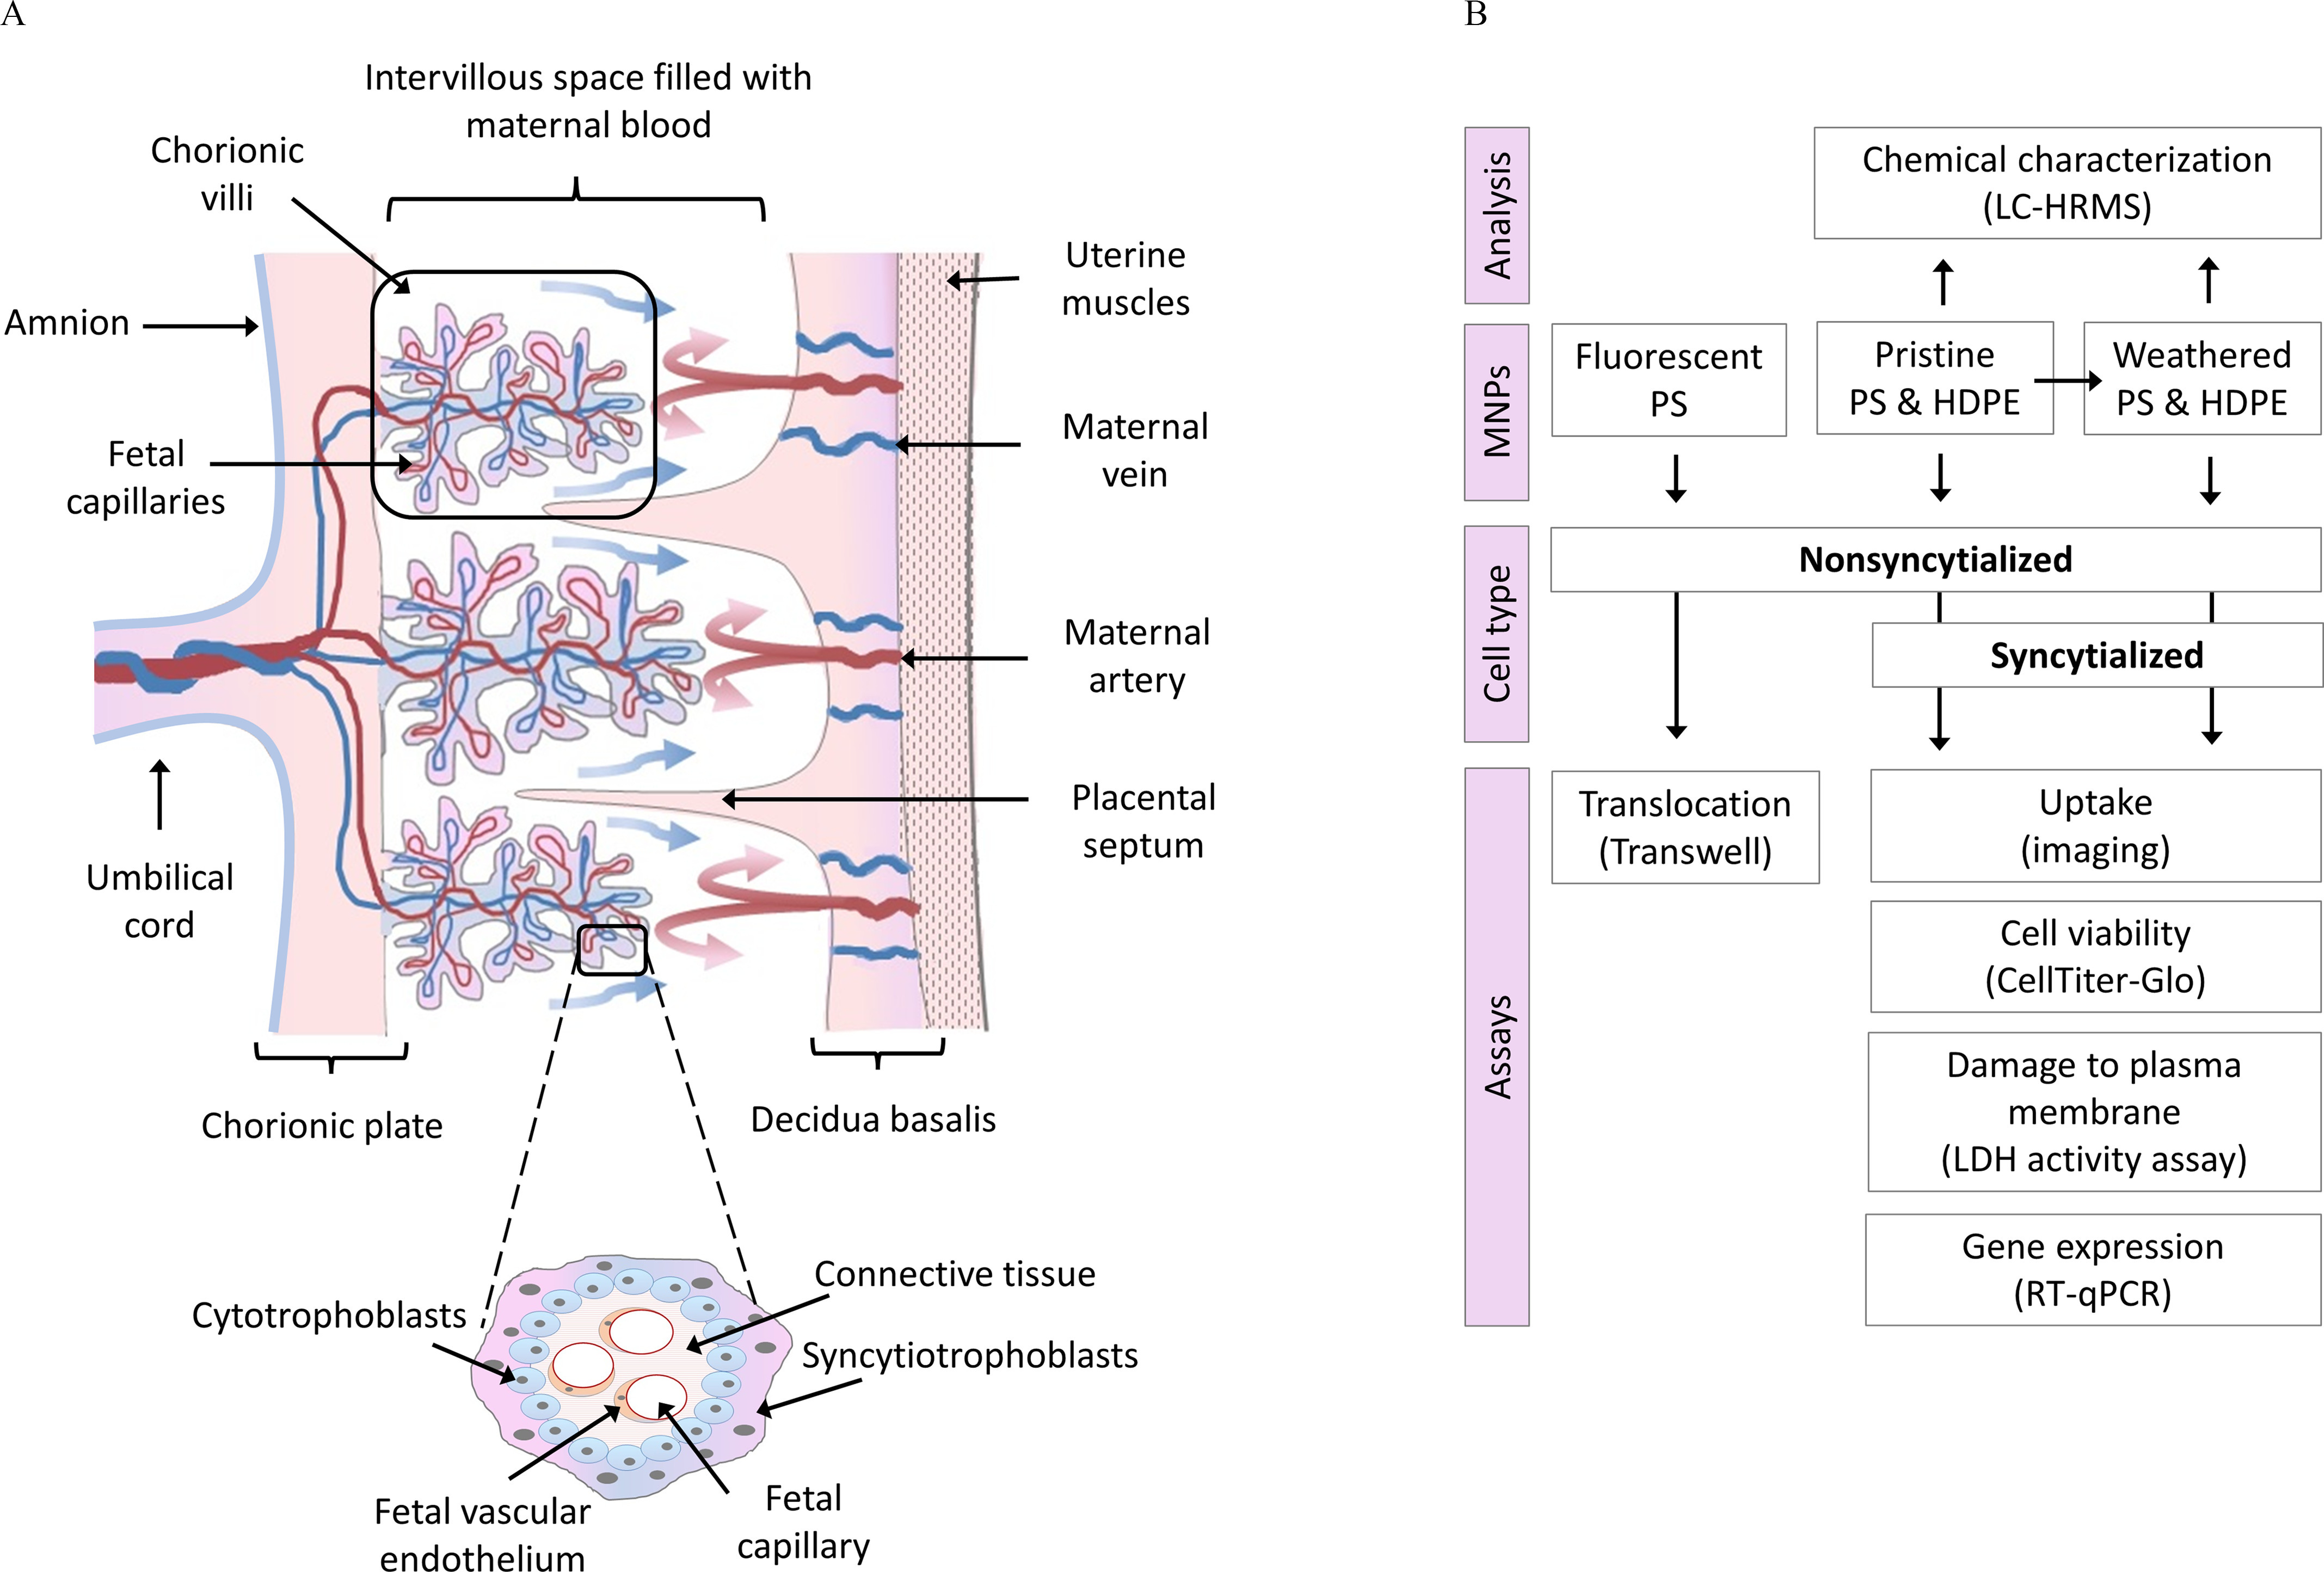
(A) Cross-section of early gestation human placenta showing chorionic villi covered by syncytiotrophoblasts and cytotrophoblasts. (B) Experimental design for analysis of translocation, uptake and toxicity of pristine and weathered micro- and nanoplastics (MNPs) in nonsyncytialized and syncytialized BeWo b30 cells. Note: HDPE, high-density polyethylene; HRMS, high-resolution mass spectrometry; PS, polystyrene.
Particle size, morphology, surface charge and protein corona are factors that can influence translocation of MNP over different cellular barriers.41,42 Nevertheless, their role in transplacental MNP transport is still not well understood. Moreover, the key characteristics potentially driving toxicity, such as the presence of inherent or adsorbed contaminants, are largely understudied. Due to the challenges in capturing and isolating environmentally weathered MNPs, the majority of toxicity studies have used pristine, manufactured particles that may not be representative of real environmental exposures. The goal of this study was to examine both pristine and experimentally weathered MNPs at different sizes to investigate the influence of polymer type, size, and weathering on the transport, uptake, and toxicity in both nonsyncytialized (undifferentiated) and syncytialized (differentiated) BeWo b30 cells. The model MNPs selected for this study were polystyrene (PS) and high-density polyethylene (HDPE) particles, two commonly used polymers present in a wide variety of consumer products. We investigated the cellular internalization of MNPs, using high-resolution confocal imaging and three-dimensional rendering, and developed a method for quantitative analysis of cellular uptake in both cell phenotypes. Moreover, we investigated the influence of human plasma protein corona on the cellular transport of MNPs in a transwell setup. Furthermore, we investigated the influence of MNP exposure on several toxicity end points, including cell viability, damage to the plasma membrane, and expression of genes important in the placental biosynthesis of steroid hormones. Last, to gain the first insight into particle vs. chemical toxicity, we performed an untargeted, small molecule characterization of pristine and weathered MNPs using liquid chromatography high-resolution mass spectrometry (LC-HRMS). This approach allowed us to test for the presence of co-transported pollutants and to evaluate compositional differences following particle weathering.
Materials and Methods
An overview of the experimental design is presented in Figure 1B. A full list of reagents can be found in Supplemental Material, “Reagents.”
Pristine and Weathered MNPs
Fluorescent and nonfluorescent MNPs of different sizes were used in this study. Fluoresbrite YG polystyrene (Cat. no. 17149), (Cat. no. 17151), (Cat. no. 17154), and (Cat. no. 18140-2) particles (Fluo-PS) were purchased from Polysciences Europe GmbH, delivered as 2.5% aqueous suspension. Nonfluorescent MNPs, i.e., an HDPE (HDPE Abifor) powder with nonuniformly shaped particles ranging from in size (Gaussian grain size distribution : , , ; Von Moos et al.43) and PS microspheres at (Cat. no. 08691), (Cat. no. 07304), (Cat. no. 07310) and (Cat. no. 17136; Polysciences Europe GmbH) were kindly provided by Deltares. Stocks of pristine HDPE and PS particles were prepared by washing the particles in hexane and phosphate-buffered saline (PBS), respectively; then the particles were centrifuged for 10 min at at room temperature and resuspended in PBS (1% solids w/v). For weathering experiment the washed HDPE and PS were resuspended in environmental water (sampled alongside a wide ditch at Tolakkerlaan, approximate coordinates 52°04'58.4''N 5°11'37.1''E, Utrecht, the Netherlands). The water was sampled in presterilized glass bottles, which were filled by opening the bottle below the water surface, and then filtered through a standard paper filter to remove the bigger particles. The weathering was performed in a duplicate setup, in glass bottles for 4 wk at room temperature with exposure to sunlight and constant shaking (), and particle concentration of 0.1% (w/v). After weathering, the particles were washed with PBS, separated from the liquid by decanting, pooled, and resuspended in PBS (1% solids w/v). Because of the hydrophobic nature of HDPE, stocks in PBS were additionally supplemented with bovine serum albumin (BSA) to bring the particles into a homogenous suspension. BSA was dissolved in PBS, filtered through a sterile Corning® syringe filter (431219; Sigma Aldrich) and added to a final concentration of 0.5% w/v (1:1 w/w BSA to HDPE). For all exposure studies, if not specified otherwise, serial dilutions of the highest MNP stocks (0.1, 1, 10, ) were prepared in the exposure medium (culture medium without phenol red) and added to the cells so that the concentration of PBS did not exceed 1%.
Chemical Characterization of Pristine and Weathered MNPs
A nontargeted, small molecule characterization was performed on MNP stock suspensions to evaluate chemical differences between pristine and weathered MNPs and to test for the presence of co-transported pollutants following weathering using previously described methods.44 Briefly, MNP suspensions (pristine and weathered PS with , , , and diameters) were prepared for analysis by diluting of aliquots with acetonitrile and centrifuging for 10 min at . The supernatants were analyzed (in triplicate) using dual-column (HILIC: Waters XBridge BEH Amide XP HILIC, ; and : Higgins Targa C18, ) liquid chromatography paired with positive or negative mode electrospray ionization interfaced to a Thermo Scientific Q-Exactive HFX Orbitrap high-resolution mass spectrometer. Analyte separation for HILIC was accomplished using acetonitrile and formic acid; separation for used an acetonitrile and ammonium acetate gradient. The mass spectrometer was operated at a resolution of 120,000 and mass-to-charge ratio (m/z) range of 85–1,275. Uniquely detected ions consisted of m/z, retention time, and ion abundance referred to as m/z features (all descriptors used in the analysis are explained further in Excel Table S1). High-resolution detection of m/z features was accomplished by a maximum injection time of 100 milliseconds and an Automatic Gain Control target of . Raw data files were extracted and aligned using apLCMS45 with modifications by xMSanalyzer.46 Detected signals with a fold-change of 5 or higher relative to the PBS buffer solution were annotated using xMSannotator by matching accurate mass m/z to the plastics and plastic-related chemicals from PLASTICS|NORMAN: Database of Chemicals likely (List A; 906 chemicals) and possibly (List B; 3,377 chemicals) associated with Plastic Packaging (CPPdb).47 Compound annotation confidence was determined based on Schymanski et al. by matching accurate mass, isotope, and adduct patterns to the combined plastic database; potential compound structures were ranked based on PubMed reference counts.48,49 Initial differences between pristine and weathered MNPs were characterized using partial least squares discriminant analysis (PLS-DA). Next, a variable importance projection (VIP) score was used to identify signals that differed due to MNP weathering. To characterize the potential origin of plastic chemicals with , annotated compounds were assigned a primary use category based on a database of plastic-related chemicals (PlasticMap) recently compiled by Wiesinger et al. from industrial, scientific, and regulatory data sources.50 InChiKeys were used to avoid misclassifications due to differences in chemical names.
Bewo b30 Culture and Syncytialization
The BeWo b30 choriocarcinoma cell line (AddexBio; Cat. no. C0030002) was kindly provided by Prof. Aldert Piersma and Conny van Oostrom (RIVM, the Netherlands). The cells were maintained in DMEM/F12 supplemented with 1% (v/v) P/S and 10% (v/v) fetal bovine serum (FBS) and incubated at 37°C with 5% and 95% relative humidity. Every 3 d, when reaching 70%–90% confluency, cells were washed with PBS and subcultured using 0.05% trypsin-EDTA solution. Differentiation and intracellular fusion (syncytialization) were induced by treatment with forskolin 48 h post seeding when cells reached approximately 50% confluency. A stock solution of forskolin () was prepared in dimethylsulfoxide (DMSO) and added to the cells in culture medium to the final concentration of at 0.1% DMSO. Medium with forskolin was refreshed daily for 3 consecutive days. An equal volume of DMSO was added as a vehicle control to the nonsyncytialized BeWo cells. Two different cell culture media, MEM and DMEM/F12, were tested to ensure optimal conditions for BeWo b30 cell culture and syncytialization. The cells were seeded in a transparent 12-well plate, cultured, and differentiated in each test media; the cells were then stained and imaged as described below (, with two technical replicates per plate). In general, undifferentiated cells showed a more consistent morphology when cultured with a medium containing high-glucose DMEM/F12; i.e., cells formed a tighter confluent monolayer and showed clearer cellular boundaries, as indicated with (Sir-actin) and tight junctions (ZO-1) staining (Figure S1). Therefore, DMEM/F12 was used in experiments throughout this study.
Cellular Imaging and Quantification of MNP Uptake
For the visualization of the cells and quantification of the cellular uptake of MNPs, cells were seeded at a density of in a transparent 12-well plate containing glass covers precoated (for 2 h at 37°C) with collagen (type IV) from human placenta ( in 0.25% acetic acid), cultured and differentiated as above. On day 6 post seeding, the nonsyncytialized and syncytialized cells were exposed for 24 h to fluorescent and nonfluorescent PS at 0.05, 0.2, 1, and size at different concentrations in of exposure media. To ensure an optimal nontoxic particle density during imaging, the concentrations used were chosen for each condition separately and kept within the nontoxic concentration range as indicated by cytotoxicity assays in this study. Exposed and not-exposed cells (control) were fixed in 4% formaldehyde (10 min), washed with PBS and treated (for 1 h at room temperature) with blocking buffer (3% BSA in PBS) containing DAPI (), SiR-actin labeling probe (), and ZO-1 antibody () or Vybrant labeling dye (), to stain nucleus, , and tight junction or plasma membrane, respectively. In the case of ZO-1, cells were subjected to the second round of staining with the secondary antibody (Alexa594, ) for 1 h at room temperature. After staining, the cells were washed with PBS and rinsed in MilliQ, and the glass covers were mounted on a slide for imaging. Cells were imaged using a Leica TCS SP8 STED 3X microscope with a pulsed () white-light laser (WLL), DPSS laser, HyD/PMT detectors, and spectroscopic detection. For imaging of beads, we used HC PL APO 20x/075 IMM CORR CS2 (Leica 15506343) dry objective, and all other conditions were imaged using HC PL APO GLYC motCORR STED (Leica 15506417) glycerol-immersion objective with corrective collar. Due to the absence of spectral cross talk, all fluorescent channels were imaged simultaneously. For DAPI imaging, we used DPSS laser as the excitation source and detected emission in the spectral range; for fluorescent beads, we used excitation (WLL) and emission range; for Vybrant dye, we used excitation (WLL) and emission; for ZO-1, we used excitation (WLL) and emission; and for SiR-actin, we used excitation (WLL) and emission. Nonfluorescent beads were imaged using transmitted light PMT with a laser as a source. For beads, the size of field-of-view (FOV) was , and for all other conditions, it was in the range between . The height of z-stacks was in the range of , chosen per each sample individually to include the whole thickness of the cell layer and to ensure that the detected MNPs were within the cells and not only present on top of the cell boundary. The number of cells and particles per FOV was counted manually using the Cell Counter plugin for ImageJ (https://imagej.nih.gov/ij/plugins/cell-counter.html). To accurately quantify and compare the particle uptake between the two cell types, the number of particles taken up was calculated per area (square millimeters) occupied by the cells rather than per cell. Mean values of the particle uptake were calculated based on FOV per sample from at least two independent experiments (). To calculate an area occupied by the cells (adjusted cell density) in a FOV, we merged maximum intensity projections of the membrane (Vybrant dye) and actin (SiR-actin) channels, convolved it with a Gaussian filter of 2 pixels (to remove noise), applied threshold manually, and calculated background area using “Analyse Particles” function of ImageJ. Cell occupied area was calculated as the total area of FOV minus background area. Additionally, to image changes in cell morphology during syncytialization, the nonsyncytialized and syncytialized cells were stained with May–Grünwald–Giemsa following a standard protocol51 and imaged with bright field microscopy.
Transwell Experiments
Nonsyncytialized BeWo b30 cells were seeded at a density of , on 12-well polycarbonate Transwell® inserts with diameter and pore size (Corning®, Sigma Aldrich), containing of culture medium on the basolateral and on the apical side. The medium was replaced every second day. The formation of the monolayer and the monolayer integrity were monitored using transepithelial electrical resistance (TEER) measurements and sodium-fluorescein (Na-Flu) leakage assay.
TEER measurements.
Monolayer formation was monitored with a Millicell®-ERS (Electrical Resistance System), a volt-ohm meter that measures membrane potential and resistance of cell monolayers in culture. TEER values were measured for 12 consecutive days in a transwell plate equilibrated to room temperature and in the presence and absence of cells. The final TEER values were determined by subtracting the intrinsic resistance (insert membrane without cells) from the total resistance (insert membrane with cells) and were corrected for the surface area ().
Na-Flu leakage assay.
The barrier integrity was further evaluated with a fluorescein sodium salt (Na-Flu) leakage assay. A stock solution of Na-Flu () was prepared in DMSO. At 4, 6, 8, and 11 d post seeding, of Na-Flu (0.1% DMSO) was added to the apical side, and of medium only was added to the basolateral side. To avoid interference with fluorescence measurements, exposure medium (culture medium without phenol red) was used. After 3 h incubation, of the sample was removed in triplicate from the basolateral side, transferred into a black 96-well plate and analyzed using a fluorescent plate reader (POLARstar Galaxy, BMG Labtech GmbH) and excitation and emission wavelength, respectively. The final concentration of Na-Flu in the basolateral side was calculated using a Na-Flu dilution series (), corrected for background fluorescence and volume and expressed as the average basolateral amount of the initial Na-Flu concentration in a percentage, based on three independent experiments ().
Translocation study.
The transport of Fluo-PS over the monolayer was measured by exposing cells at day 11 post seeding. Fluo-PS at 0.05, 0.2, and were added () in exposure medium () to the apical side of the transwell, and their transport to the basolateral side was monitored at different time points: 1, 2, 5, 24, and 48 h, in three independent experiments (). At each time point, of medium from the basolateral side was transferred into a black 96-well plate, and the fluorescence intensity was measured with a plate reader (Tecan Infinite M200; Tecan Trading AG), with excitation and emission wavelength set at 441 and , respectively. Fluo-PS in three different conditions were used for the translocation studies: noncoated particles (NC), particles precoated with human plasma (P), and particles precoated with heat-deactivated human plasma (DP). We chose plasma, not serum, because it contains clotting factors and thus resembles more closely maternal blood. A whole blood sample was obtained from a healthy donor with informed consent (University Medical Center Utrecht, the Netherlands). The plasma was isolated by centrifuging the whole blood (EDTA-treated) for 25 min at at room temperature. The collected plasma was stored at . Heat-deactivated plasma was prepared by heating in a water bath at 56°C for 1 h. The coating was done by incubating the particles ( of each highest stock) with plasma (1:4 particles to plasma ratio, v/v) for 2 h at 37°C and constant shaking (at ). The particles in the plasma () were resuspended in the exposure medium before cell exposure to a final volume of and particle concentration of and final plasma concentration of 1.6%. The mass transported () into the basolateral side at each time point () was calculated with a calibration curve (0.01, 0.1, 1, 10, ) prepared for each of the conditions and corrected for blank sample (fluorescent intensity of nonexposed cells) and volume loss during sampling, using the following equation:
| (1) |
where is the concentration of the sample measured at time , is the volume of the well sampled, is the sampling volume (), and the term represents the cumulative mass removed by sampling during all the previous sampling periods.52 The final amount transported was reported as a number of particles transported and as a percentage of the initial mass added to the apical well (). The method’s limits of detection were calculated for each time point separately as 3 times standard deviation of the signal measured in the exposure medium only ().
Cell Viability
The viability of the cells was determined using CellTiter-Glo® luminescent assay, which measures adenosine triphosphate (ATP) as an indicator of metabolically active cells. The amount of ATP present is directly proportional to the number of viable cells. Briefly, BeWo b30 cells were seeded at a density of ( per well) in a black 96-well plate. Cells were differentiated and exposed to MNPs at 0.1, 1, 10, and on day 6 post seeding as described above. The concentration range was chosen to encompass a wide range of concentrations used in previous studies17,19 and falls within the quantifiable concentration of plastic particles found recently in human blood ().53 After 24 h exposure, the plate was equilibrated to room temperature for approximately 30 min. After that, of medium from each well was transferred to a new 96-well plate, and an equal volume of assay reagent was added. ATP disodium salt was used to generate a calibration curve. A stock solution of ATP () was prepared in the exposure medium, and the calibration curve was prepared by serial 10-fold dilutions of the stock () and added in parallel to each plate. Contents were mixed for 2 min on an orbital shaker to induce cell lysis and then allowed to incubate at room temperature for 10 min to stabilize the luminescent signal. Luminescence was measured using a plate reader (Tecan Infinite M200). Data was corrected for the background luminescence measured in the wells containing medium only and expressed as mean percentage of the control (cells with no exposure), based on three independent experiments ().
Lactate Dehydrogenase Activity Assay
Lactate dehydrogenase (LDH) activity assay was used to evaluate the damage to the plasma membrane. In short, of BeWo b30 cell suspension () was added to each well of a transparent 96-well plate. Cells were grown and differentiated as described above. At day 6 post seeding, syncytialized and nonsyncytialized cells were exposed to MNPs at 0.1, 1, 10, and or a positive control Triton X-100 (0.1%, v/v) in of exposure medium. After 24 h exposure, of medium from each well was sampled into another 96-well plate containing of LDH assay buffer. Also, a NADH standard curve () was added in parallel to each plate. Next, of the Master Reaction Mix was added to each well, mixed for 2 min using a horizontal shaker and measured () at in a plate reader (Tecan Infinite M200). After the initial measurement, the plate was incubated at 37°C. Subsequent measurements were taken every 5 min until the value of the most active sample was greater than the value of the highest standard. Data was corrected for the background absorbance measured in LDH assay buffer only, and the LDH activity was calculated using the following formula:
| (2) |
where B is the amount of NADH (nanomoles) generated between and , the reaction time is (minutes), and V is the sample volume (milliliters). Mean LDH activity is reported as nanomoles/minute/milliliter (milliunit/milliliter), based on three independent experiments ().
Gene Expression Analysis
The effects of MNPs on placental hormone synthesis were investigated with real-time quantitative PCR (RT-qPCR) using syncytialized BeWo b30 cells and a set of genes directly involved in the placental steroidogenesis (cyp19, cyp11a1, hsd3b1, hsd17b1, sts; see Table S1 for a detailed primer list). BeWo b30 cells were seeded in 24-well plate (), cultured, differentiated, and exposed to MNPs at 0.1, 1, 10, and for 24 h in three independent experiments (), with three technical replicates per sample per plate. After 24 h, the cells were washed with PBS, and the RNAwas extracted using Tri-reagent following the manufacturer’s protocol. The quality and concentration of the extracted RNA were determined with Nanodrop 2000® (Thermo Scientific). RNA () was reverse transcribed using an iScript cDNA synthesis kit, and the cDNA was stored at until further use. RT-qPCR was performed with a CFX96 real-time PCR Detection System (BioRad) using SYBR Green universal supermix, 10 times diluted cDNA and of each primer in a final reaction volume of . qPCR reaction conditions were as follows: 3 min at 95°C followed by 40 cycles of 15 s at 95°C and 45 s at 60°C. A melting curve was included in each run to check for primer dimer formation and/or formation of secondary products. The Cq (determined by regression) was normalized to two reference genes and YWHAZ using the BioRad CFX analysis software, and the log2 fold change in expression () was calculated relative to the control group (nonexposed cells).
Statistical Analyses
Differences in the rate of transport between NC, P, and DP Fluo-PS particles over the nonsyncytialized BeWo b30 monolayer were investigated using the mixed-effects model and Tukey’s multiple comparisons test. For any other statistical analysis, the one-way analysis of variance (ANOVA) followed by Dunnett’s multiple comparisons test was used. All statistical analyses were performed using GraphPad (version 8.3; GraphPad Software, Inc.), with considered statistically significant.
Results
MNP Chemical Profiling
To mimic environmental weathering processes and to generate representative MNPs for the toxicological studies, PS and HDPE particles were weathered using the procedures described in the “Materials and Methods” section. This process was hypothesized to alter the surface chemistry of the MNPs and potentially increase the adsorption of organic compounds present in surface water. To gain insight into possible chemical changes occurring to the MNPs from the weathering processes, pristine and weathered PS were characterized for small molecule profiles using nontargeted HRMS. Initial analysis of nontargeted results showed 4,141 and 2,150 chemical signals, with peak intensities 5-fold or higher relative to the PBS buffer, detected for pristine PS and weathered PS, respectively (Figure 2A). A comparison of the two different PS formulations showed that pristine PS had the largest number of unique compounds, 301 were unique to the weathered PS particles, and 1,849 chemical signals were overlapping between the two formulations (Figure 2A). Potential identities of chemicals detected in the pristine and weathered particles were evaluated by annotating mass spectral signals using chemical databases that included plastic-related compounds, followed by PLS-DA to identify which annotated chemicals showed the greatest difference between pristine and weathered PS. Accurate mass annotation included matching based on coeluting adducts and isotopes to reduce false positives and identified 1,062 plastic-related chemicals from which 182 were high confidence (level 3) annotations and 880 low confidence (level 4) annotations (Excel Table S2). The 182 plastic-related chemicals detected in pristine and weathered PS corresponded to 282 unique compounds (Excel Table S2). The number of compounds was higher than the number of detected signals because isomers could not be differentiated using this HRMS approach. Annotated compounds included multiple plastic additives, intermediates in polymer synthesis, hydrolysis products, and environmental chemicals (Excel Table S2). PLS-DA analysis showed significant differences in compound levels associated with pristine and weathered PS and suggested that for pristine PS particles the differences could be mediated by particle surface area (Figure 2B). Primary use categories of compounds annotated with high confidence (level 3) were determined by comparison to a database of plastic-related chemicals (PlasticMap).50 The primary use categories that differed between pristine and weathered particles (with ) are listed in Figure 2C and included, e.g., catalysts, colorants, biocides, antioxidants, plasticizers, and monomers. Use categories for all annotated compounds are provided in Excel Table S3. Compounds present in the PLASTICS|NORMAN and Plastics Packaging Database that were not included in PlasticMap may represent plastic transformation products or environmental chemicals not directly linked to plastic manufacturing.
Figure 2.
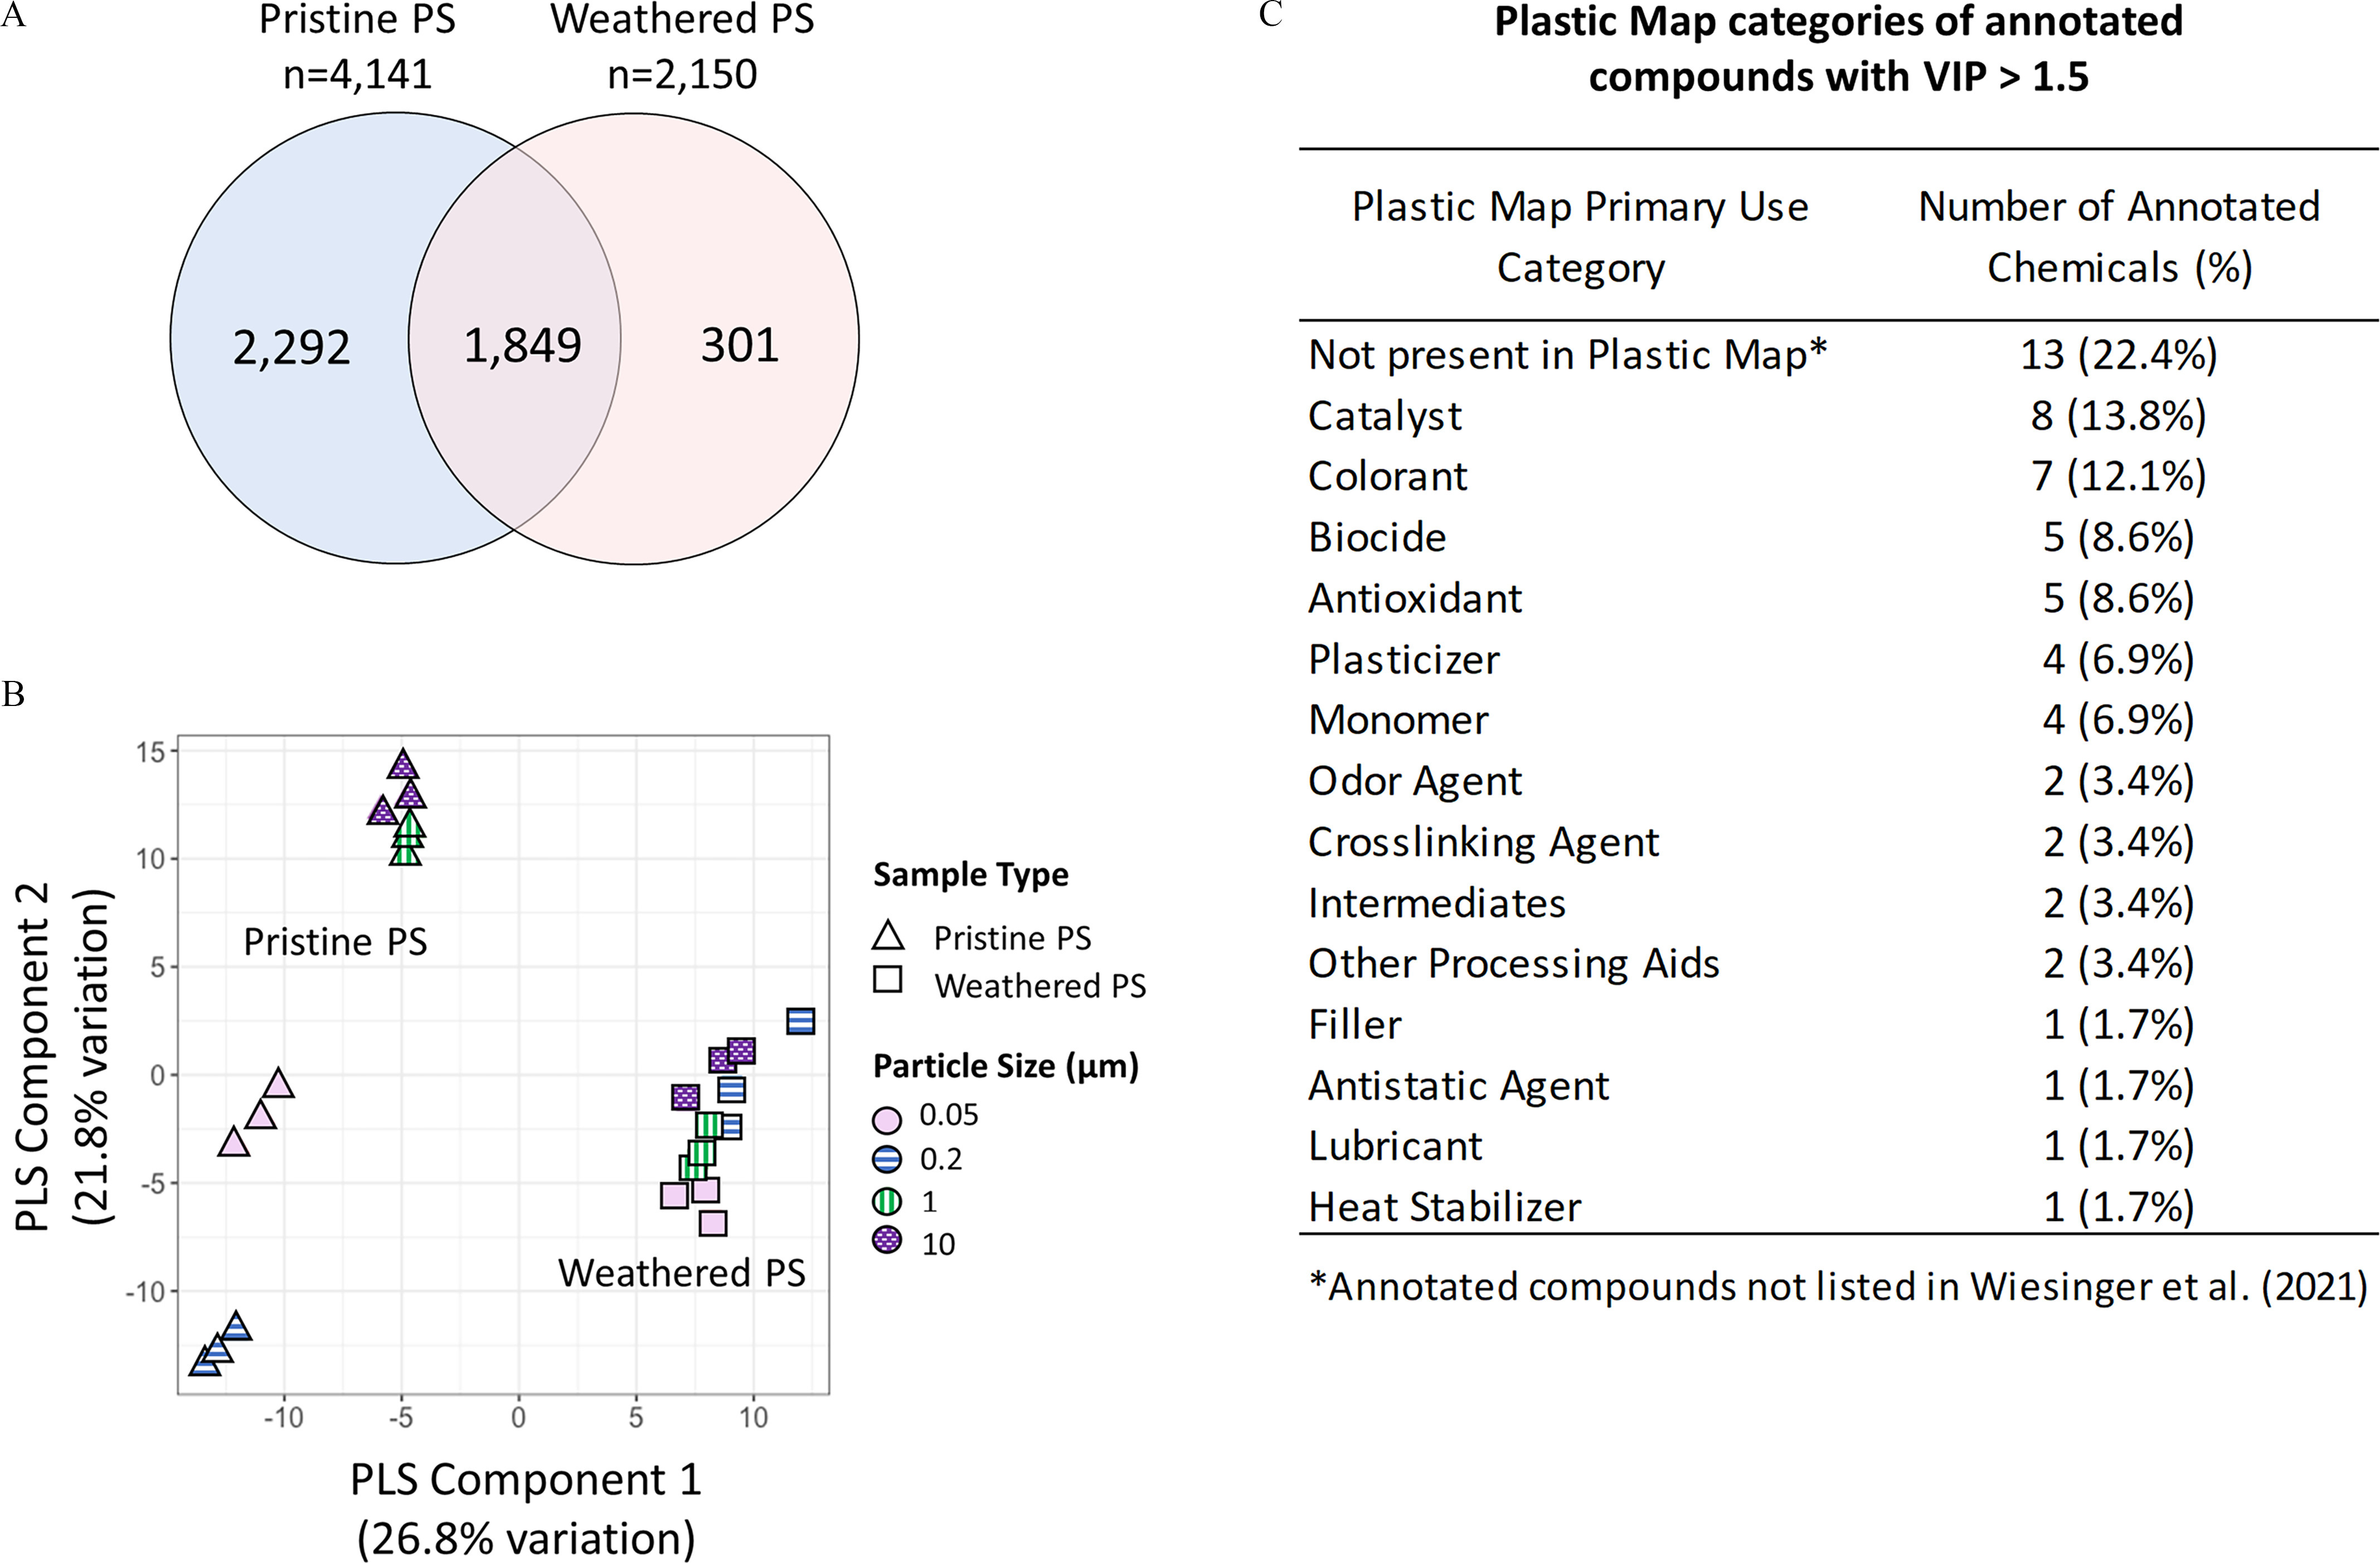
Differences in chemical profiles between pristine and weathered polystyrene (PS) particles. (A) Comparison of chemical signals detect in the pristine and weathered PS particles using liquid chromatography high-resolution mass spectrometry. (B) Partial least squares discriminant analysis (PLS-DA) of differentially expressed chemical signals between pristine and weathered PS particles. (C) Primary use categories assigned to the annotated compounds using PlasticMap database. Only compounds with high confidence annotations and variable importance projection (VIP) score were considered (Excel Tables S1–S3).
BeWo b30 Syncytialization
Forskolin treatment resulted in a differentiated morphological phenotype evident after 72 h, i.e., progressive nuclear aggregation followed by intercellular fusion (resulting in large multinucleated cells), loss of epithelial cell–cell junctions, and thus loss of barrier integrity of the confluent monolayer (Figure 3 and S1). The tight-junction protein ZO-1, a clear cell boundary marker in the nonsyncytialized cells, was notably less pronounced in the syncytialized cells (Figure S1). Therefore, for further imaging, a plasma membrane marker (Vybrant) was used instead. The syncytialized cells were distinct from the nonsyncytialized cells in morphology and size, i.e., consisted of large often multinucleated cells without clear cell boundaries (Figure 3). The adjusted cell density, calculated as the total area of FOV minus background area (Figure 4; Excel Table S4), showed that the syncytialized cells were on average approximately 3 times less dense than the nonsyncytialized cells, with a mean adjusted cell density of 1,964 and , respectively.
Figure 3.

Morphology of the nonsyncytialized (A) and syncytialized (B) BeWo b30 cells at 10 × (1) and 20 × (2) magnification. Syncytialization was induced with 72 h treatment with forskolin () as described in the “Materials and Methods” section. White arrows indicate multinucleated cells formed after syncytialization. Images were taken with bright field microscopy after May–Grünwald–Giemsa staining.
Figure 4.

Adjusted cell density per area (square millimeters) of the nonsyncytialized and syncytialized cells calculated as the total area of field of view (FOV) minus background area, based on DAPI (nucleus, yellow) and SiR-actin (, magenta) staining as described in the “Materials and Methods” section. Each dot represents cell density calculated from one FOV. Bands represent the 95% confidence intervals of the respective mean (; Excel Table S4).
Uptake of MNPs
Representative images (still frames) of the internalization of Fluo-PS in the nonsyncytialized BeWo b30 cells are presented in Figure 5 (also see Supplemental Video files for the representative 3D videos). Only Fluo-PS particles at 0.2, 1, and were investigated, because it was impossible to quantify individual particles due to their low fluorescent signal. Nonfluorescent MNPs were also investigated, using transmitted light PMT. Here, only and pristine and weathered PS particles were quantifiable, i.e., clearly visible and distinguishable from other cellular compartments (Figure 6). Moreover, for the nonfluorescent HDPE and PS particles, we observed weak auto-fluorescence in the red part of the spectrum (approximate excitation/emission wavelength of , Figure S2). However, the auto-fluorescence intensity was too low in comparison with the background cellular auto-fluorescence in the same spectral range to be used for quantification of cellular uptake. Additional imaging using polarized light microscopy (PLM) indicated that HDPE particles were also in contact with the placenta cells and possibly internalized (Figure S3); however, cellular uptake was not quantifiable using this method.
Figure 5.

Representative images of the internalization of fluorescent polystyrene particles (Fluo-PS) in nonsyncytialized BeWo b30 cells. Cells were exposed for 24 h to 0.2, 1 and Fluo-PS (fluo-green) at 25, 50, and respectively, stained for nucleus (DAPI, yellow) and (SiR-actin, magenta) and imaged with z-stacks using a Leica TCS SP8 STED 3X microscope and 20 × magnification. Images represent still frame (A) from 3D videos (available in the supplemental video files) complied from the z-stacks, and maximum projection image (B) of the respective sample.
Figure 6.

Nonfluorescent pristine polystyrene (PS) particles at 0.2, 1, and imaged in transmitted light PMT with a laser as a source, using a Leica TCS SP8 STED 3X microscope, in nonsyncytialized BeWo b30 cells. The control sample represents nonexposed cells.
The cellular uptake of and PS, calculated as a number of particles per area occupied by cells (square millimeters), was concentration-dependent and in general lower in syncytialized than in nonsyncytialized cells regardless of the concentration, type (pristine/weathered), or size of PS (Table 1; Excel Table S4). In general, higher uptake was observed at lower exposure concentrations (e.g., for PS, 0.83% and 0.46% of the initial mass were taken up at 0.5 and , respectively), indicating that the cell capacity for particle uptake was limited and might have reached saturation levels at the higher concentrations tested. Particle weathering seemed to affect the uptake of PS, resulting in a higher uptake of but lower uptake of in both nonsyncytialized and syncytialized cells (Table 1; Excel Table S4).
Table 1.
Comparison of the cellular uptake of pristine and weathered polystyrene (PS) particles between the nonsyncytialized and syncytialized BeWo b30 cells.
| Nonsyncytialized | Syncytialized | |||||
|---|---|---|---|---|---|---|
| Size | Condition | Mean (SD) | No. of FOV | Mean (SD) | No. of FOV | |
| Pristine | 0.1 | 234 (138) | 8 | 50 (38) | 8 | |
| Pristine | 1 | 950 (381) | 7 | 337 (246) | 3 | |
| Weathered | 1 | 3,143 (1,917) | 15 | 519 (253) | 15 | |
| Pristine | 0.5 | 8 (4) | 10 | 4 (5) | 10 | |
| Pristine | 5 | 41 (25) | 15 | 26 (14) | 10 | |
| Weathered | 5 | 30 (16) | 15 | 4 (4) | 15 | |
Note: Cellular uptake was quantified based on high-content imaging as described in the “Materials and Methods” section. Cells were exposed to pristine (including fluorescent) and experimentally weathered PS particles at and in size and varying concentrations (micrograms per milliliter). The mean number of particles taken up was calculated per area occupied by the cells (square millimeters), based on FOV per sample from at least two independent experiments, (Excel Table S4). FOV, fields of view; SD, standard deviation.
Translocation of MNPs
The development and integrity of the nonsyncytialized BeWo b30 monolayer formed in transwell inserts were monitored with TEER and Na-Flu leakage assay for 12 consecutive days (Figure 7). TEER values showed a steady increase over 9 d, stabilizing at on day 10 post seeding (Figure 7A). Simultaneously, the leakage of Na-Flu decreased over time, with 1.6% () of the initial concentration added to the apical well measured in the basolateral compartment at day 11 post seeding (Figure 7B). TEER values and the retardation of Na-Flu transport confirmed completion of the monolayer formation by day 10 post seeding.
Figure 7.
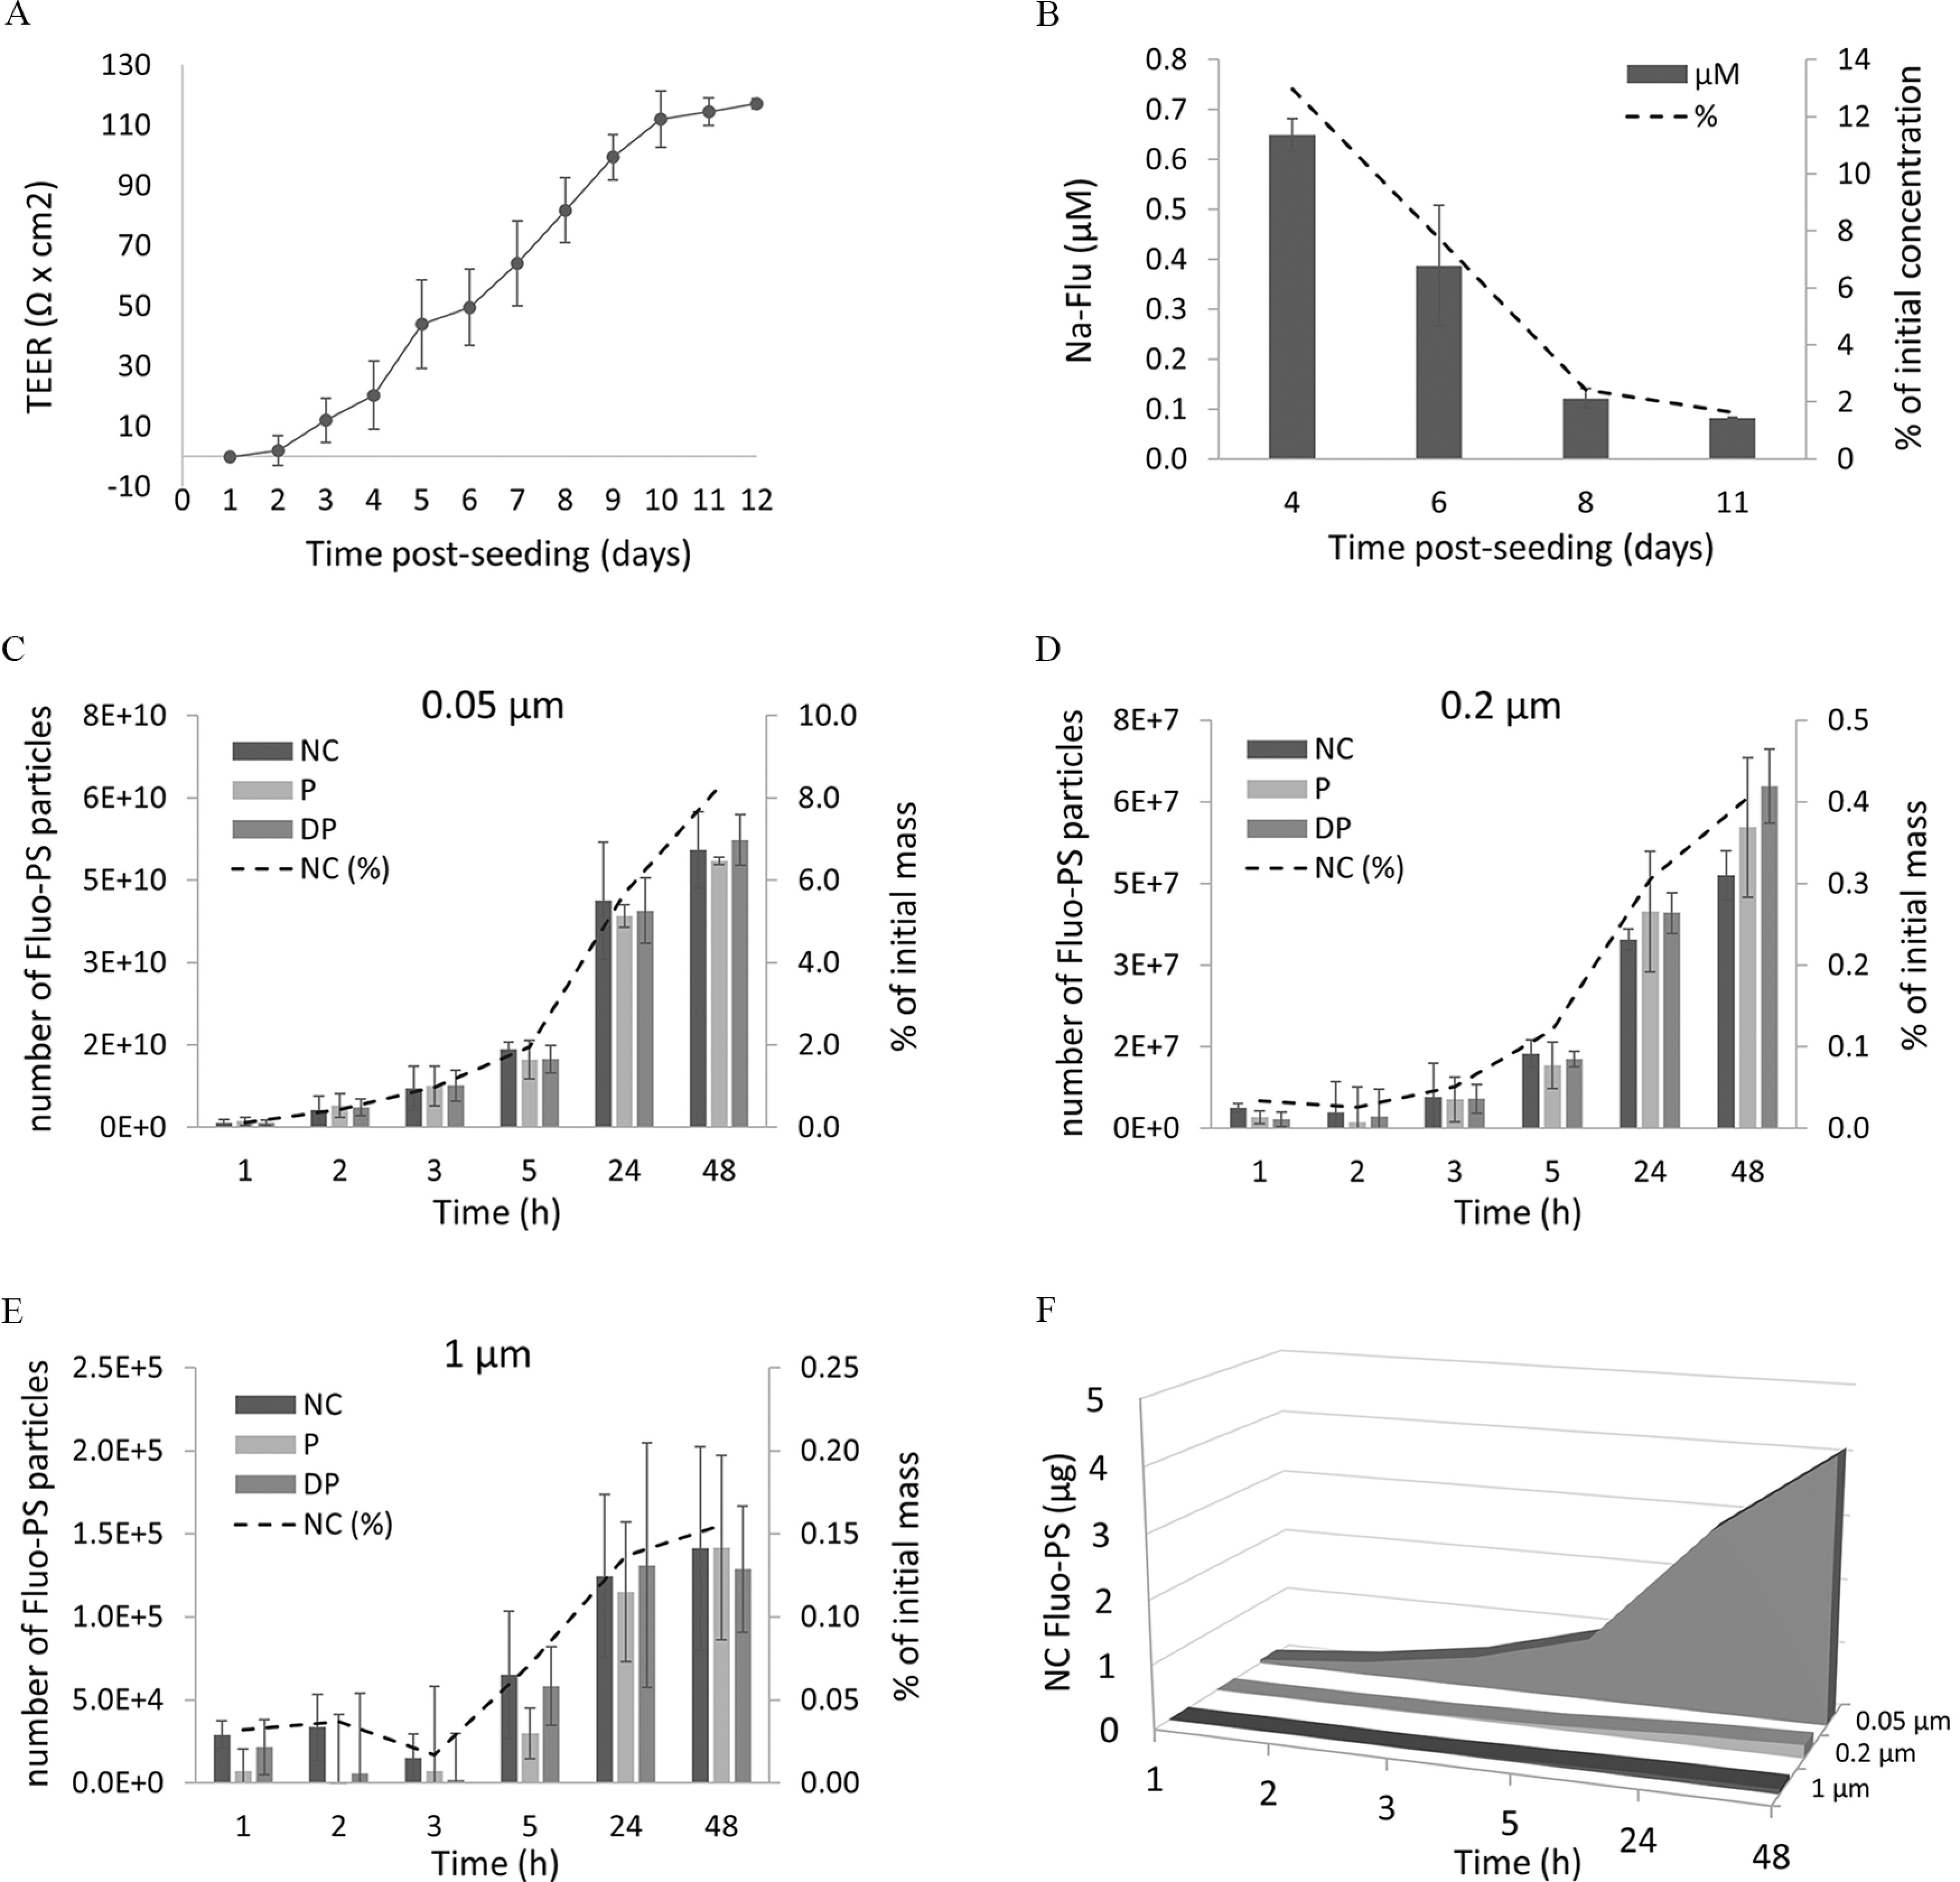
Translocation of fluorescent PS particles through nonsyncytialized BeWo b30 cells. (A) The formation of the monolayer was measured with TEER. (B) Barrier integrity was monitored with retardation of Na-Flu leakage (from apical to basolateral chamber), reported in (or percentage of initial concentration) measured in the basolateral chamber. Time-dependent apical to basolateral transport of (C) , (D) , and (E) , of NC, precoated with P and precoated with DP Fluo-PS particles, expressed as a number of particles [or percentage of the initial mass () transported] measured in the basolateral chamber. Comparison of the time-dependent apical to basolateral translocation [in micrograms of initial mass () transported] between different sizes of NC Fluo-PS across BeWo b30 monolayer (F). Translocation experiments were performed on day 11 post seeding. Data points represent mean values (; Table S2). No significant differences in the rate of transport were observed between NC, P, and DP particles, at any time point measured (mixed-effects model, ). Note: DP, heat-deactivated human plasma; NC, noncoated; P, human plasma; PS, polystyrene; SD, standard deviation.
As the transwell experiments depend on the measurement of fluorescence, the transport of MNPs was investigated only with the Fluo-PS particles. Fluo-PS particles at , , and were added () to the apical well at day 11 post seeding. Additionally, NC, P, and DP Fluo-PS particles were used to investigate whether the precoating with human plasma would influence the transport kinetics. The biggest size particles () were excluded from the transport study due to the use of transwell with a pore size, i.e., the biggest pore size that allowed for uniform cell growth without cell migration to the basolateral side. The transport of the particles was monitored over 48 h at six different time points (1, 2, 3, 5, 24, and 48 h). All three sizes of Fluo-PS were transported through the nonsyncytialized cell monolayer (Figure 7C–F; Table S2). The quickest transport over the monolayer was observed for Fluo-PS with the fluorescent signal (; Table S2A) measured in the basolateral compartment already 1 h after exposure, followed by (5 h) and particles (24 h) (Figure 7C–F; Table S2B). After 48 h of exposure, the average number of NC particles transported through the monolayer was (), (), and () for , , and Fluo-PS, which represented 8%, 0.4%, and 0.16% of the initial mass () added to the apical chamber, respectively (Figure 7C–F; Table S2C). For and particles, even after 48 h exposure, no flattening off of the number of particles transported was observed, which suggests that longer incubation times would result in higher translocation. No significant differences in the rate of transport were observed between NC, P, and HDP particles at any of the time points measured ().
Cytotoxicity, LDH activity, and effects on steroidogenesis.
The cytotoxicity of MNPs was investigated using CellTiter-Glo luminescent assay, which measures the amount of ATP present in culture as an indicator of metabolically active cells. None of the pristine or weathered PS (0.05, 0.2, 1, ) and HDPE particles showed cytotoxic effects in the nonsyncytialized or syncytialized cells, after 24 h exposure to 0.1, 1, 10, and concentration (Figure 8A; Excel Table S5). Plasma membrane integrity, quantified by measuring the release of the intracellular LDH into the cell culture medium upon damage to the plasma membrane, was also not affected by any of the conditions tested, except for PS particles at the highest concentration (), in the nonsyncytialized cells only (Figure 8B; Excel Table S5). In general, the LDH concentration measured in the cell culture medium was two times higher in the syncytialized cells () in comparison with the nonsyncytialized cells (; Excel Table S5).
Figure 8.
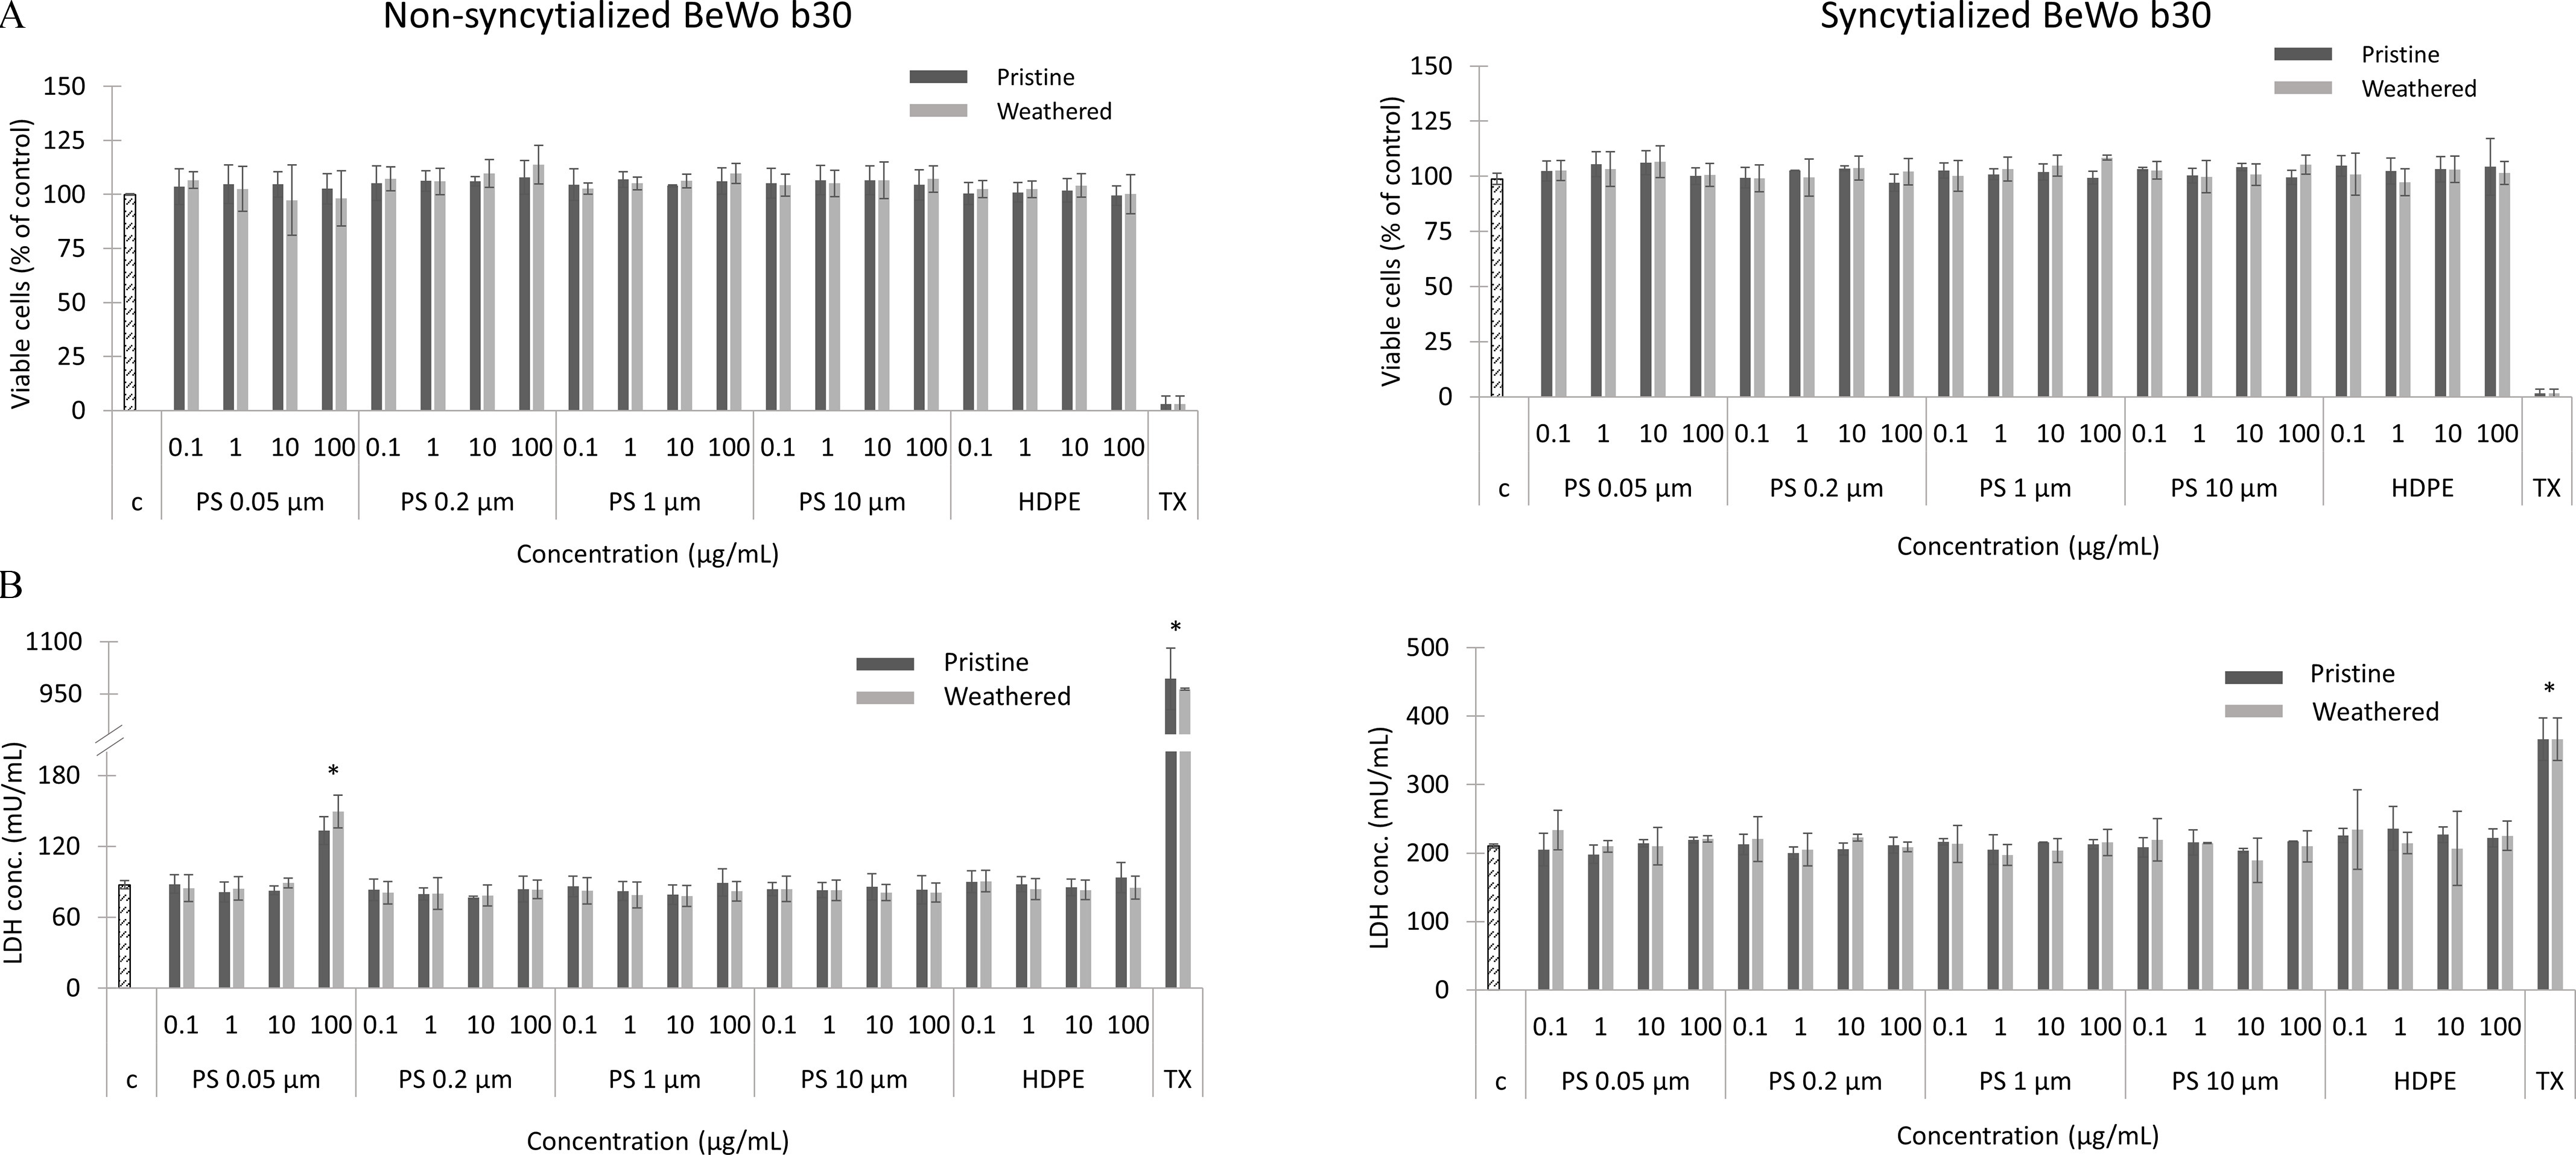
Cell viability (A) and plasma membrane integrity (B) of the nonsyncytialized and syncytialized BeWo b30 cells exposed for 24h to 0.1, 1, 10, and pristine and weathered HDPE, PS particles (0.05, 0.2, 1, and ), and Triton X (TX; 0.1%) as a positive control, measured with CellTiter-Glo® viability assay and LDH activity assay, respectively, as described in the “Materials and Methods” section. Data points represent the mean percentage of ATP present (; Excel Table S5) and LDH concentration (mU/mL) (; Excel Table S5). Control (C) represents nonexposed cells (one-way ANOVA; *). Note: ANOVA, analysis of variance; ATP, adenosine triphosphate; HDPE, high-density polyethylene; LDH, lactate dehydrogenase; PS, polystyrene; SD, standard deviation.
We also examined the expression of five genes involved in the placental biosynthesis of steroid hormones in syncytialized BeWo b30 cells to investigate the effects of pristine and weathered MNP and associated chemicals on placental steroidogenesis. Of the five investigated genes, only hsd17b1 was down-regulated in cells exposed to pristine MNPs and to a lesser degree weathered MNPs, whereas hsd3b1 was marginally down-regulated only after exposure to pristine particles (Figure 9; Figure S4; Excel Table S6). This trend was observed regardless of the type of size of MNP tested; nevertheless, it was not statistically significant ().
Figure 9.

Heat map representing the log2 fold change values in the expression of genes involved in steroidogenesis measured in the syncytialized BeWo b30 cells after 24 h exposure to of pristine and weathered HDPE and PS particles (0.05, 0.2, 1, and ). Values were normalized against the endogenous reference genes and YWHAZ. Red implies higher expression, white no difference, and blue lower expression relative to the nonexposed cells (; Excel Table S6). Note: HDPE, high-density polyethylene; PS, polystyrene.
Discussion
Human in vitro cell models of the placenta barrier are indispensable for understanding the placental uptake of MNPs and their possible adverse effects on placental functioning and consequently fetal and maternal health. Villous cytotrophoblasts and syncytiotrophoblasts are important cells of placenta villi, with the latter being the main cells responsible for maternal/fetal exchange and other specialized placental functions, such as hormone synthesis and metabolism.28,54 Nevertheless, to our knowledge, the toxicokinetics and toxicity of MNPs in syncytiotrophoblasts in vitro have not been reported. This study set out to investigate the uptake, transport, and toxicity of MNPs in both nonsyncytialized and syncytialized BeWo b30 cells, i.e., well-established in vitro placenta cell models representative of villous cytotrophoblasts and syncytiotrophoblasts, respectively.
In this study, all PS particles tested, including the large particles, were taken up by both nonsyncytialized and syncytialized cells. To our knowledge, only one other study, by Cartwright et al.,52 investigated PS uptake in the nonsyncytialized BeWo cells, whereas uptake in syncytialized cells has never been investigated. Overall, the nonsyncytialized cells showed higher uptake than the syncytialized cells. The smaller particles () were taken up more efficiently than the larger particles, confirming observation by Cartwright et al.,52 and the total uptake was higher at lower exposure concentrations, indicating that the cell capacity for particle uptake was limited and might have reached saturation levels at the higher concentrations and/or larger sizes. This data is supported by ex vivo placental perfusion studies where a size-dependent maternal-to-fetal translocation of PS particles (up to in size) was observed, with a lower transfer rate corresponding to a higher accumulation of larger PS particles in the placental tissue, specifically in the syncytiotrophoblast layer.20,55 Although the staining of cellular compartments together with z-stack confocal imaging and spectroscopic detection allowed for confirmation of cellular internalization of PS particles, the irregularly shaped, nonfluorescent HDPE were not distinguishable from other cellular compartments, and their internalization could not be confirmed with this method. Imaging using PLM indicated that HDPE particles were indeed in contact with the placenta cells and possibly internalized (Figure S3). Further studies are needed to confirm HDPE uptake using other methods or labeled particles.
Transcellular transport of Flu-PS across the nonsyncytialized BeWo b30 monolayer was limited () and size dependent, with higher transport rates observed for particles with a smaller diameter. Transcellular transport studies could only be performed with nonsyncytialized BeWo b30 cells that formed a tight, polarized monolayer on the transwell insert. Syncytialization resulted in cell fusion and loss of barrier integrity; therefore, MNP translocation using syncytialized BeWo cells could not be investigated. To our knowledge, in vitro transplacental transport of MNPs in nonsyncytialized BeWo b30 monolayers has been previously investigated in four studies, all of which used Fluo-PS particles as model MNPs. These studies reported size-dependent and limited transport within 24 h of exposure.18,19,52,56 It should be noted that there are discrepancies in the scientific literature regarding the timing of BeWo monolayer formation in the transwell setup (ranging from 4 to 10 d post seeding).18,57–59 These differences might stem from different insert types, pore size, pore density, passage number, seeding density, medium type, and volume used, among others.52,60 It is, therefore, crucial to monitor the monolayer formation on a day-to-day basis, using more than one indicator, such as a combination of TEER, retardation of Na-Flu transport, or/and confocal imaging.58 Moreover, it is important to note that the transwell inserts can, to various degrees, retain particles on the apical side, which might be dependent on the pore sizes and insert type. For example, polyester insert membranes have been shown to retain particles with higher efficiency than, e.g., polycarbonate inserts.52 In this study, the translocation of MNPs through the polycarbonate insert membrane only was significantly higher than when measured with the presence of nonsyncytialized BeWo cells (Table S2), which further confirmed the limited cellular transport of MNPs. In our study, the pore size was the largest pore size that allowed BeWo b30 monolayer formation without cellular migration to the basolateral side; nevertheless, it still limits the MNP size range that can be investigated in the transwell setup to . However, using imaging, we showed that MNPs up to in diameter were internalized by the nonsyncytialized and syncytialized BeWo cells.
In our study, the transport of and particles did not reach a plateau at 48 h (Figure 7C and D), suggesting that longer incubation periods may result in higher transport. Different size-dependent transport mechanisms have been proposed for MNPs, including passive diffusion, facilitated diffusion, and energy-dependent transport such as endocytosis.19,20 An interesting aspect is that trophoblastic cells also have the capacity for phagocytosis.41,61,62 Nevertheless, the extent to which these mechanisms influence MNP transplacental kinetics is still unknown. The size-dependent, limited transport of Fluo-PS observed in vitro is generally in agreement with ex vivo placenta perfusion studies.22,55 However, in placenta perfusions, PS particles accumulated mainly in the syncytiotrophoblasts layer, suggesting that syncytiotrophoblasts and not the cytotrophoblasts play a major role in regulating transplacental particle transport.20,35 The use of syncytialized BeWo cells may therefore provide more accurate estimations of the uptake or/and transplacental transport of MNPs. It should be noted, however, that the expression profiles of, e.g., transporter proteins, such as ATP-binding cassette (ABC) transporters and solute carriers (SLC), are not fully comparable between syncytialized BeWo cells and primary human trophoblast cells, likely in part due to the different developmental stages they represent.40 Overall, carefully validated experimental models are needed to study different aspects of trophoblast function. Furthermore, the use of placental co-cultures, although technically challenging, may more accurately reflect complex cell-to-cell interactions and provide a better understanding of the placental toxicokinetics of MNPs.
The protein corona has been shown to play an important role in the transport of metallic nanoparticles in in vivo cellular models and ex vivo placenta perfusion models (reviewed by Bongaerts et al.63) however, the influence of the protein corona on transplacental transport of MNPs is still not well understood. In our study, prior incubation of Fluo-PS with human plasma or DP did not enhance particle transport across BeWo b30 barrier. In contrast, Gruber et al.21 found that the protein corona formed during incubation of PS with human plasma enhanced placental transfer in a human ex vivo placenta perfusion study. In particular, the protein corona formed by human albumin was found to significantly induce transplacental transfer of drugs as well as PS particles.21,64 Moreover, serum heat-deactivation has been shown to affect PS protein corona composition, resulting in enhanced nanoparticle uptake in, for example, the human lung barrier model.65 In our study, the presence of FBS in the exposure medium might explain why we did not observe enhanced transport. It has been previously suggested that the complex interaction between particles and protein-rich media may lead to progressive displacement of proteins with lower affinity in favor of those with higher.66 This could change corona composition and dominate the overall properties of the particles,19,65,67 possibly neglecting the influence of prior plasma coating on cellular transport. Further studies are needed to corroborate this hypothesis.
The MNPs tested in this study showed no acute cytotoxicity. No effects on cellular ATP production were observed, whereas plasma membrane integrity was disrupted only after exposure to PS particles at and only in the nonsyncytialized cells. At this concentration, both weathered and nonweathered particles disrupted the integrity of the plasma membrane; however, such a high concentration might not be relevant, considering environmental exposures. Although human exposure levels are still not well characterized, recently plastic particles were found in human blood at a mean concentration of ,53 suggesting that the lower concentration range tested in this study () might be relevant with regard to environmental exposures. In the in vitro placenta cell models published to date, PS particles generally do not show cytotoxicity.17,18,52 However, a study by Kloet et al.19 showed that positively charged PS particles induced significant cytotoxicity at concentrations , whereas negatively charged particles did not. The authors argue that the electrostatic attraction between the positively charged particle and the negatively charged cell membrane could explain the cytotoxicity observed. The protein corona formed on the surface of the particle incubated with FBS could dominate the charge of that particle making it slightly negative, which could explain why in most in vitro studies that used media supplemented with FBS, no cytotoxicity is generally observed. Studies with various other human cell models link MNP exposure with apoptosis, necrosis, genotoxicity and proinflammatory responses (recently reviewed by González-Acedo et al.11). Toxicity endpoints, other than cell viability, should therefore be considered, as well as longer exposure periods that would be more reflective of the possible long-term accumulation of MNPs in syncytiotrophoblasts in situ.
An important function of the placental syncytiotrophoblasts is the production/metabolism of hormones crucial for the maintenance of pregnancy and fetal development.28,68 Accordingly, dysregulation of syncytiotrophoblasts has been shown to impact placenta functioning and fetal health.54,68 In this study, the effects of MNPs on the expression of genes essential in steroid hormone biosynthesis were tested using syncytialized BeWo b30 cells. From the five genes tested, hsd17b1 was modestly down-regulated in cells exposed to pristine MNPs and to a lesser degree to weathered MNPs, whereas hsd3b1 was marginally down-regulated only after exposure to pristine particles. The enzyme hsd17b1 catalyzes the final step in estrogen biosynthesis by reducing the weak estrogen estrone to yield the potent estrogen ,69 whereas hsd3b1 catalyzes the conversion of pregnenolone to progesterone, among others.70 Though not significantly different relative to controls, the down-regulation of these genes by MNPs was observed in both PS and HPDE at all sizes tested. This finding warrants further investigation using longer exposure periods, because inhibition of hsd17b1 and hsd3b1 has been associated with a reduction of bioavailable levels of these hormones, which may lead to various adverse pregnancy outcomes.71–74
Chemical profiling of PS particles revealed compositional differences between pristine and weathered particles, with the former showing a higher number of unique features. A recent review, based on industrial, scientific, and regulatory data sources, revealed plastic monomers, additives, and processing aids associated with plastics.50 From the plastic-related substances of potential concern (i.e., substances that met one or more of the persistence, bioaccumulation, and toxicity criteria), 58 of the substances were annotated using features detected in the pristine or weathered PS in this study (Figure 2C; Excel Table S3). The primary categories of the plastic-related compounds differing between pristine and weathered particles included 14 use categories (Figure 2C). The presence of these compounds is surprising because the PS particles were single polymer particles, and a large number of impurities was not expected. In-depth chemical characterization of pristine and environmental weather plastics is warranted, which may provide insight into potential sources of impurities present in otherwise pristine particles. Nevertheless, the impurities detected in the pristine particles could be due to leaching of residual monomers/oligomers [e.g., styrene monomers (for PS), aliphatic hydrocarbons (for HDPE), additives (plasticizers, colorants), and processing aids (lubricants, catalyst)], which could contribute to the chemical toxicity of the particles.50,75,76 For example, certain plastic additives such as bisphenols and phthalates are known endocrine-disrupting compounds capable of inhibiting human placental hsd3b1.70,77,78 In this study, several plasticizers and styrene-related compounds have been tentatively identified in the pristine PS particles (Excel Table S3); however, their contribution to the observed subtle effects on gene expression is unknown. The differences in the chemical composition of pristine and weathered PS could come from leaching, hydrolysis, and/or photochemical reactions that occurred during weathering, possibly explaining why weathered particles were less potent. Taken together, these results suggest weathering changes the chemical composition of MNPs, including the potential to alter the baseline composition of particles. PLS-DA analysis revealed differences in chemical characteristics between the different sizes and conditions (pristine vs. weathered PS), suggesting that the surface area of pristine PS additionally influences the chemical composition. These results support the importance of considering environmental weathering processes when performing toxicological studies with MNPs.
Recent evidence demonstrates the presence of MNPs in the human placenta and meconium, which suggests that maternal exposure to MNPs may result in placental uptake, transplacental transport, and fetal exposure.23,79 However, the underlying toxicokinetics and toxicity are still not fully understood. In this study, cells central to the maternal–fetal interface showed limited uptake of pristine and weathered MNPs in vitro, which was associated with a lack of acute toxicity and subtle effects on placental gene expression. Although plastic-associated compounds or co-contaminants might be relevant for the effects observed in this study, more in-depth investigations are needed to better understand the potential health risks of MNPs and chemicals associated with them under real-life conditions and environmentally relevant exposure scenarios. In vitro placenta cell models together with the development of analytical tools and workflows for detection and characterization of MNPs in maternal samples and explorative cohort studies are indispensable to understanding the potential risk associated with MNPs to maternal and fetal health.
Supplementary Material
Acknowledgments
The authors thank I. Rianne van den Meiracker and B. van de Zaan (Deltares, the Netherlands) for providing pristine and weathered MNPs. The authors also thank I. Grigoriev (Utrecht University) for his help and expertise during the imaging of the MNPs. The authors thank I. Jos Vossen and M. Leeuwen (UVDL, Utrecht University) for their help with May–Grunwald–Giemsa staining and J. Kamstra for his help with primer development for qPCR analysis.
This study was supported by the Netherlands Organization for Health Research and Development (ZonMw), under the Microplastics & Health Programme with Project Grant no. 458001003 (40-45800-98-106).
References
- 1.Barboza LGA, Dick Vethaak A, Lavorante BRBO, Lundebye AK, Guilhermino L. 2018. Marine microplastic debris: an emerging issue for food security, food safety and human health. Mar Pollut Bull 133:336–348, PMID: , 10.1016/j.marpolbul.2018.05.047. [DOI] [PubMed] [Google Scholar]
- 2.Cox KD, Covernton GA, Davies HL, Dower JF, Juanes F, Dudas SE. 2019. Human consumption of microplastics. Environ Sci Technol 53(12):7068–7074, PMID: , 10.1021/acs.est.9b01517. [DOI] [PubMed] [Google Scholar]
- 3.Oßmann BE, Sarau G, Holtmannspötter H, Pischetsrieder M, Christiansen SH, Dicke W. 2018. Small-sized microplastics and pigmented particles in bottled mineral water. Water Res 141:307–316, PMID: , 10.1016/j.watres.2018.05.027. [DOI] [PubMed] [Google Scholar]
- 4.Vianello A, Jensen RL, Liu L, Vollertsen J. 2019. Simulating human exposure to indoor airborne microplastics using a breathing thermal manikin. Sci Rep 9(1):8670, PMID: , 10.1038/s41598-019-45054-w. [DOI] [PMC free article] [PubMed] [Google Scholar]
- 5.Wright SL, Ulke J, Font A, Chan KLA, Kelly FJ. 2020. Atmospheric microplastic deposition in an urban environment and an evaluation of transport. Environ Int 136:105411, PMID: , 10.1016/j.envint.2019.105411. [DOI] [PMC free article] [PubMed] [Google Scholar]
- 6.Abbasi S, Keshavarzi B, Moore F, Turner A, Kelly FJ, Dominguez AO, et al. 2019. Distribution and potential health impacts of microplastics and microrubbers in air and street dusts from Asaluyeh County, Iran. Environ Pollut 244:153–164, PMID: , 10.1016/j.envpol.2018.10.039. [DOI] [PubMed] [Google Scholar]
- 7.Vethaak AD, Legler J. 2021. Microplastics and human health: knowledge gaps should be addressed to ascertain the health risks of microplastics. Science 371(6530):672–674, PMID: , 10.1126/science.abe5041. [DOI] [PubMed] [Google Scholar]
- 8.Fournier SB, D’Errico JN, Adler DS, Kollontzi S, Goedken MJ, Fabris L, et al. 2020. Nanopolystyrene translocation and fetal deposition after acute lung exposure during late-stage pregnancy. Part Fibre Toxicol 17(1):55, PMID: , 10.1186/s12989-020-00385-9. [DOI] [PMC free article] [PubMed] [Google Scholar]
- 9.Pitt JA, Trevisan R, Massarsky A, Kozal JS, Levin ED, Di Giulio RT, et al. 2018. Maternal transfer of nanoplastics to offspring in zebrafish (Danio rerio): a case study with nanopolystyrene. Sci Total Environ 643:324–334, PMID: , 10.1016/j.scitotenv.2018.06.186. [DOI] [PMC free article] [PubMed] [Google Scholar]
- 10.Deng Y, Zhang Y, Lemos B, Ren H. 2017. Tissue accumulation of microplastics in mice and biomarker responses suggest widespread health risks of exposure. Sci Rep 7:46687, PMID: , 10.1038/srep46687. [DOI] [PMC free article] [PubMed] [Google Scholar]
- 11.González-Acedo A, García-Recio E, Illescas-Montes R, Ramos-Torrecillas J, Melguizo-Rodríguez L, Costela-Ruiz VJ. 2021. Evidence from in vitro and in vivo studies on the potential health repercussions of micro- and nanoplastics. Chemosphere 280:130826, PMID: , 10.1016/j.chemosphere.2021.130826. [DOI] [PubMed] [Google Scholar]
- 12.Malmqvist E, Jakobsson K, Tinnerberg H, Rignell-Hydbom A, Rylander L. 2013. Gestational diabetes and preeclampsia in association with air pollution at levels below current air quality guidelines. Environ Health Perspect 121(4):488–493, PMID: , 10.1289/ehp.1205736. [DOI] [PMC free article] [PubMed] [Google Scholar]
- 13.Su X, Zhao Y, Yang Y, Hua J. 2020. Correlation between exposure to fine particulate matter and hypertensive disorders of pregnancy in Shanghai, China. Environ Health 19(1):101, PMID: , 10.1186/s12940-020-00655-1. [DOI] [PMC free article] [PubMed] [Google Scholar]
- 14.Wojtyla C, Zielinska K, Wojtyla-Buciora P, Panek G. 2020. Prenatal fine particulate matter (PM2.5) exposure and pregnancy outcomes—analysis of term pregnancies in Poland. Int J Environ Res Public Health 17(16):5820–5829, PMID: , 10.3390/ijerph17165820. [DOI] [PMC free article] [PubMed] [Google Scholar]
- 15.Heindel JJ, Balbus J, Birnbaum L, Brune-Drisse MN, Grandjean P, Gray K, et al. 2015. Developmental origins of health and disease: integrating environmental influences. Endocrinology 156(10):3416–3421, PMID: , 10.1210/EN.2015-1394. [DOI] [PMC free article] [PubMed] [Google Scholar]
- 16.Ho S-M, Cheong A, Adgent MA, Veevers J, Suen AA, Tam NNC, et al. 2017. Environmental factors, epigenetics, and developmental origin of reproductive disorders. Reprod Toxicol 68:85–104, PMID: , 10.1016/j.reprotox.2016.07.011. [DOI] [PMC free article] [PubMed] [Google Scholar]
- 17.Hesler M, Aengenheister L, Ellinger B, Drexel R, Straskraba S, Jost C, et al. 2019. Multi-endpoint toxicological assessment of polystyrene nano- and microparticles in different biological models in vitro. Toxicol In Vitro 61:104610, PMID: , 10.1016/j.tiv.2019.104610. [DOI] [PubMed] [Google Scholar]
- 18.Rothbauer M, Patel N, Gondola H, Siwetz M, Huppertz B, Ertl P. 2017. A comparative study of five physiological key parameters between four different human trophoblast-derived cell lines. Sci Rep 7(1):5892, PMID: , 10.1038/s41598-017-06364-z. [DOI] [PMC free article] [PubMed] [Google Scholar]
- 19.Kloet SK, Walczak AP, Louisse J, van den Berg HHJ, Bouwmeester H, Tromp P, et al. 2015. Translocation of positively and negatively charged polystyrene nanoparticles in an in vitro placental model. Toxicol In Vitro 29(7):1701–1710, PMID: , 10.1016/j.tiv.2015.07.003. [DOI] [PubMed] [Google Scholar]
- 20.Grafmueller S, Manser P, Diener L, Diener P-A, Maeder-Althaus X, Maurizi L, et al. 2015. Bidirectional transfer study of polystyrene nanoparticles across the placenta barrier in an ex vivo human placental perfusion model. Environ Health Perspect 123(12):1280–1286, PMID: , 10.1289/ehp.1409271. [DOI] [PMC free article] [PubMed] [Google Scholar]
- 21.Gruber MM, Hirschmugl B, Berger N, Holter M, Radulović S, Leitinger G, et al. 2020. Plasma proteins facilitates placental transfer of polystyrene particles. J Nanobiotechnol 18(1):128, PMID: , 10.1186/s12951-020-00676-5. [DOI] [PMC free article] [PubMed] [Google Scholar]
- 22.Wick P, Malek A, Manser P, Meili D, Maeder-Althaus X, Diener L, et al. 2010. Barrier capacity of human placenta for nanosized materials. Environ Health Perspect 118(3):432–436, PMID: , 10.1289/ehp.0901200. [DOI] [PMC free article] [PubMed] [Google Scholar]
- 23.Ragusa A, Svelato A, Santacroce C, Catalano P, Notarstefano V, Carnevali O, et al. 2021. Plasticenta: first evidence of microplastics in human placenta. Environ Int 146:106274, PMID: , 10.1016/j.envint.2020.106274. [DOI] [PubMed] [Google Scholar]
- 24.Maltepe E, Fisher SJ. 2015. Placenta: the forgotten organ. Annu Rev Cell Dev Biol 31:523–552, PMID: , 10.1146/annurev-cellbio-100814-125620. [DOI] [PubMed] [Google Scholar]
- 25.Gude NM, Roberts CT, Kalionis B, King RG. 2004. Growth and function of the normal human placenta. Thromb Res 114(5–6):397–407, PMID: , 10.1016/j.thromres.2004.06.038. [DOI] [PubMed] [Google Scholar]
- 26.Knöfler M, Haider S, Saleh L, Pollheimer J, Gamage TKJB, James J. 2019. Human placenta and trophoblast development: key molecular mechanisms and model systems. Cell Mol Life Sci 76(18):3479–3496, PMID: , 10.1007/s00018-019-03104-6. [DOI] [PMC free article] [PubMed] [Google Scholar]
- 27.Malassiné A, Cronier L. 2002. Hormones and human trophoblast differentiation: a review. Endocrine 19(1):3–11, PMID: , 10.1385/ENDO:19:1:3. [DOI] [PubMed] [Google Scholar]
- 28.Costa MA. 2016. The endocrine function of human placenta: an overview. Reprod Biomed Online 32(1):14–43, PMID: , 10.1016/j.rbmo.2015.10.005. [DOI] [PubMed] [Google Scholar]
- 29.Kingdom J, Huppertz B, Seaward G, Kaufmann P. 2000. Development of the placental villous tree and its consequences for fetal growth. Eur J Obstet Gynecol Reprod Biol 92(1):35–43, PMID: , 10.1016/S0301-2115(00)00423-1. [DOI] [PubMed] [Google Scholar]
- 30.Aplin JD, Myers JE, Timms K, Westwood M. 2020. Tracking placental development in health and disease. Nat Rev Endocrinol 16(9):479–494, PMID: , 10.1038/s41574-020-0372-6. [DOI] [PubMed] [Google Scholar]
- 31.Burton GJ, Jauniaux E. 2018. Pathophysiology of placental-derived fetal growth restriction. Am J Obstet Gynecol 218(2S):S745–S761, PMID: , 10.1016/j.ajog.2017.11.577. [DOI] [PubMed] [Google Scholar]
- 32.Orendi K, Kivity V, Sammar M, Grimpel Y, Gonen R, Meiri H, et al. 2011. Placental and trophoblastic in vitro models to study preventive and therapeutic agents for preeclampsia. Placenta 32(suppl 1):S49–S54, PMID: , 10.1016/j.placenta.2010.11.023. [DOI] [PubMed] [Google Scholar]
- 33.Muoth C, Großgarten M, Karst U, Ruiz J, Astruc D, Moya S, et al. 2017. Impact of particle size and surface modification on gold nanoparticle penetration into human placental microtissues. Nanomedicine (Lond) 12(10):1119–1133, PMID: , 10.2217/nnm-2017-0428. [DOI] [PubMed] [Google Scholar]
- 34.Abdelkhaliq A, Van Der Zande M, Peters RJB, Bouwmeester H. 2020. Combination of the BeWo b30 placental transport model and the embryonic stem cell test to assess the potential developmental toxicity of silver nanoparticles. Part Fibre Toxicol 17(1):11, PMID: , 10.1186/s12989-020-00342-6. [DOI] [PMC free article] [PubMed] [Google Scholar]
- 35.Poulsen MS, Mose T, Maroun LL, Mathiesen L, Knudsen LE, Rytting E. 2015. Kinetics of silica nanoparticles in the human placenta. Nanotoxicology 9(suppl 1):79–86, PMID: , 10.3109/17435390.2013.812259. [DOI] [PMC free article] [PubMed] [Google Scholar]
- 36.Heaton SJ, Eady JJ, Parker ML, Gotts KL, Dainty JR, Fairweather-Tait SJ, et al. 2008. The use of BeWo cells as an in vitro model for placental iron transport. Am J Physiol Cell Physiol 295(5):C1445–C1453, PMID: , 10.1152/ajpcell.00286.2008. [DOI] [PMC free article] [PubMed] [Google Scholar]
- 37.Orendi K, Gauster M, Moser G, Meiri H, Huppertz B. 2010. The choriocarcinoma cell line BeWo: syncytial fusion and expression of syncytium-specific proteins. Reproduction 140(5):759–766, PMID: , 10.1530/REP-10-0221. [DOI] [PubMed] [Google Scholar]
- 38.Azar C, Valentine M, Trausch-Azar J, Druley T, Nelson DM, Schwartz AL. 2018. RNA-seq identifies genes whose proteins are transformative in the differentiation of cytotrophoblast to syncytiotrophoblast, in human primary villous and BeWo trophoblasts. Sci Rep 8(1):5142, PMID: , 10.1038/s41598-018-23379-2. [DOI] [PMC free article] [PubMed] [Google Scholar]
- 39.Wice B, Menton D, Geuze H, Schwartz AL. 1990. Modulators of cyclic AMP metabolism induce syncytiotrophoblast formation in vitro. Exp Cell Res 186(2):306–316, PMID: , 10.1016/0014-4827(90)90310-7. [DOI] [PubMed] [Google Scholar]
- 40.Kallol S, Moser-Haessig R, Ontsouka CE, Albrecht C. 2018. Comparative expression patterns of selected membrane transporters in differentiated BeWo and human primary trophoblast cells. Placenta 72–73:48–52, PMID: , 10.1016/j.placenta.2018.10.008. [DOI] [PubMed] [Google Scholar]
- 41.Zhang S, Li J, Lykotrafitis G, Bao G, Suresh S. 2009. Size-dependent endocytosis of nanoparticles. Adv Mater 21:419–424, PMID: , 10.1002/adma.200801393. [DOI] [PMC free article] [PubMed] [Google Scholar]
- 42.Albanese A, Tang PS, Chan WCW. 2012. The effect of nanoparticle size, shape, and surface chemistry on biological systems. Annu Rev Biomed Eng 14:1–16, PMID: , 10.1146/annurev-bioeng-071811-150124. [DOI] [PubMed] [Google Scholar]
- 43.Von Moos N, Burkhardt-Holm P, Köhler A. 2012. Uptake and effects of microplastics on cells and tissue of the blue mussel mytilus edulis L. after an experimental exposure. Environ Sci Technol 46(20):11327–11335, PMID: , 10.1021/es302332w. [DOI] [PubMed] [Google Scholar]
- 44.Liu KH, Nellis M, Uppal K, Ma C, Tran V, Liang Y, et al. 2020. Reference standardization for quantification and harmonization of large-scale metabolomics. Anal Chem 92(13):8836–8844, PMID: , 10.1021/acs.analchem.0c00338. [DOI] [PMC free article] [PubMed] [Google Scholar]
- 45.Yu T, Park Y, Johnson JM, Jones DP. 2009. apLCMS-adaptive processing of high-resolution LC/MS data. Bioinformatics 25(15):1930–1936, PMID: , 10.1093/bioinformatics/btp291. [DOI] [PMC free article] [PubMed] [Google Scholar]
- 46.Uppal K, Soltow QA, Strobel FH, Pittard WS, Gernert KM, Yu T, et al. 2013. XMSanalyzer: automated pipeline for improved feature detection and downstream analysis of large-scale, non-targeted metabolomics data. BMC Bioinformatics 14(1):15, PMID: , 10.1186/1471-2105-14-15. [DOI] [PMC free article] [PubMed] [Google Scholar]
- 47.Groh KJ, Backhaus T, Carney-Almroth B, Geueke B, Inostroza PA, Lennquist A, et al. 2019. Overview of known plastic packaging-associated chemicals and their hazards. Sci Total Environ 651(pt 2):3253–3268, PMID: , 10.1016/j.scitotenv.2018.10.015. [DOI] [PubMed] [Google Scholar]
- 48.Schymanski EL, Jeon J, Gulde R, Fenner K, Ruff M, Singer HP, et al. 2014. Identifying small molecules via high resolution mass spectrometry: communicating confidence. Environ Sci Technol 48(4):2097–2098, PMID: , 10.1021/es5002105. [DOI] [PubMed] [Google Scholar]
- 49.Schymanski EL, Kondić T, Neumann S, Thiessen PA, Zhang J, Bolton EE. 2021. Empowering large chemical knowledge bases for exposomics: pubChemLite meets MetFrag. J Cheminform 13(1):19, PMID: , 10.1186/s13321-021-00489-0. [DOI] [PMC free article] [PubMed] [Google Scholar]
- 50.Wiesinger H, Wang Z, Hellweg S. 2021. Deep dive into plastic monomers, additives, and processing aids. Environ Sci Technol 55(13):9339–9351, PMID: , 10.1021/ACS.EST.1C00976. [DOI] [PubMed] [Google Scholar]
- 51.Piaton E, Fabre M, Goubin-Versini I, Bretz-Grenier M-F, Courtade-Saïdi M, Vincent S, et al. 2016. Guidelines for May–Grünwald–Giemsa staining in haematology and non-gynaecological cytopathology: recommendations of the French Society of Clinical Cytology (SFCC) and of the French Association for Quality Assurance in Anatomic and Cytologic Pathology (AFAQAP). Cytopathology 27(5):359–368, PMID: , 10.1111/cyt.12323. [DOI] [PubMed] [Google Scholar]
- 52.Cartwright L, Poulsen MS, Nielsen HM, Pojana G, Knudsen LE, Saunders M, et al. 2012. In vitro placental model optimization for nanoparticle transport studies. Int J Nanomedicine 7:497–510, PMID: , 10.2147/IJN.S26601. [DOI] [PMC free article] [PubMed] [Google Scholar]
- 53.Leslie HA, van Velzen MJM, Brandsma SH, Vethaak AD, Garcia-Vallejo JJ, Lamoree MH. 2022. Discovery and quantification of plastic particle pollution in human blood. Environ Int 163:107199. PMID: , 10.1016/j.envint.2022.107199. [DOI] [PubMed] [Google Scholar]
- 54.Kidima WB. 2015. Syncytiotrophoblast functions and fetal growth restriction during placental malaria: updates and implication for future interventions. Biomed Res Int 2015:451735, PMID: , 10.1155/2015/451735. [DOI] [PMC free article] [PubMed] [Google Scholar]
- 55.Grafmüller S, Manser P, Krug HF, Wick P, von Mandach U. 2013. Determination of the transport rate of xenobiotics and nanomaterials across the placenta using the ex vivo human placental perfusion model. J Vis Exp 76:50401, PMID: , 10.3791/50401. [DOI] [PMC free article] [PubMed] [Google Scholar]
- 56.Aengenheister L, Keevend K, Muoth C, Schönenberger R, Diener L, Wick P, et al. 2018. An advanced human in vitro co-culture model for translocation studies across the placental barrier. Sci Rep 8(1):5388, PMID: , 10.1038/s41598-018-23410-6. [DOI] [PMC free article] [PubMed] [Google Scholar]
- 57.Tang H, Jiang Z, He H, Li X, Hu H, Zhang N, et al. 2018. Uptake and transport of pullulan acetate nanoparticles in the BeWo b30 placental barrier cell model. Int J Nanomedicine 13:4073–4082, PMID: , 10.2147/IJN.S161319. [DOI] [PMC free article] [PubMed] [Google Scholar]
- 58.Correia Carreira S, Cartwright L, Mathiesen L, Knudsen LE, Saunders M. 2011. Studying placental transfer of highly purified non-dioxin-like PCBs in two models of the placental barrier. Placenta 32(3):283–291, PMID: , 10.1016/j.placenta.2010.12.024. [DOI] [PubMed] [Google Scholar]
- 59.Poulsen MS, Rytting E, Mose T, Knudsen LE. 2009. Modeling placental transport: correlation of in vitro BeWo cell permeability and ex vivo human placental perfusion. Toxicol In Vitro 23(7):1380–1386, PMID: , 10.1016/j.tiv.2009.07.028. [DOI] [PubMed] [Google Scholar]
- 60.Bode CJ, Jin H, Rytting E, Silverstein PS, Young AM, Audus KL. 2006. In vitro models for studying trophoblast transcellular transport. Methods Mol Med 122:225–239, PMID: , 10.1385/1-59259-989-3:225. [DOI] [PMC free article] [PubMed] [Google Scholar]
- 61.Liu NM, Miyashita L, Maher BA, McPhail G, Jones CJP, Barratt B, et al. 2021. Evidence for the presence of air pollution nanoparticles in placental tissue cells. Sci Total Environ 751:142235, PMID: , 10.1016/j.scitotenv.2020.142235. [DOI] [PubMed] [Google Scholar]
- 62.Choy MY, Manyonda IT. 1998. The phagocytic activity of human first trimester extravillous trophoblast. Hum Reprod 13(10):2941–2949, PMID: , 10.1093/humrep/13.10.2941. [DOI] [PubMed] [Google Scholar]
- 63.Bongaerts E, Nawrot TS, Van Pee T, Ameloot M, Bové H. 2020. Translocation of (ultra)fine particles and nanoparticles across the placenta; a systematic review on the evidence of in vitro, ex vivo, and in vivo studies. Part Fibre Toxicol 17(1):56, PMID: , 10.1186/s12989-020-00386-8. [DOI] [PMC free article] [PubMed] [Google Scholar]
- 64.Mathiesen L, Rytting E, Mose T, Knudsen LE. 2009. Transport of benzo[α]pyrene in the dually perfused human placenta perfusion model: effect of albumin in the perfusion medium. Basic Clin Pharmacol Toxicol 105(3):181–187, PMID: , 10.1111/j.1742-7843.2009.00431.x. [DOI] [PubMed] [Google Scholar]
- 65.Lesniak A, Campbell A, Monopoli MP, Lynch I, Salvati A, Dawson KA. 2010. Serum heat inactivation affects protein corona composition and nanoparticle uptake. Biomaterials 31(36):9511–9518, PMID: , 10.1016/j.biomaterials.2010.09.049. [DOI] [PubMed] [Google Scholar]
- 66.Monopoli MP, Walczyk D, Campbell A, Elia G, Lynch I, Bombelli FB, et al. 2011. Physical-chemical aspects of protein corona: relevance to in vitro and in vivo biological impacts of nanoparticles. J Am Chem Soc 133(8):2525–2534, PMID: , 10.1021/ja107583h. [DOI] [PubMed] [Google Scholar]
- 67.Strojan K, Leonardi A, Bregar VB, Križaj I, Svete J, Pavlin M. 2017. Dispersion of nanoparticles in different media importantly determines the composition of their protein corona. PLoS One 12(1):e0169552, 10.1371/journal.pone.0169552. [DOI] [PMC free article] [PubMed] [Google Scholar]
- 68.Chatuphonprasert W, Jarukamjorn K, Ellinger I. 2018. Physiology and pathophysiology of steroid biosynthesis, transport and metabolism in the human placenta. Front Pharmacol 9:1027, PMID: , 10.3389/fphar.2018.01027. [DOI] [PMC free article] [PubMed] [Google Scholar]
- 69.He W, Gauri M, Li T, Wang R, Lin SX. 2016. Current knowledge of the multifunctional 17β-hydroxysteroid dehydrogenase type 1 (HSD17B1). Gene 588(1):54–61, PMID: , 10.1016/j.gene.2016.04.031. [DOI] [PMC free article] [PubMed] [Google Scholar]
- 70.Zhu Q, Pan P, Chen X, Wang Y, Zhang S, Mo J, et al. 2019. Human placental 3β-hydroxysteroid dehydrogenase/steroid Δ5,4-isomerase 1: identity, regulation and environmental inhibitors. Toxicology 425:152253, PMID: , 10.1016/j.tox.2019.152253. [DOI] [PubMed] [Google Scholar]
- 71.Ishibashi O, Ohkuchi A, Ali MM, Kurashina R, Luo S-S, Ishikawa T, et al. 2012. Hydroxysteroid (17-β) dehydrogenase 1 is dysregulated by miR-210 and miR-518c that are aberrantly expressed in preeclamptic placentas: a novel marker for predicting preeclampsia. Hypertension 59(2):265–273, PMID: , 10.1161/HYPERTENSIONAHA.111.180232. [DOI] [PubMed] [Google Scholar]
- 72.Ohkuchi A, Ishibashi O, Hirashima C, Takahashi K, Matsubara S, Takizawa T, et al. 2012. Plasma level of hydroxysteroid (17-β) dehydrogenase 1 in the second trimester is an independent risk factor for predicting preeclampsia after adjusting for the effects of mean blood pressure, bilateral notching and plasma level of soluble fms-like tyrosine kinase 1/placental growth factor ratio. Hypertens Res 35(12):1152–1158, PMID: , 10.1038/hr.2012.109. [DOI] [PubMed] [Google Scholar]
- 73.Vondra S, Kunihs V, Eberhart T, Eigner K, Bauer R, Haslinger P, et al. 2019. Metabolism of cholesterol and progesterone is differentially regulated in primary trophoblastic subtypes and might be disturbed in recurrent miscarriages. J Lipid Res 60(11):1922–1934, PMID: , 10.1194/jlr.P093427. [DOI] [PMC free article] [PubMed] [Google Scholar]
- 74.Zhu H, Huang L, He Z, Zou Z, Luo Y. 2018. Estrogen-related receptor γ regulates expression of 17β-hydroxysteroid dehydrogenase type 1 in fetal growth restriction. Placenta 67:38–44, PMID: , 10.1016/j.placenta.2018.05.012. [DOI] [PubMed] [Google Scholar]
- 75.Björnsdotter M. 2015. Leaching of Residual Monomers, Oligomers and Additives from Polyethylene, Polypropylene, Polyvinyl Chloride, High-Density Polyethylene and Polystyrene Virgin Plastics, https://www.diva-portal.org/smash/get/diva2:855478/FULLTEXT01.pdf [accessed 12 August 2021].
- 76.Martínez-Gómez C, León VM, Calles S, Gomáriz-Olcina M, Vethaak AD. 2017. The adverse effects of virgin microplastics on the fertilization and larval development of sea urchins. Mar Environ Res 130:69–76, PMID: , 10.1016/j.marenvres.2017.06.016. [DOI] [PubMed] [Google Scholar]
- 77.Xu R-A, Mao B, Li S, Liu J, Li X, Li H, et al. 2016. Structure-activity relationships of phthalates in inhibition of human placental 3β-hydroxysteroid dehydrogenase 1 and aromatase. Reprod Toxicol 61:151–161, PMID: , 10.1016/j.reprotox.2016.04.004. [DOI] [PubMed] [Google Scholar]
- 78.Zhang S, Mo J, Wang Y, Ni C, Li X, Zhu Q, et al. 2019. Endocrine disruptors of inhibiting testicular 3β-hydroxysteroid dehydrogenase. Chem Biol Interact 303:90–97, PMID: , 10.1016/j.cbi.2019.02.027. [DOI] [PubMed] [Google Scholar]
- 79.Zhang J, Wang L, Trasande L, Kannan K. 2021. Occurrence of polyethylene terephthalate and polycarbonate microplastics in infant and adult feces. Environ Sci Technol Lett 8(11):989–994, 10.1021/acs.estlett.1c00559. [DOI] [Google Scholar]
Associated Data
This section collects any data citations, data availability statements, or supplementary materials included in this article.